ZP3
Olink Explore plasma protein · SNPBoost PRS model
R2 Full Model
0.7546
pearson_coefficent
0.862
sparsity
124
n_cis_pqtl
21
max_cis_pqtl
rs10228441
Diagnostics
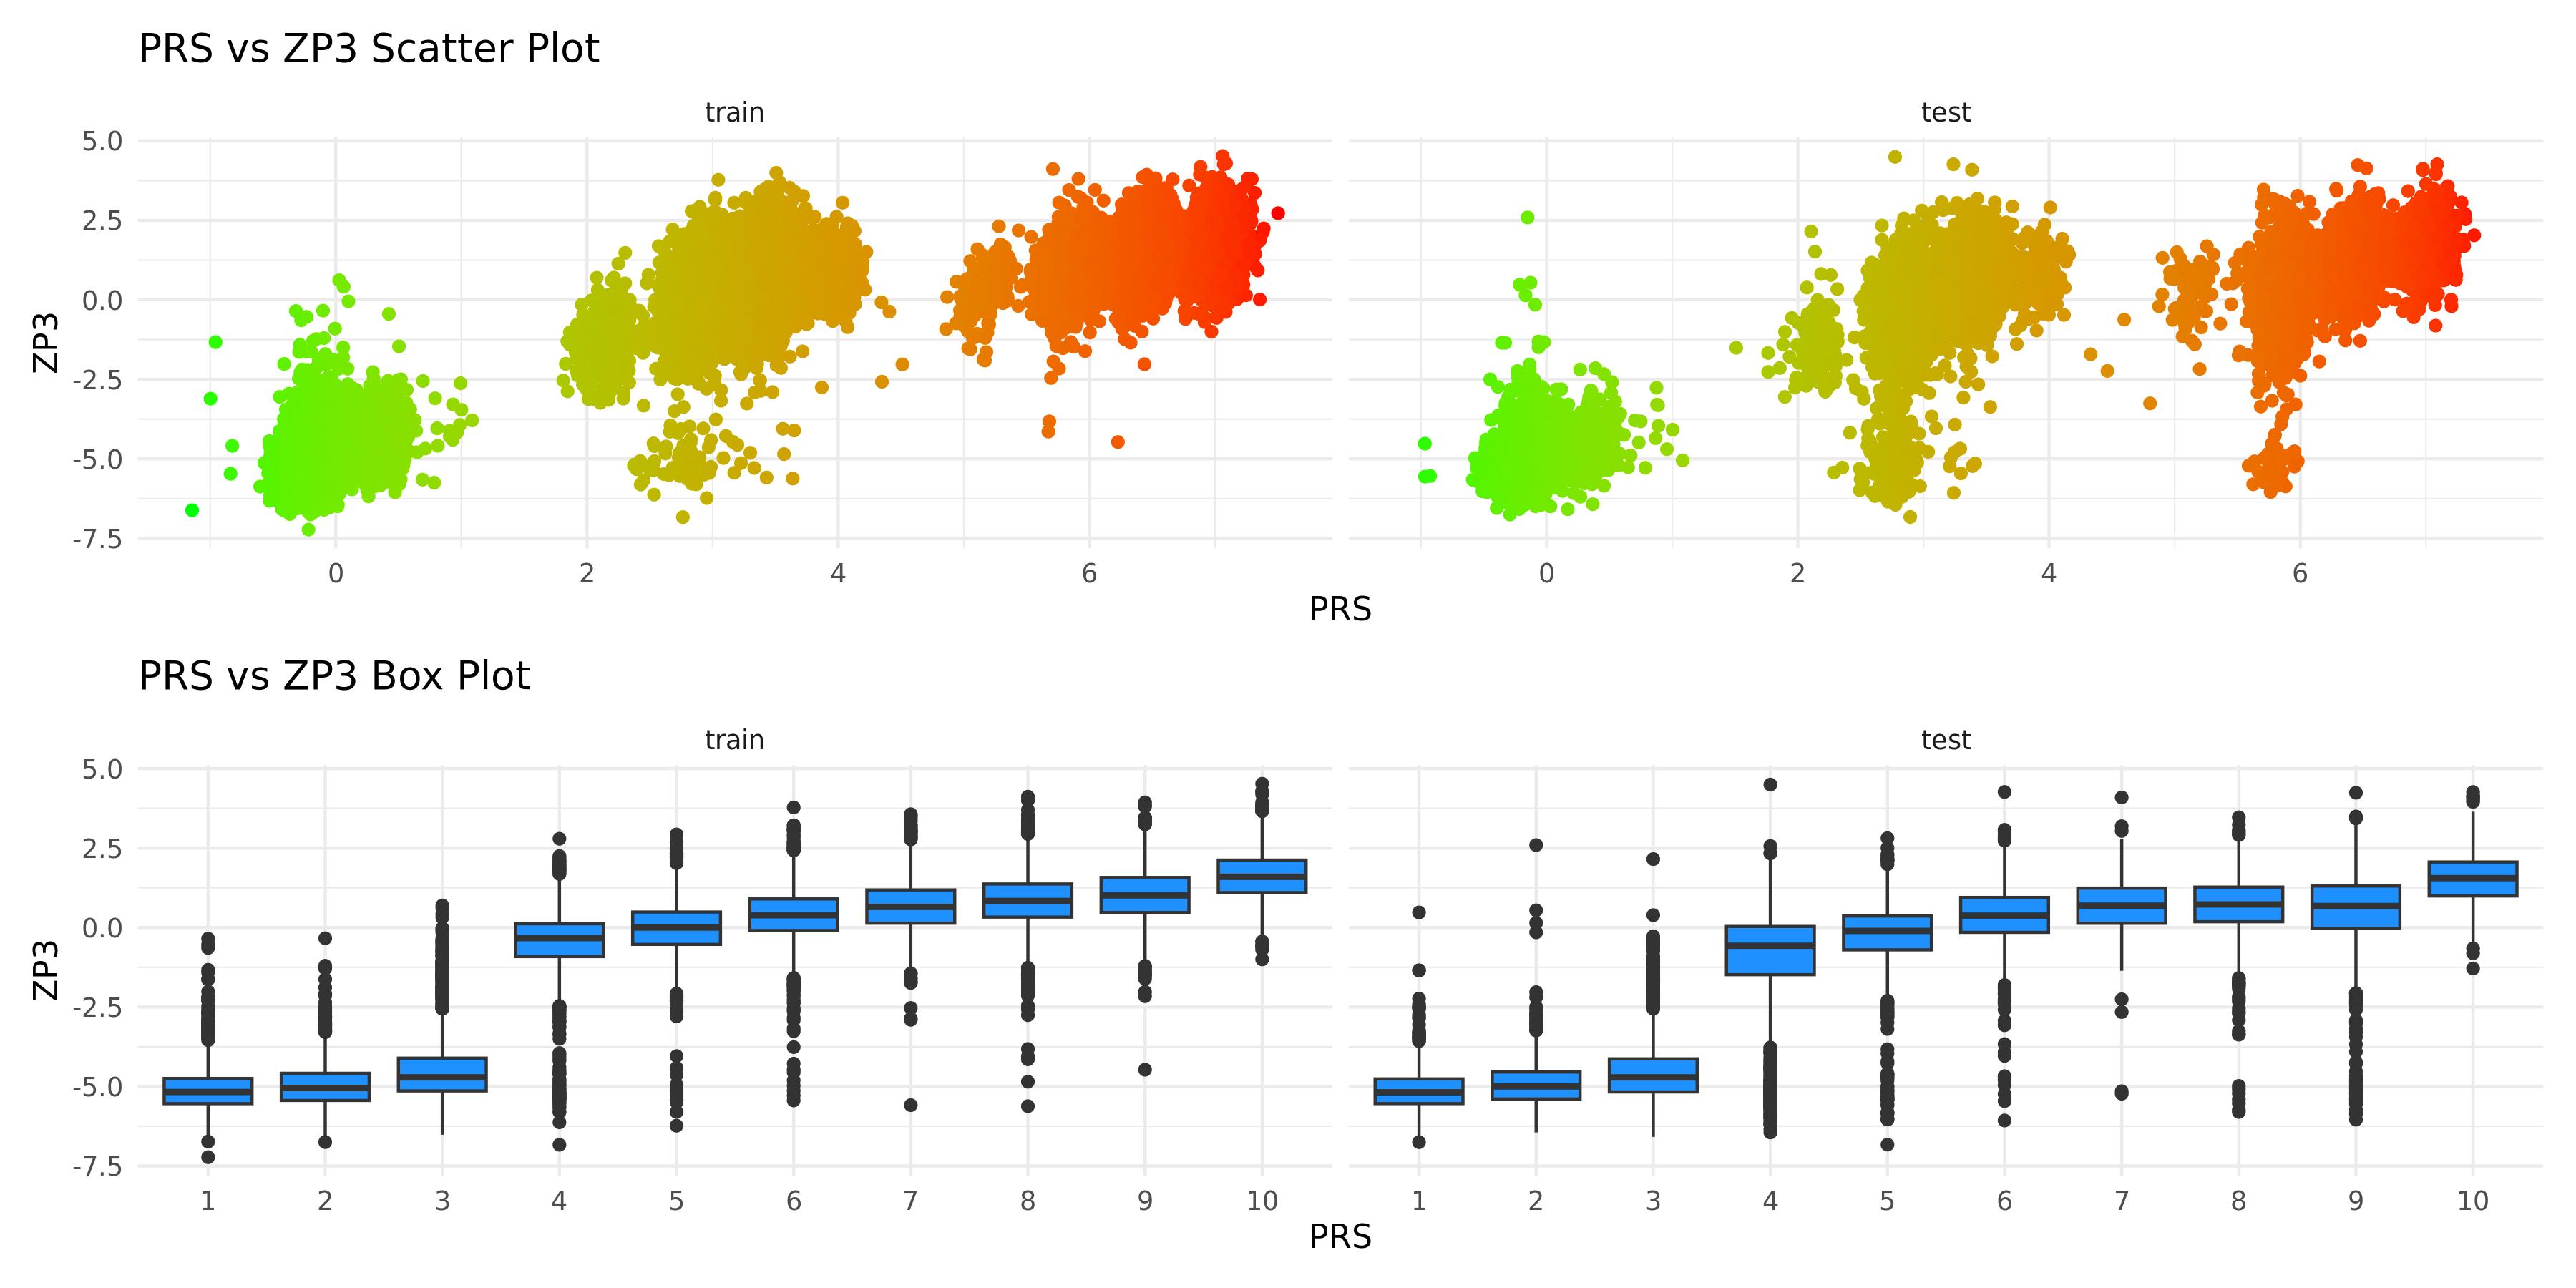
PRS scatter and box plotsenlarge ⤢
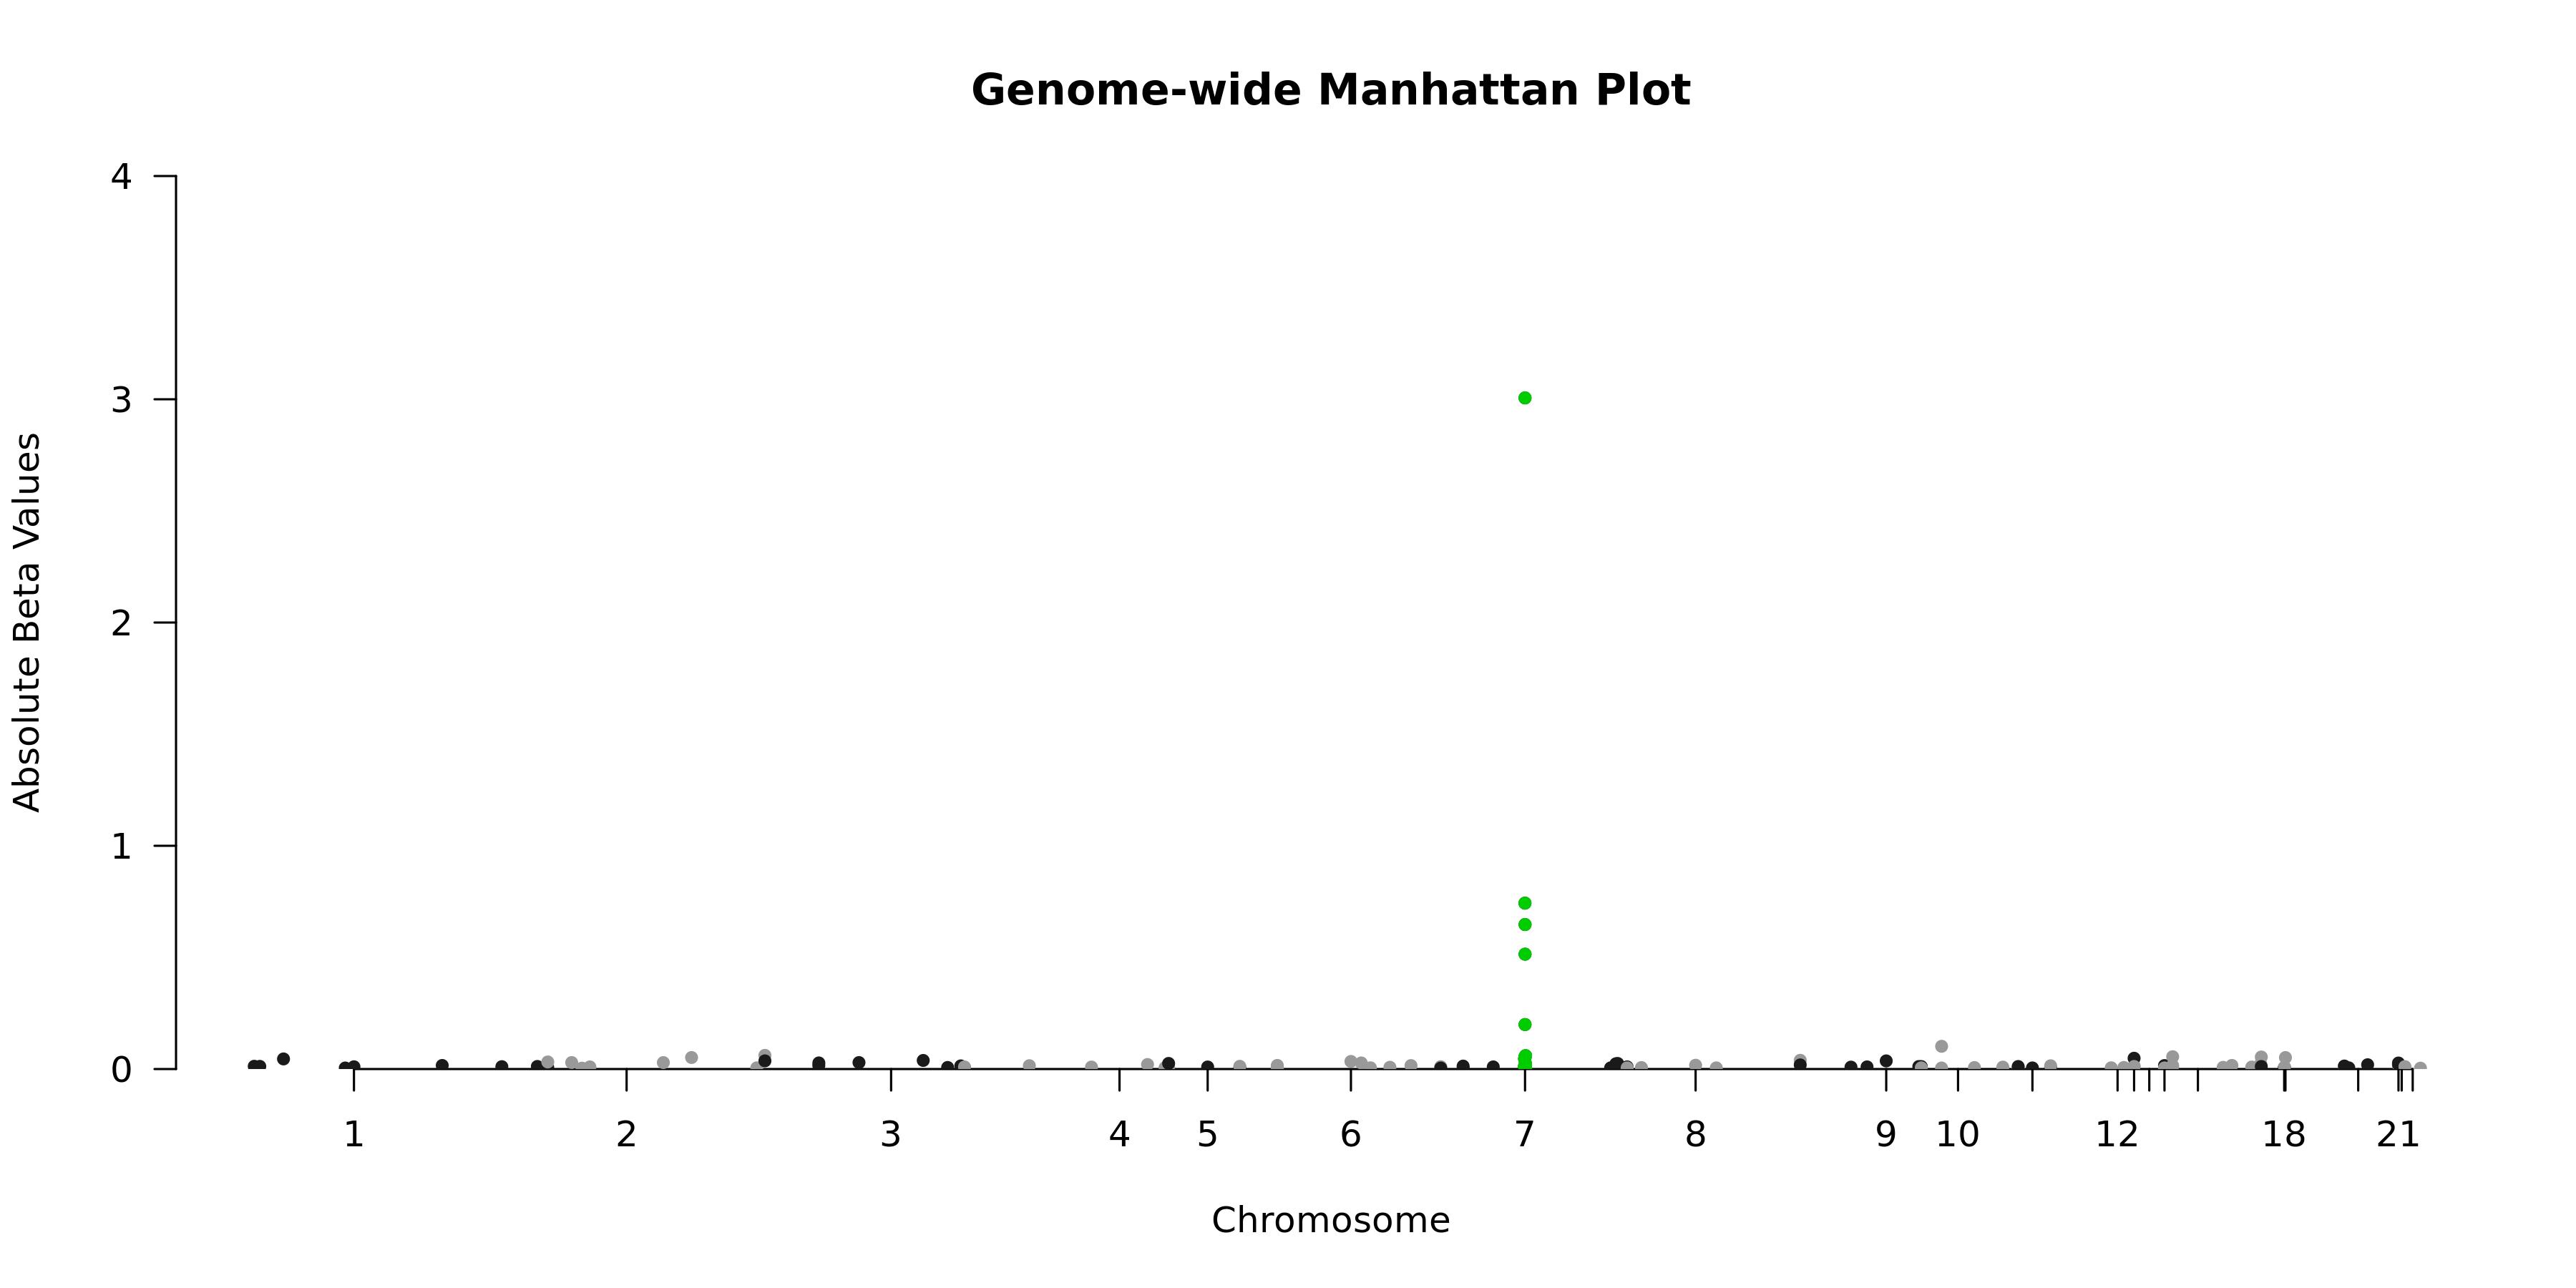
Genome-wide Manhattan Plotenlarge ⤢
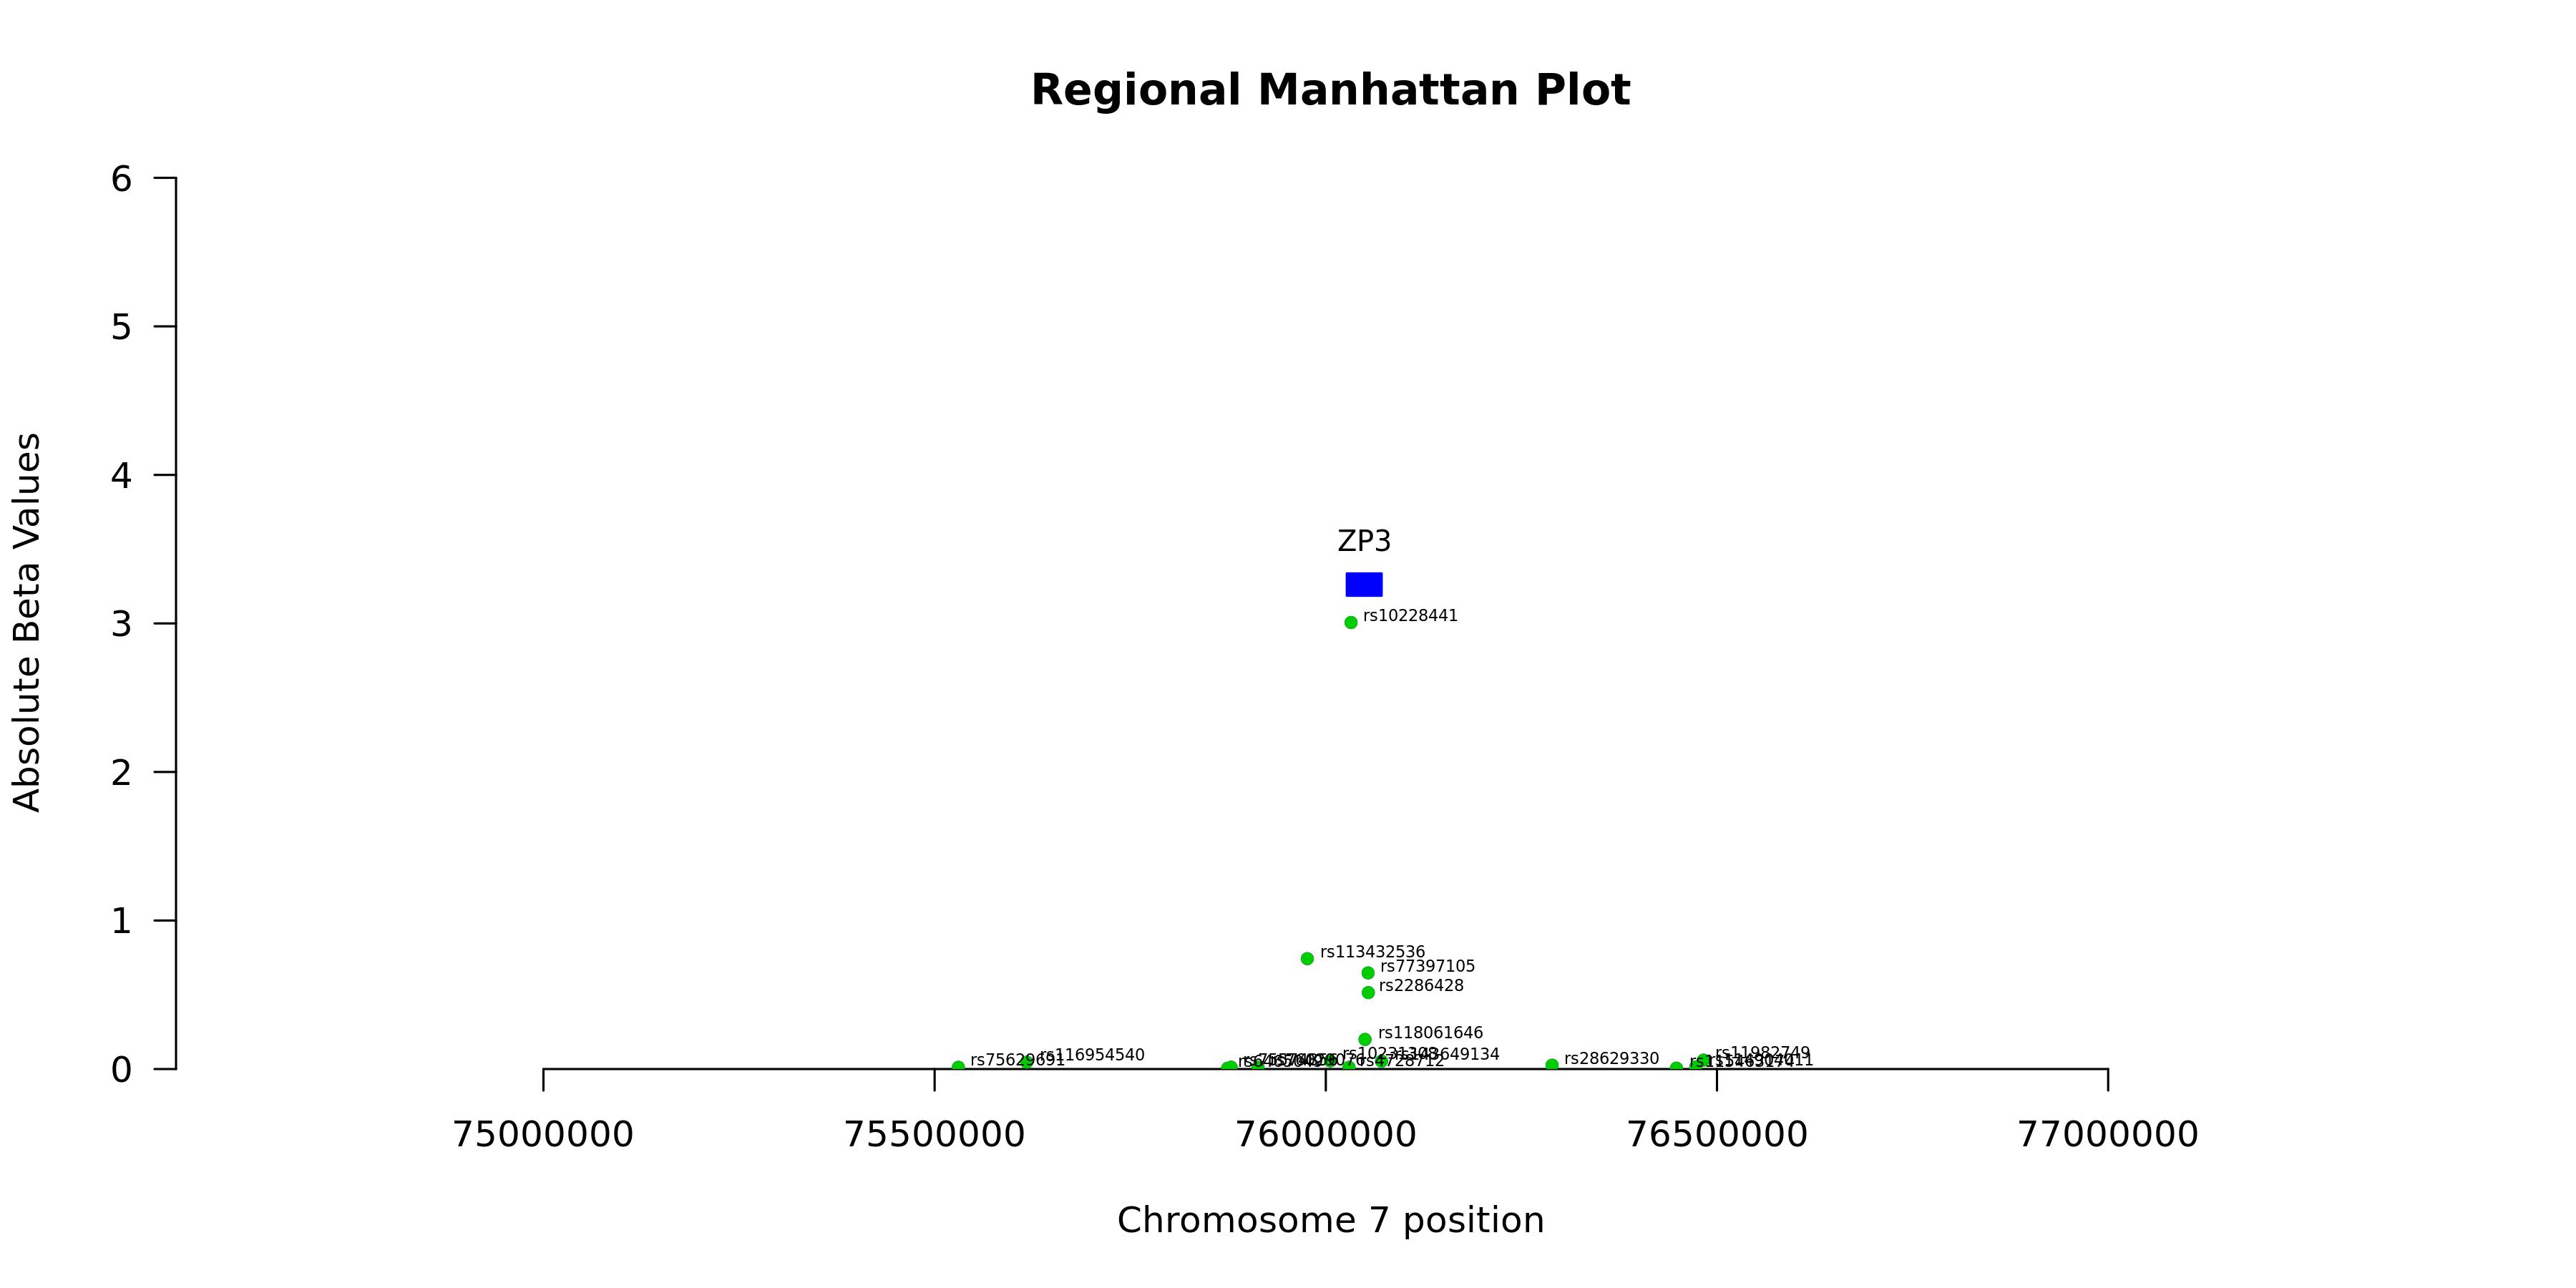
Regional Manhattan Plotenlarge ⤢
Model record
Field
Value
Gene
ZP3
test_n
10538
sparsity
124
pearson_coefficent
0.862007291766502
SE
0.00551821982638502
P_corr
0
R2 Covariate Model
0.0049
R2 Full Model
0.7546
P
0
P_full
0
n_cis_pqtl
21
max_cis_pqtl
rs10228441
rank_max_cis_pqtl
1
mean_pqtl_beta
0.261292164413507
mean_nopqtl_beta
0.0163129424726085
percentage_pqtl
0.169354838709677
percentage_nopqtl
0.830645161290323
cis and genome-wide metrics
Field
Value
Gene
ZP3
test_n_genomewide
10538
sparsity_genomewide
124
pearson_coefficent_genomewide
0.862007291766502
SE_genomewide
0.00551821982638502
P_corr_genomewide
0
R2_covariate_model_genomewide
0.00489458309143509
R2_full_model_genomewide
0.754617077040228
P_genomewide
0
P_full_genomewide
0
n_cis_pqtl
21
max_cis_pqtl
rs10228441
rank_max_cis_pqtl
1
mean_pqtl_beta
0.261292164413507
mean_nopqtl_beta
0.0163129424726085
percentage_pqtl
0.169354838709677
percentage_nopqtl
0.830645161290323
test_n_cis
10538
sparsity_cis
21
pearson_coefficent_cis
0.859238822069966
SE_cis
0.00556915461534602
P_corr_cis
0
R2_covariate_model_cis
0.00489458309143509
R2_full_model_cis
0.750851045140278
P_cis
0
P_full_cis
0