VIT
Olink Explore plasma protein · SNPBoost PRS model
R2 Full Model
0.3641
pearson_coefficent
0.4275
sparsity
239
n_cis_pqtl
27
max_cis_pqtl
rs141908607
Diagnostics
PRS scatter and box plotsenlarge ⤢

Genome-wide Manhattan Plotenlarge ⤢

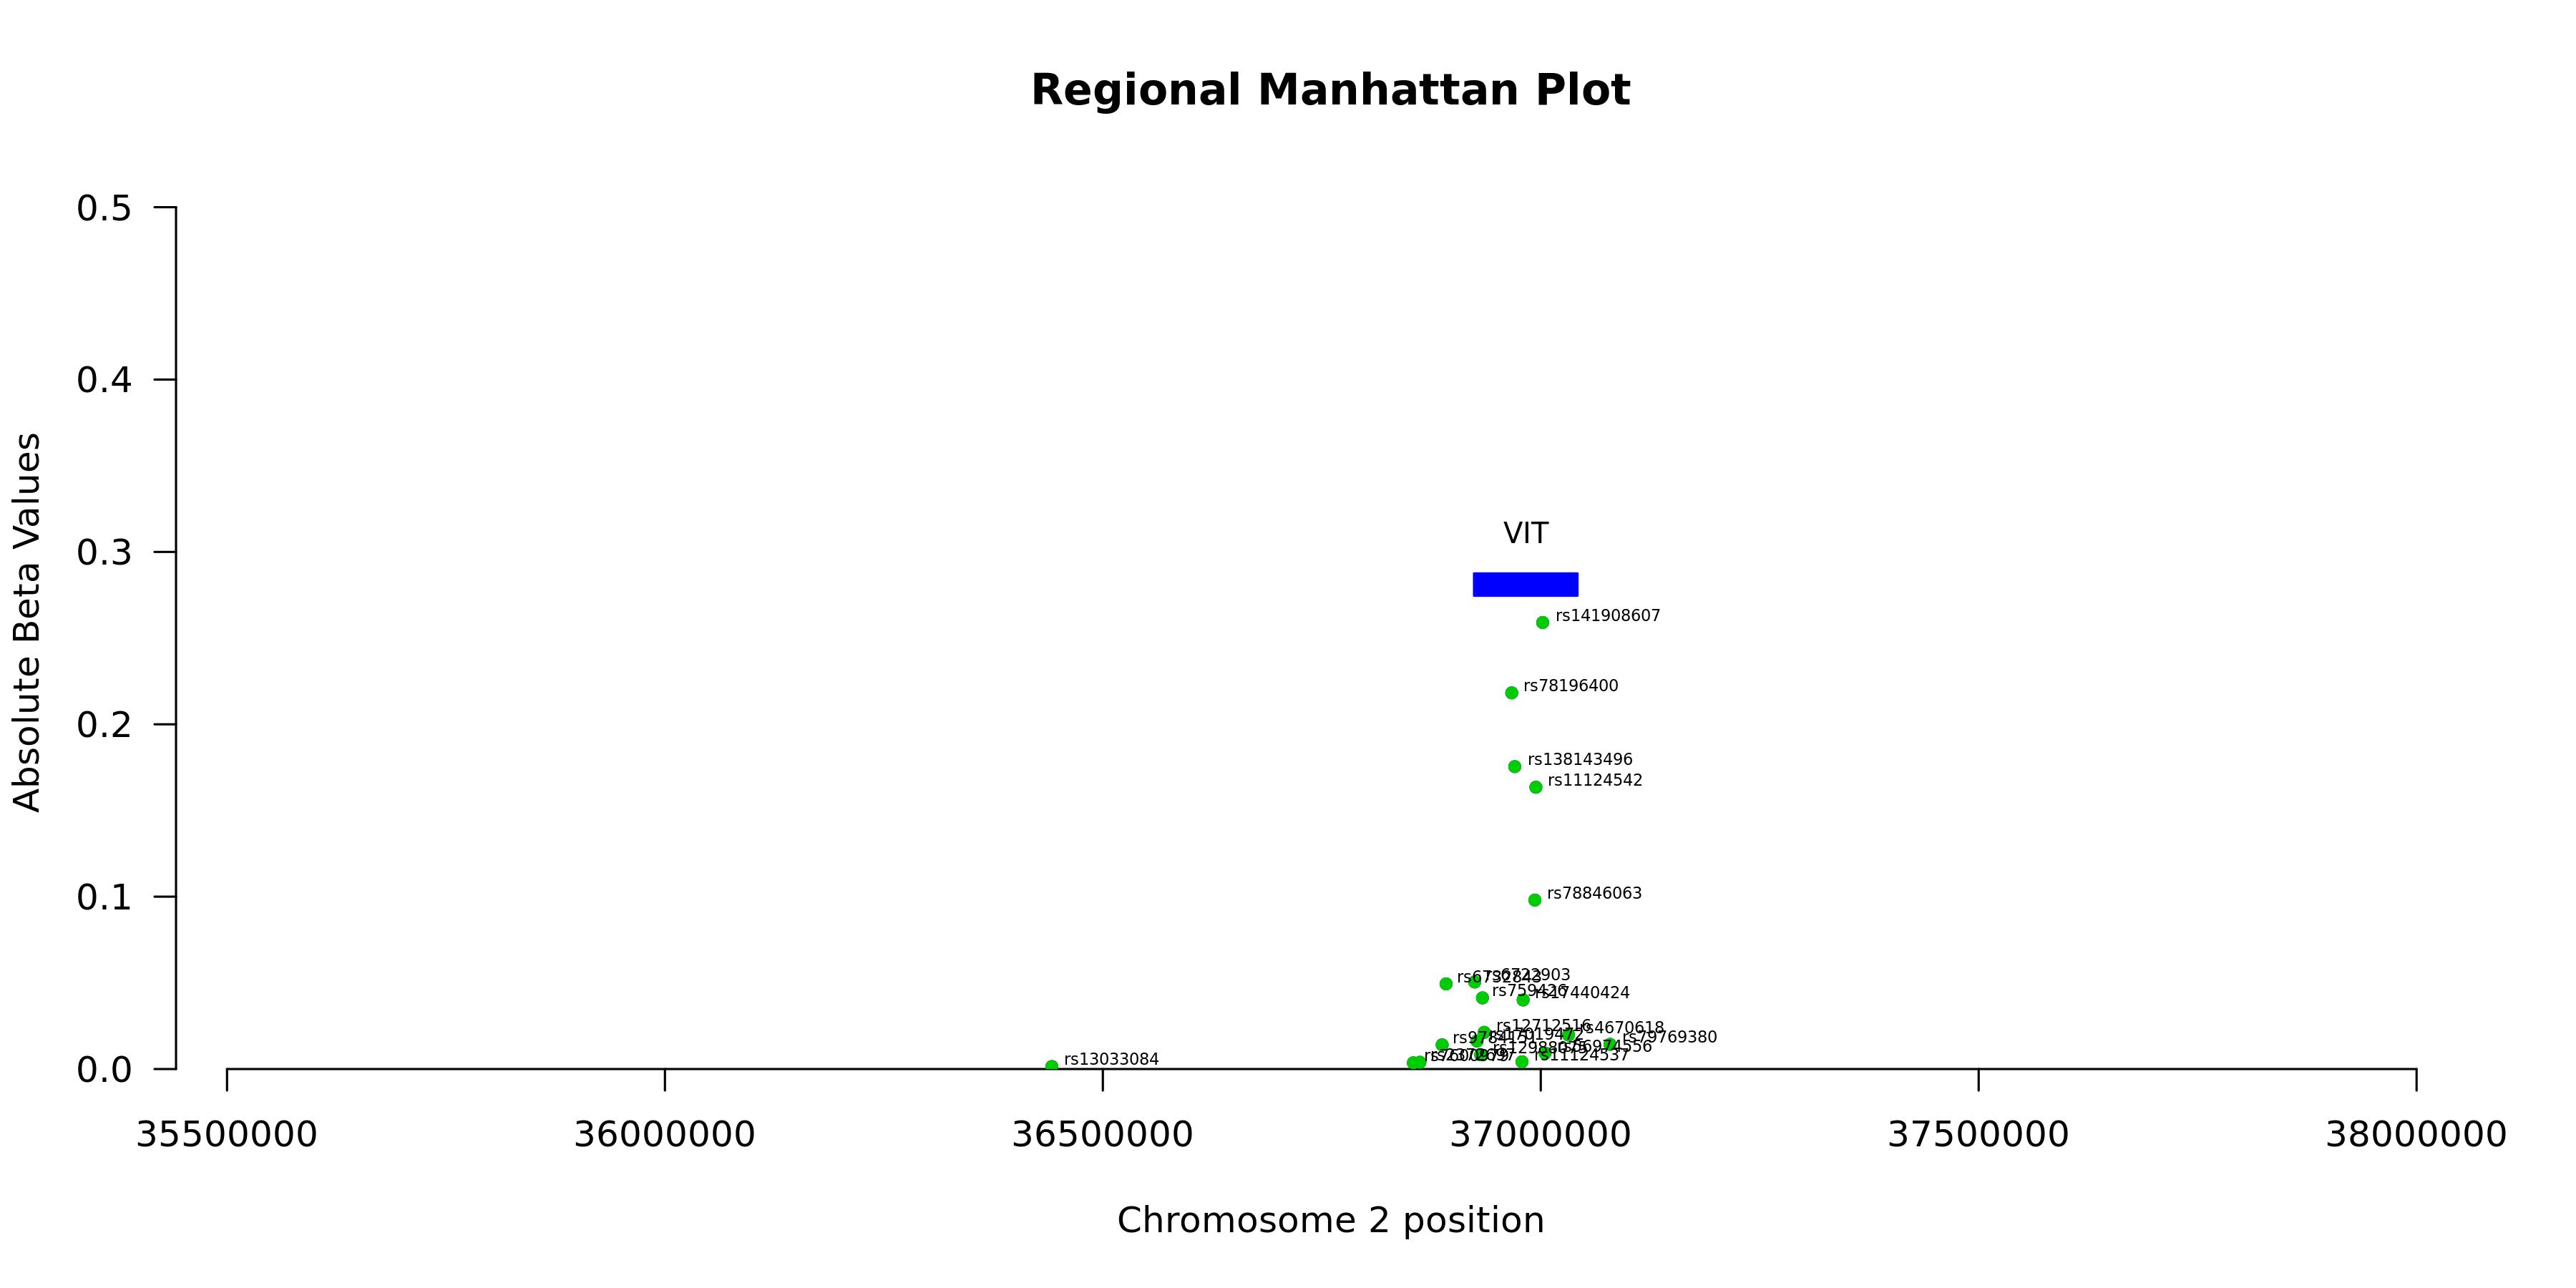
Regional Manhattan Plotenlarge ⤢
Model record
Field
Value
Gene
VIT
test_n
10538
sparsity
239
pearson_coefficent
0.427527172726427
SE
0.00971428150683614
P_corr
0
R2 Covariate Model
0.1906
R2 Full Model
0.3641
P
0
P_full
0
n_cis_pqtl
27
max_cis_pqtl
rs141908607
rank_max_cis_pqtl
1
mean_pqtl_beta
0.0460422849007463
mean_nopqtl_beta
0.00465173818268172
percentage_pqtl
0.112970711297071
percentage_nopqtl
0.887029288702929
cis and genome-wide metrics
Field
Value
Gene
VIT
test_n_genomewide
10538
sparsity_genomewide
239
pearson_coefficent_genomewide
0.427527172726427
SE_genomewide
0.00971428150683614
P_corr_genomewide
0
R2_covariate_model_genomewide
0.19060313824564
R2_full_model_genomewide
0.364064811032251
P_genomewide
0
P_full_genomewide
0
n_cis_pqtl
27
max_cis_pqtl
rs141908607
rank_max_cis_pqtl
1
mean_pqtl_beta
0.0460422849007463
mean_nopqtl_beta
0.00465173818268172
percentage_pqtl
0.112970711297071
percentage_nopqtl
0.887029288702929
test_n_cis
10538
sparsity_cis
27
pearson_coefficent_cis
0.380784279873994
SE_cis
0.00993630600014432
P_corr_cis
5.92652407236052e-297
R2_covariate_model_cis
0.19060313824564
R2_full_model_cis
0.329131516315801
P_cis
0
P_full_cis
0