TIMM10
Olink Explore plasma protein · SNPBoost PRS model
R2 Full Model
0.0431
pearson_coefficent
0.2028
sparsity
174
n_cis_pqtl
10
max_cis_pqtl
rs2649650
Diagnostics
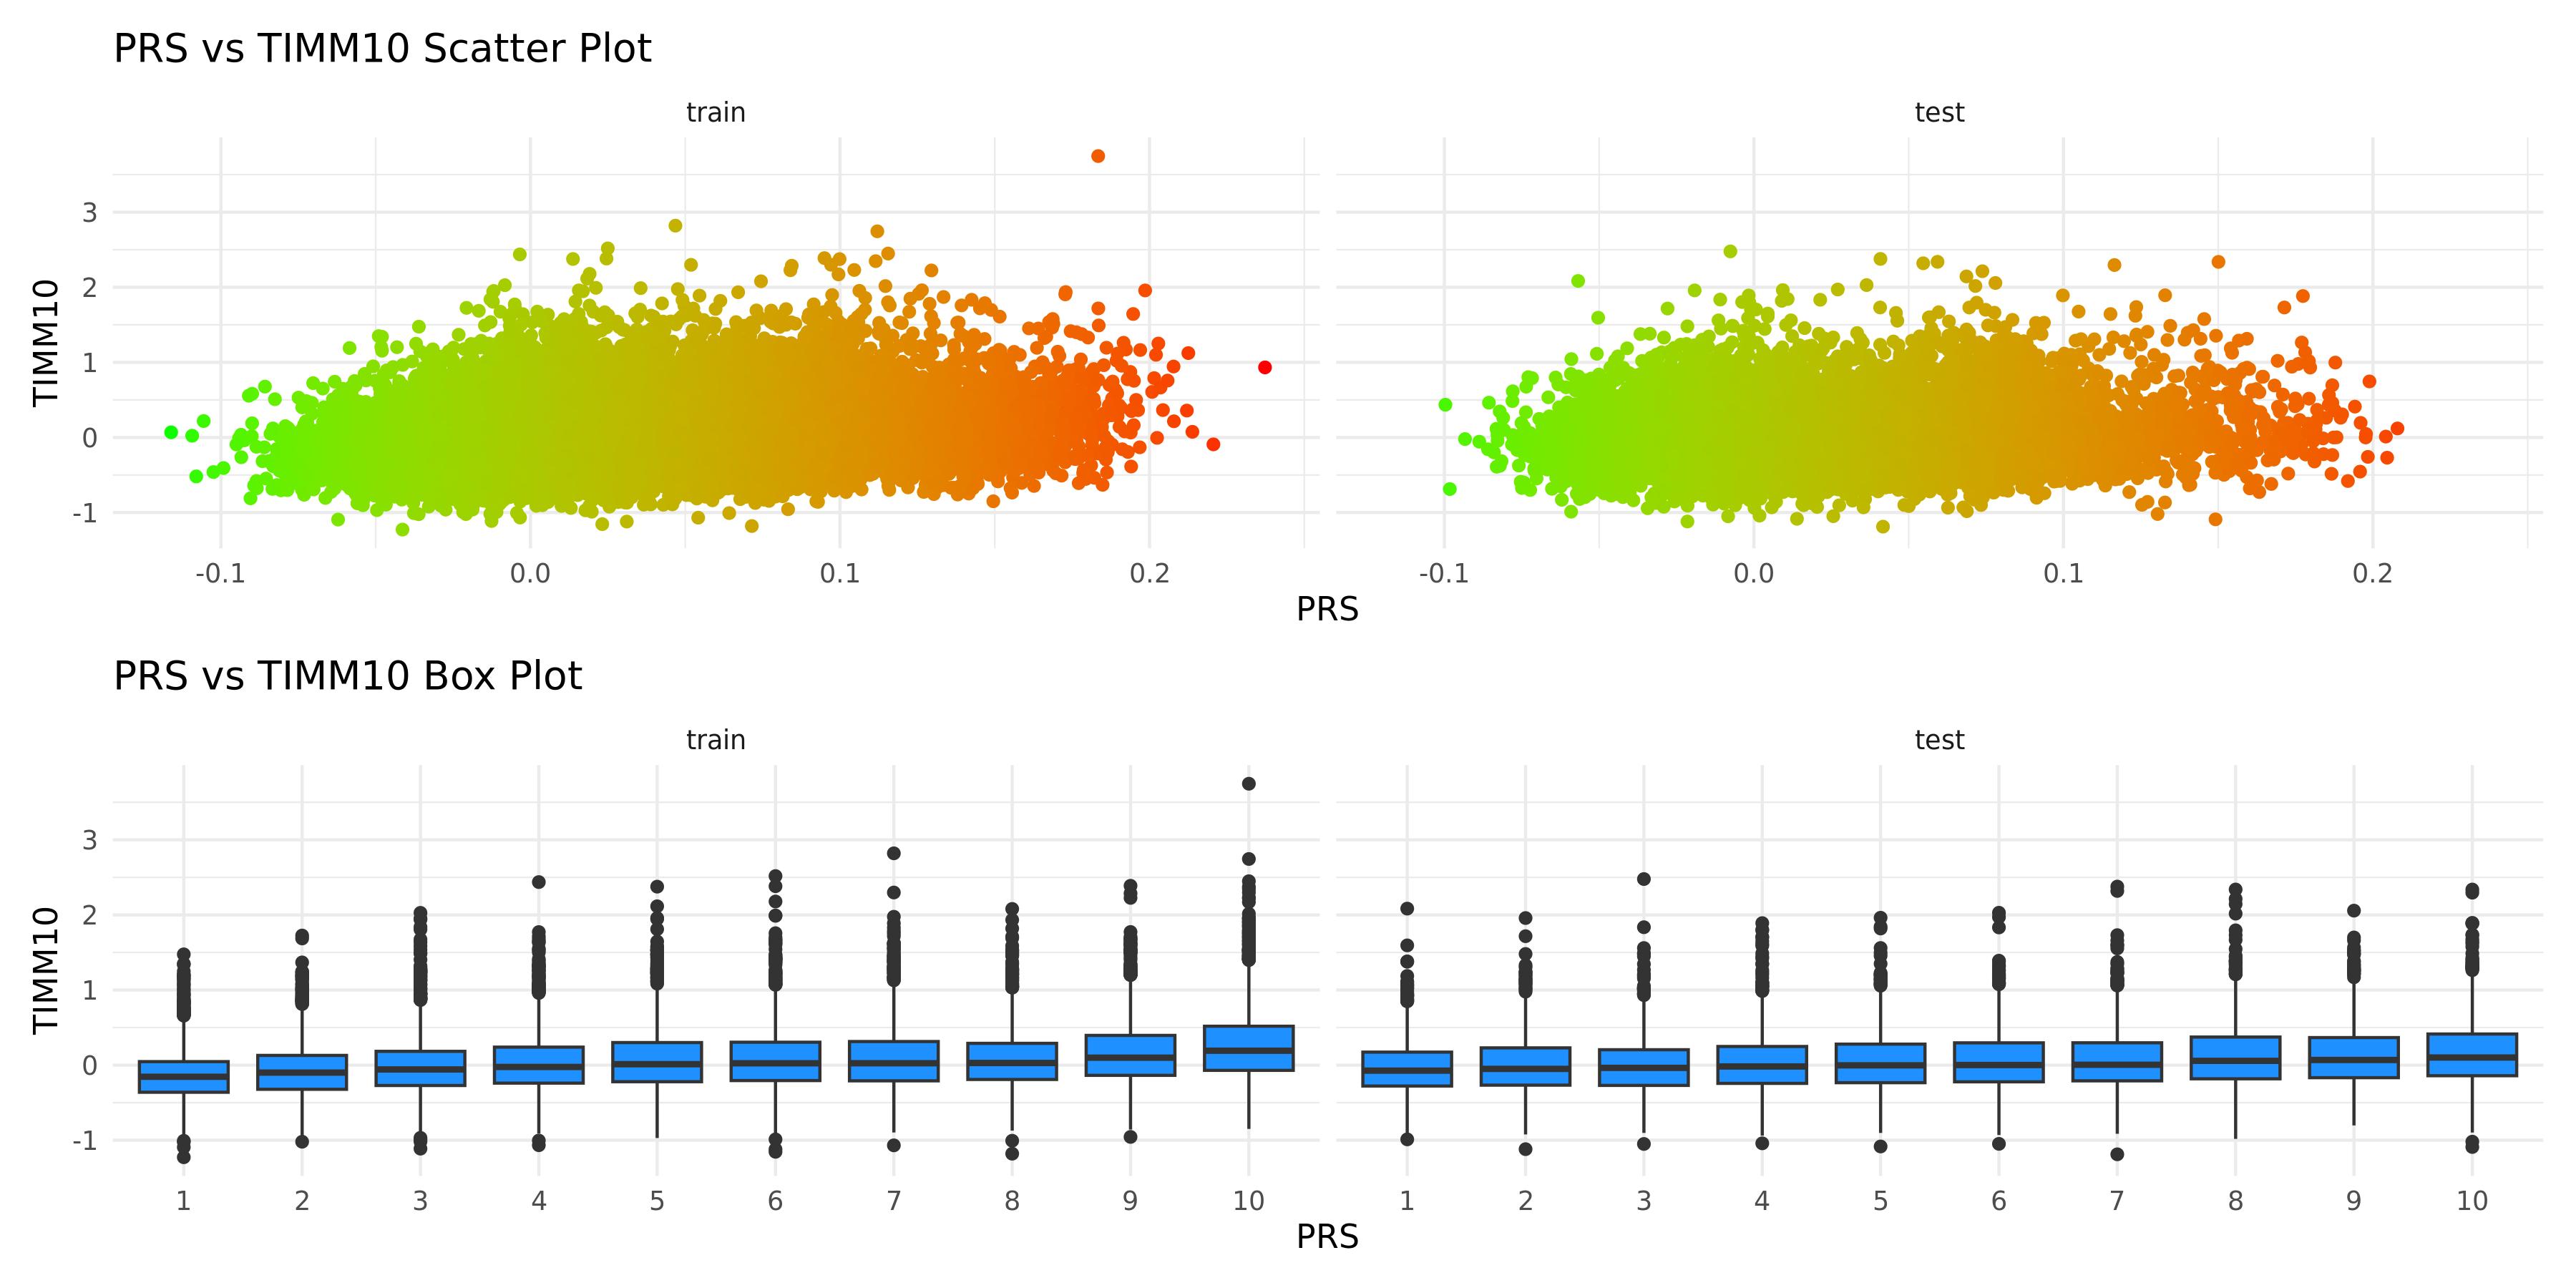
PRS scatter and box plotsenlarge ⤢
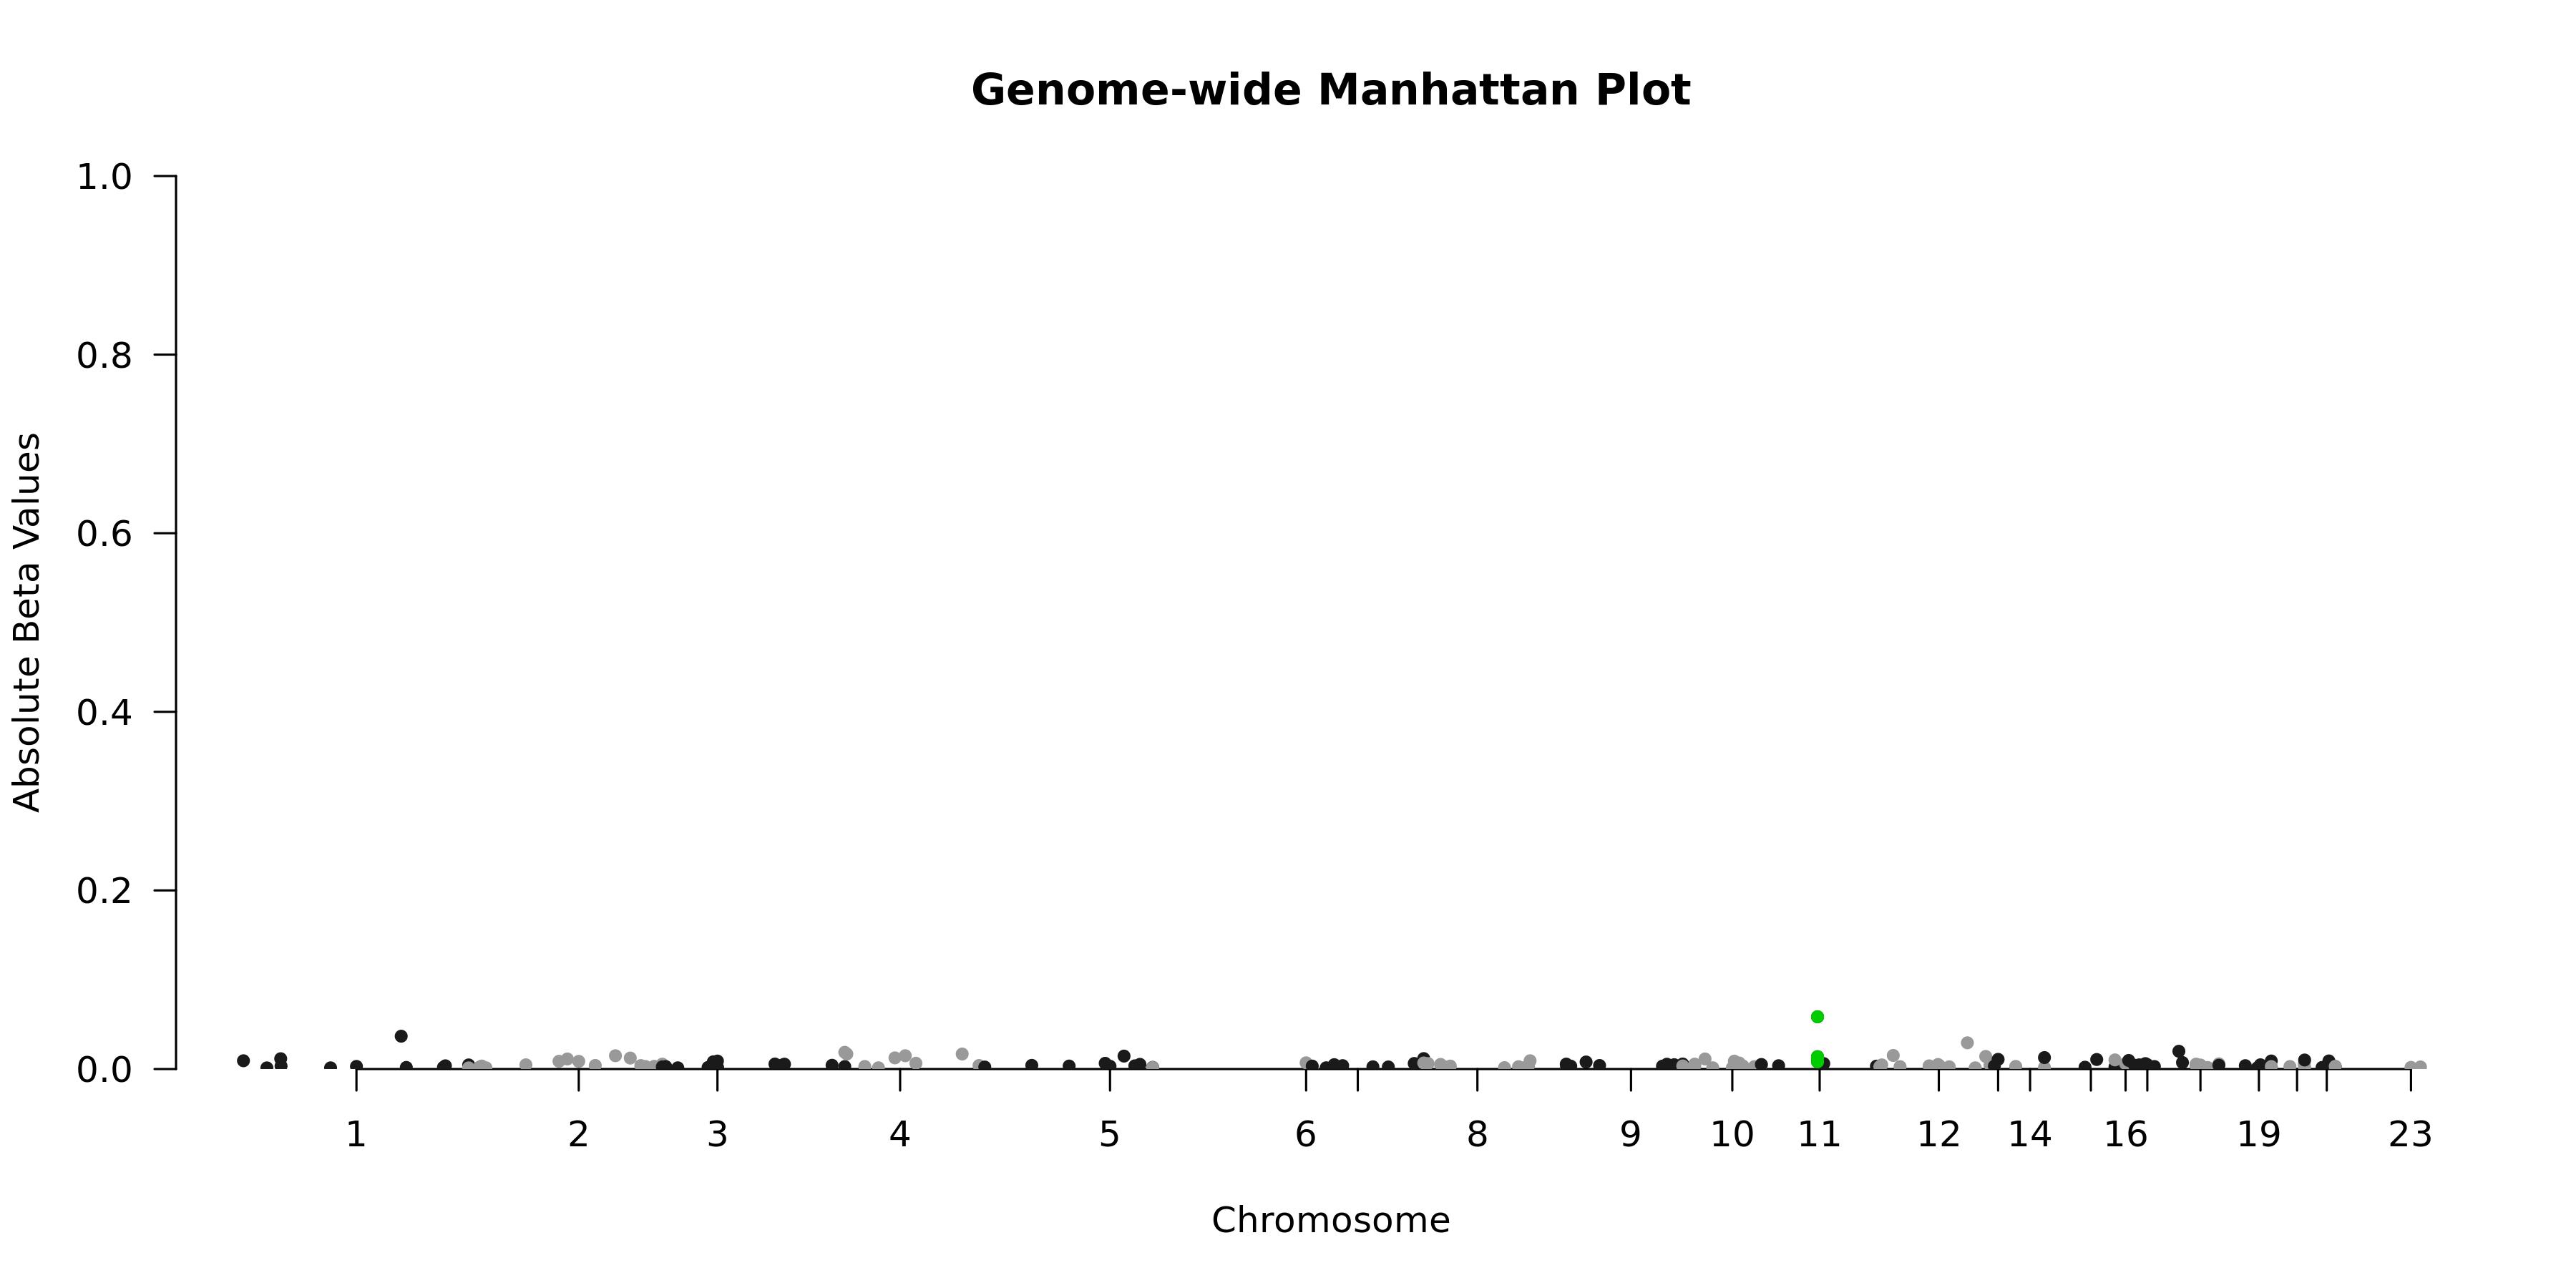
Genome-wide Manhattan Plotenlarge ⤢
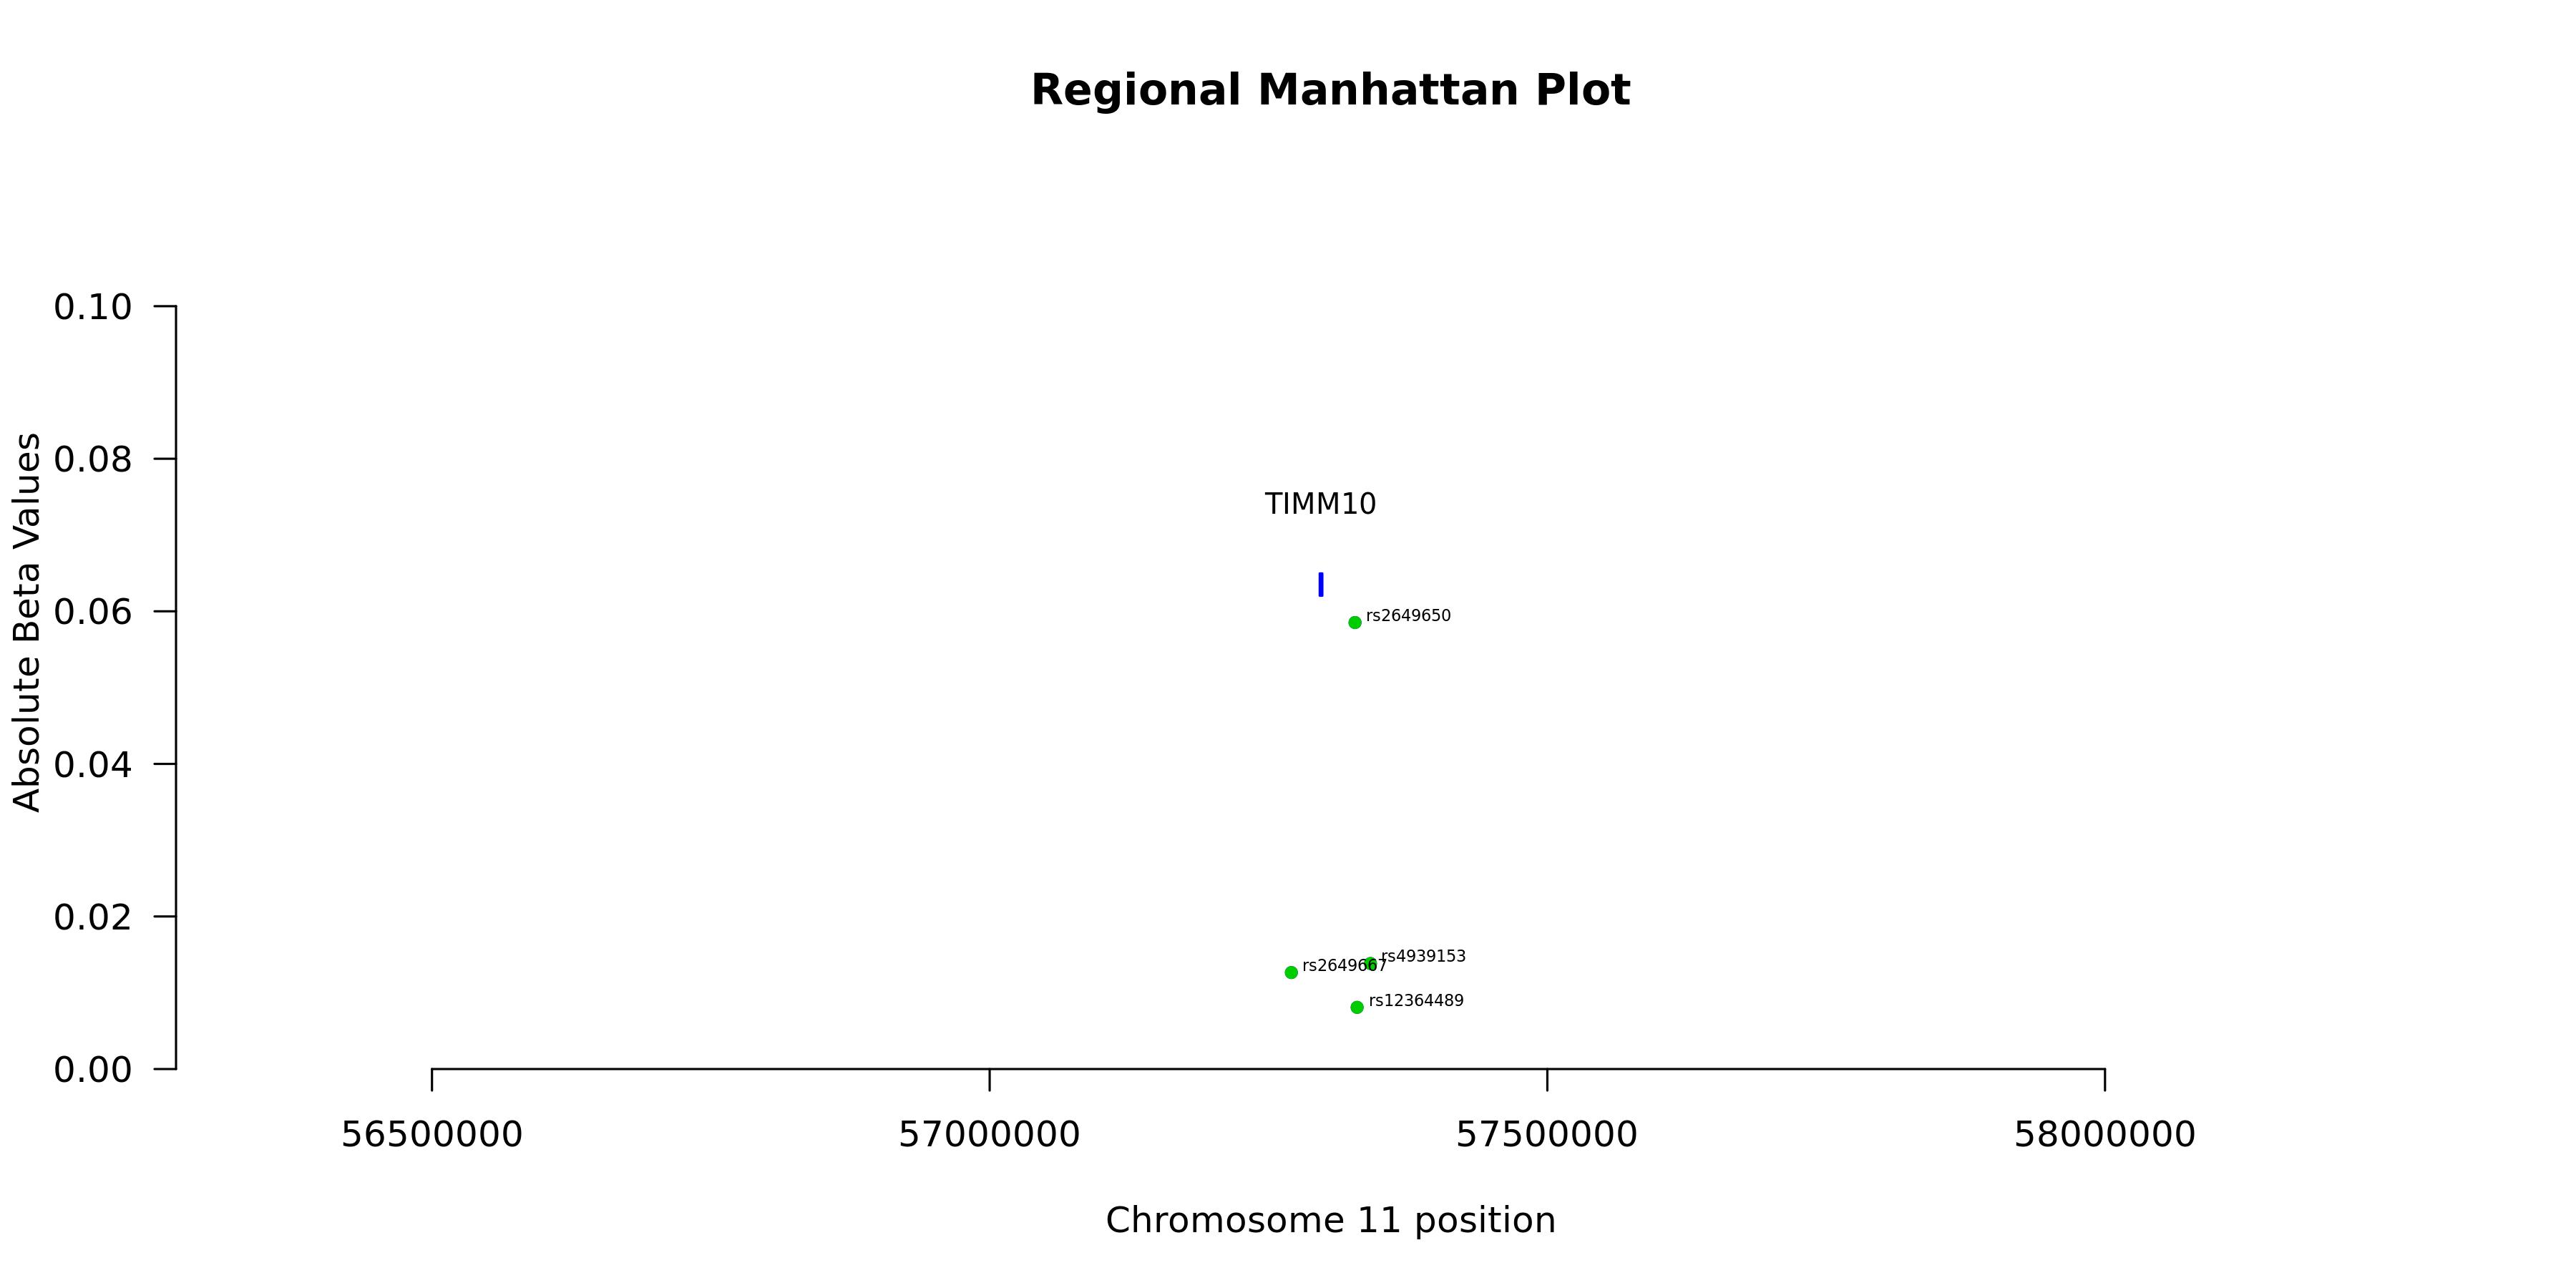
Regional Manhattan Plotenlarge ⤢
Model record
Field
Value
Gene
TIMM10
test_n
10538
sparsity
174
pearson_coefficent
0.202821392428206
SE
0.0105225123382764
P_corr
4.28300319461235e-81
R2 Covariate Model
0.0024
R2 Full Model
0.0431
P
3.11003486211662e-85
P_full
6.08161592368172e-247
n_cis_pqtl
10
max_cis_pqtl
rs2649650
rank_max_cis_pqtl
1
mean_pqtl_beta
0.0110808697542125
mean_nopqtl_beta
0.00542621423786939
percentage_pqtl
0.0574712643678161
percentage_nopqtl
0.942528735632184
cis and genome-wide metrics
Field
Value
Gene
TIMM10
test_n_genomewide
10538
sparsity_genomewide
174
pearson_coefficent_genomewide
0.202821392428206
SE_genomewide
0.0105225123382764
P_corr_genomewide
4.28300319461235e-81
R2_covariate_model_genomewide
0.00240653321736695
R2_full_model_genomewide
0.0431404550446433
P_genomewide
3.11003486211662e-85
P_full_genomewide
6.08161592368172e-247
n_cis_pqtl
10
max_cis_pqtl
rs2649650
rank_max_cis_pqtl
1
mean_pqtl_beta
0.0110808697542125
mean_nopqtl_beta
0.00542621423786939
percentage_pqtl
0.0574712643678161
percentage_nopqtl
0.942528735632184
test_n_cis
10538
sparsity_cis
10
pearson_coefficent_cis
0.134731187676459
SE_cis
0.0106478782057698
P_corr_cis
2.2476594373399e-36
R2_covariate_model_cis
0.00240653321736695
R2_full_model_cis
0.0201249511949534
P_cis
2.69224533027747e-40
P_full_cis
6.32030793837836e-102