TGOLN2
Olink Explore plasma protein · SNPBoost PRS model
R2 Full Model
0.3182
pearson_coefficent
0.5272
sparsity
291
n_cis_pqtl
16
max_cis_pqtl
rs4247303
Diagnostics
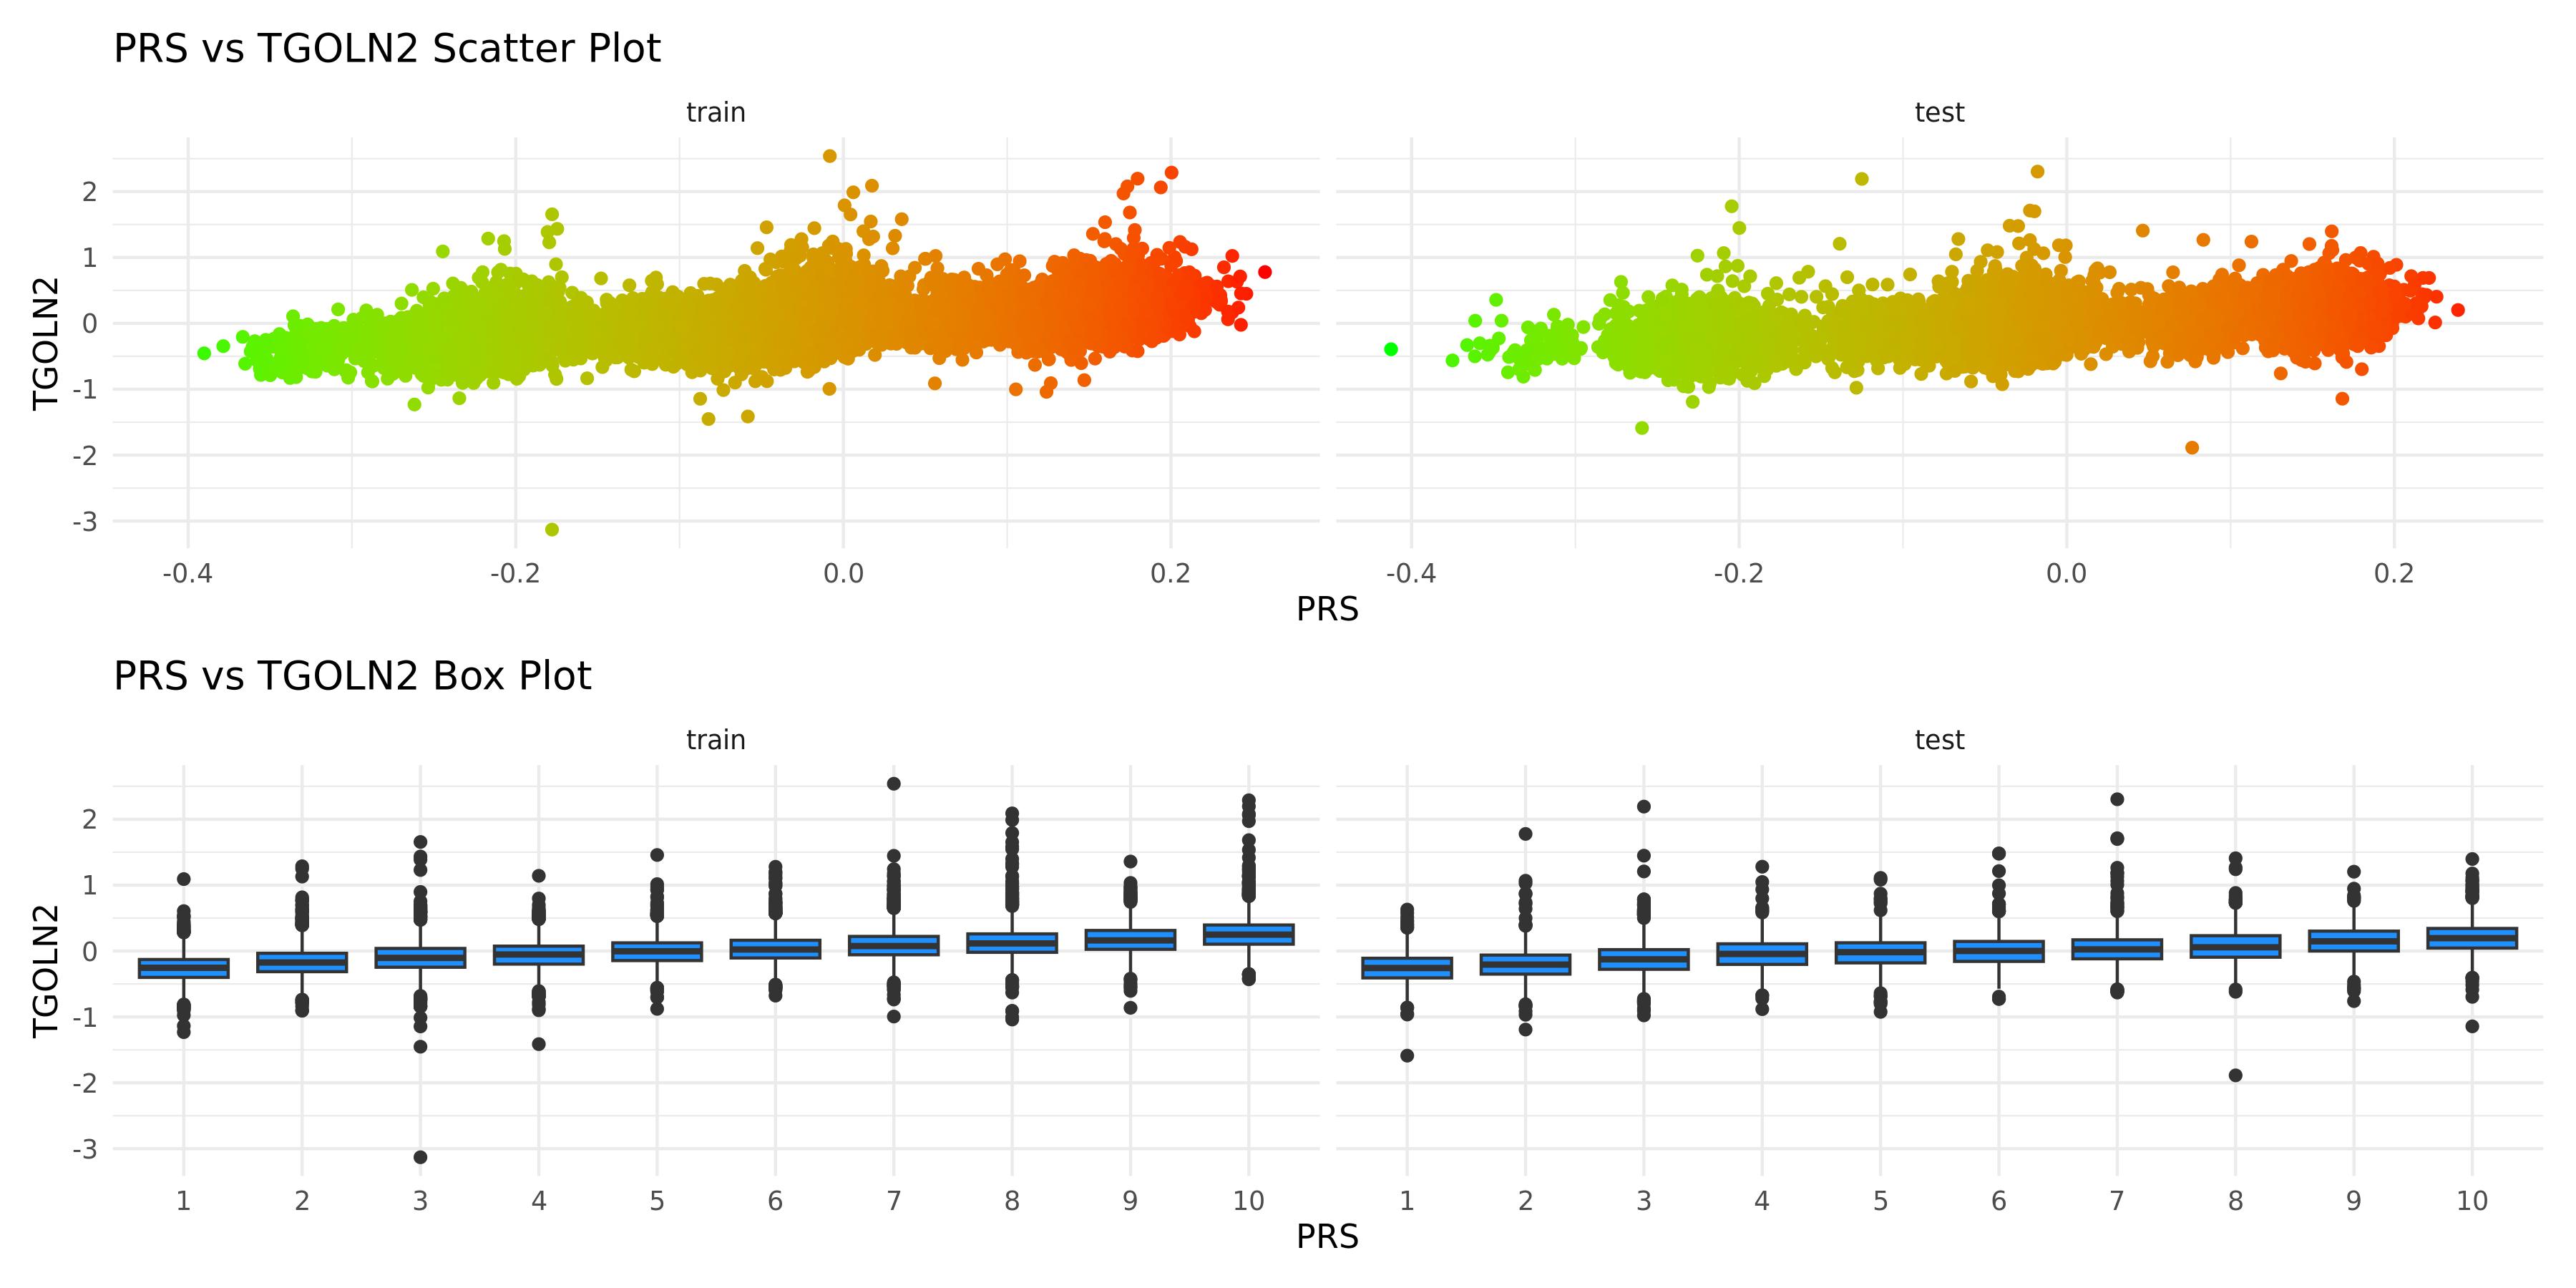
PRS scatter and box plotsenlarge ⤢
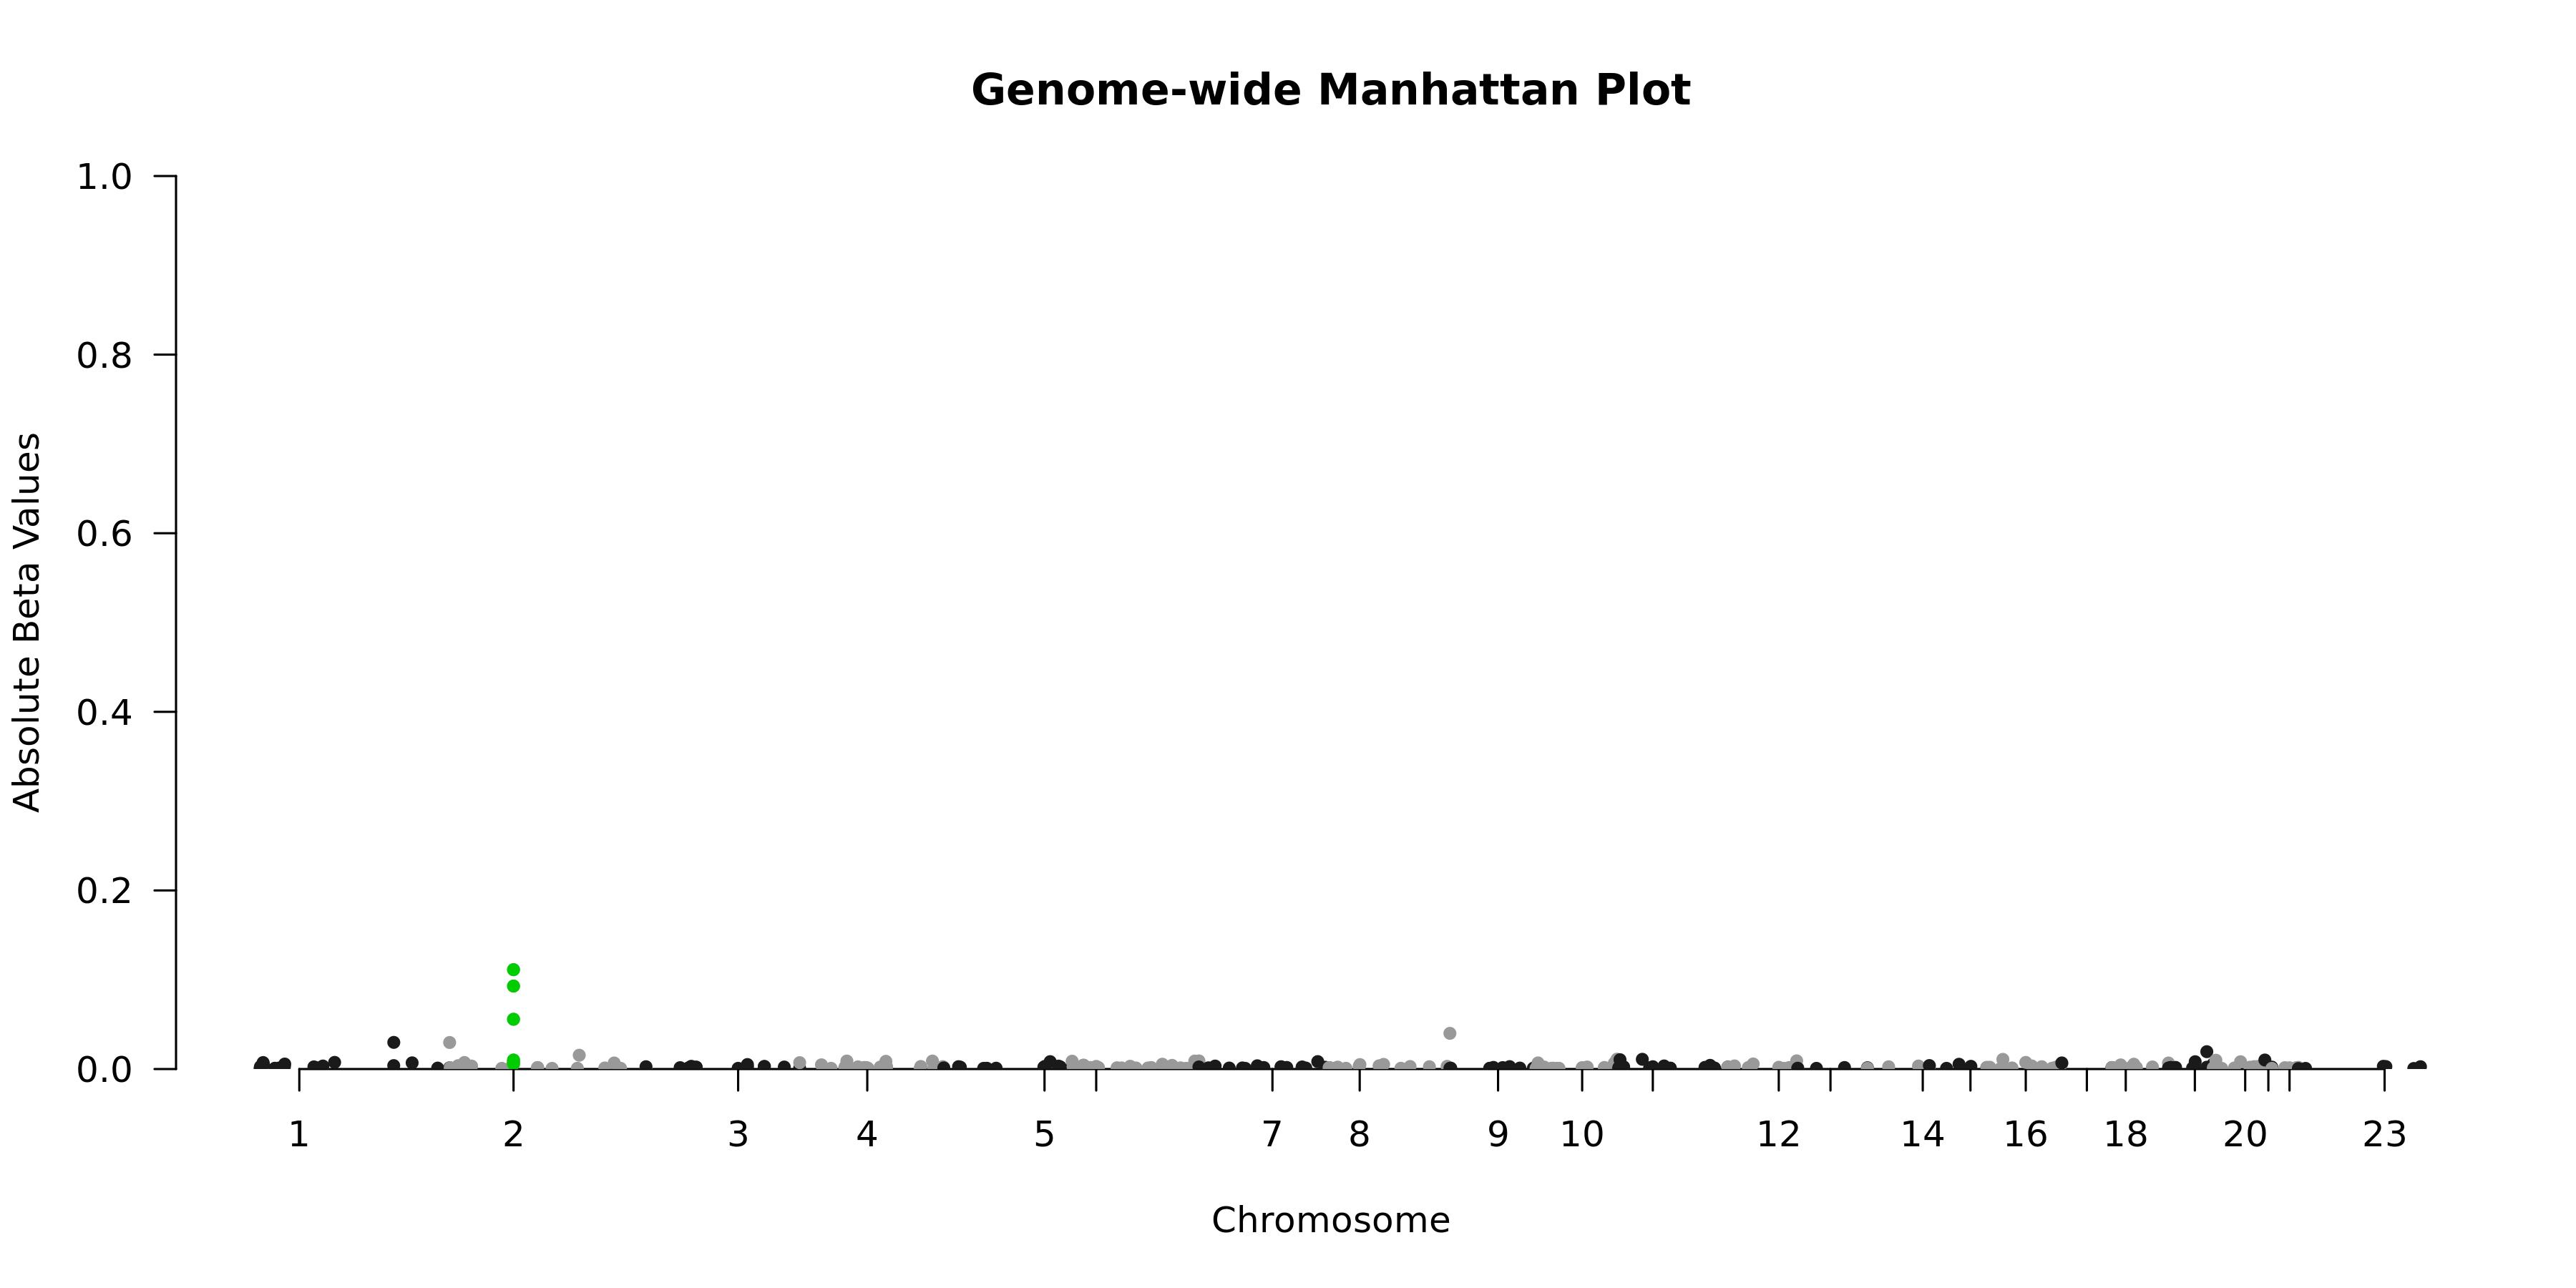
Genome-wide Manhattan Plotenlarge ⤢
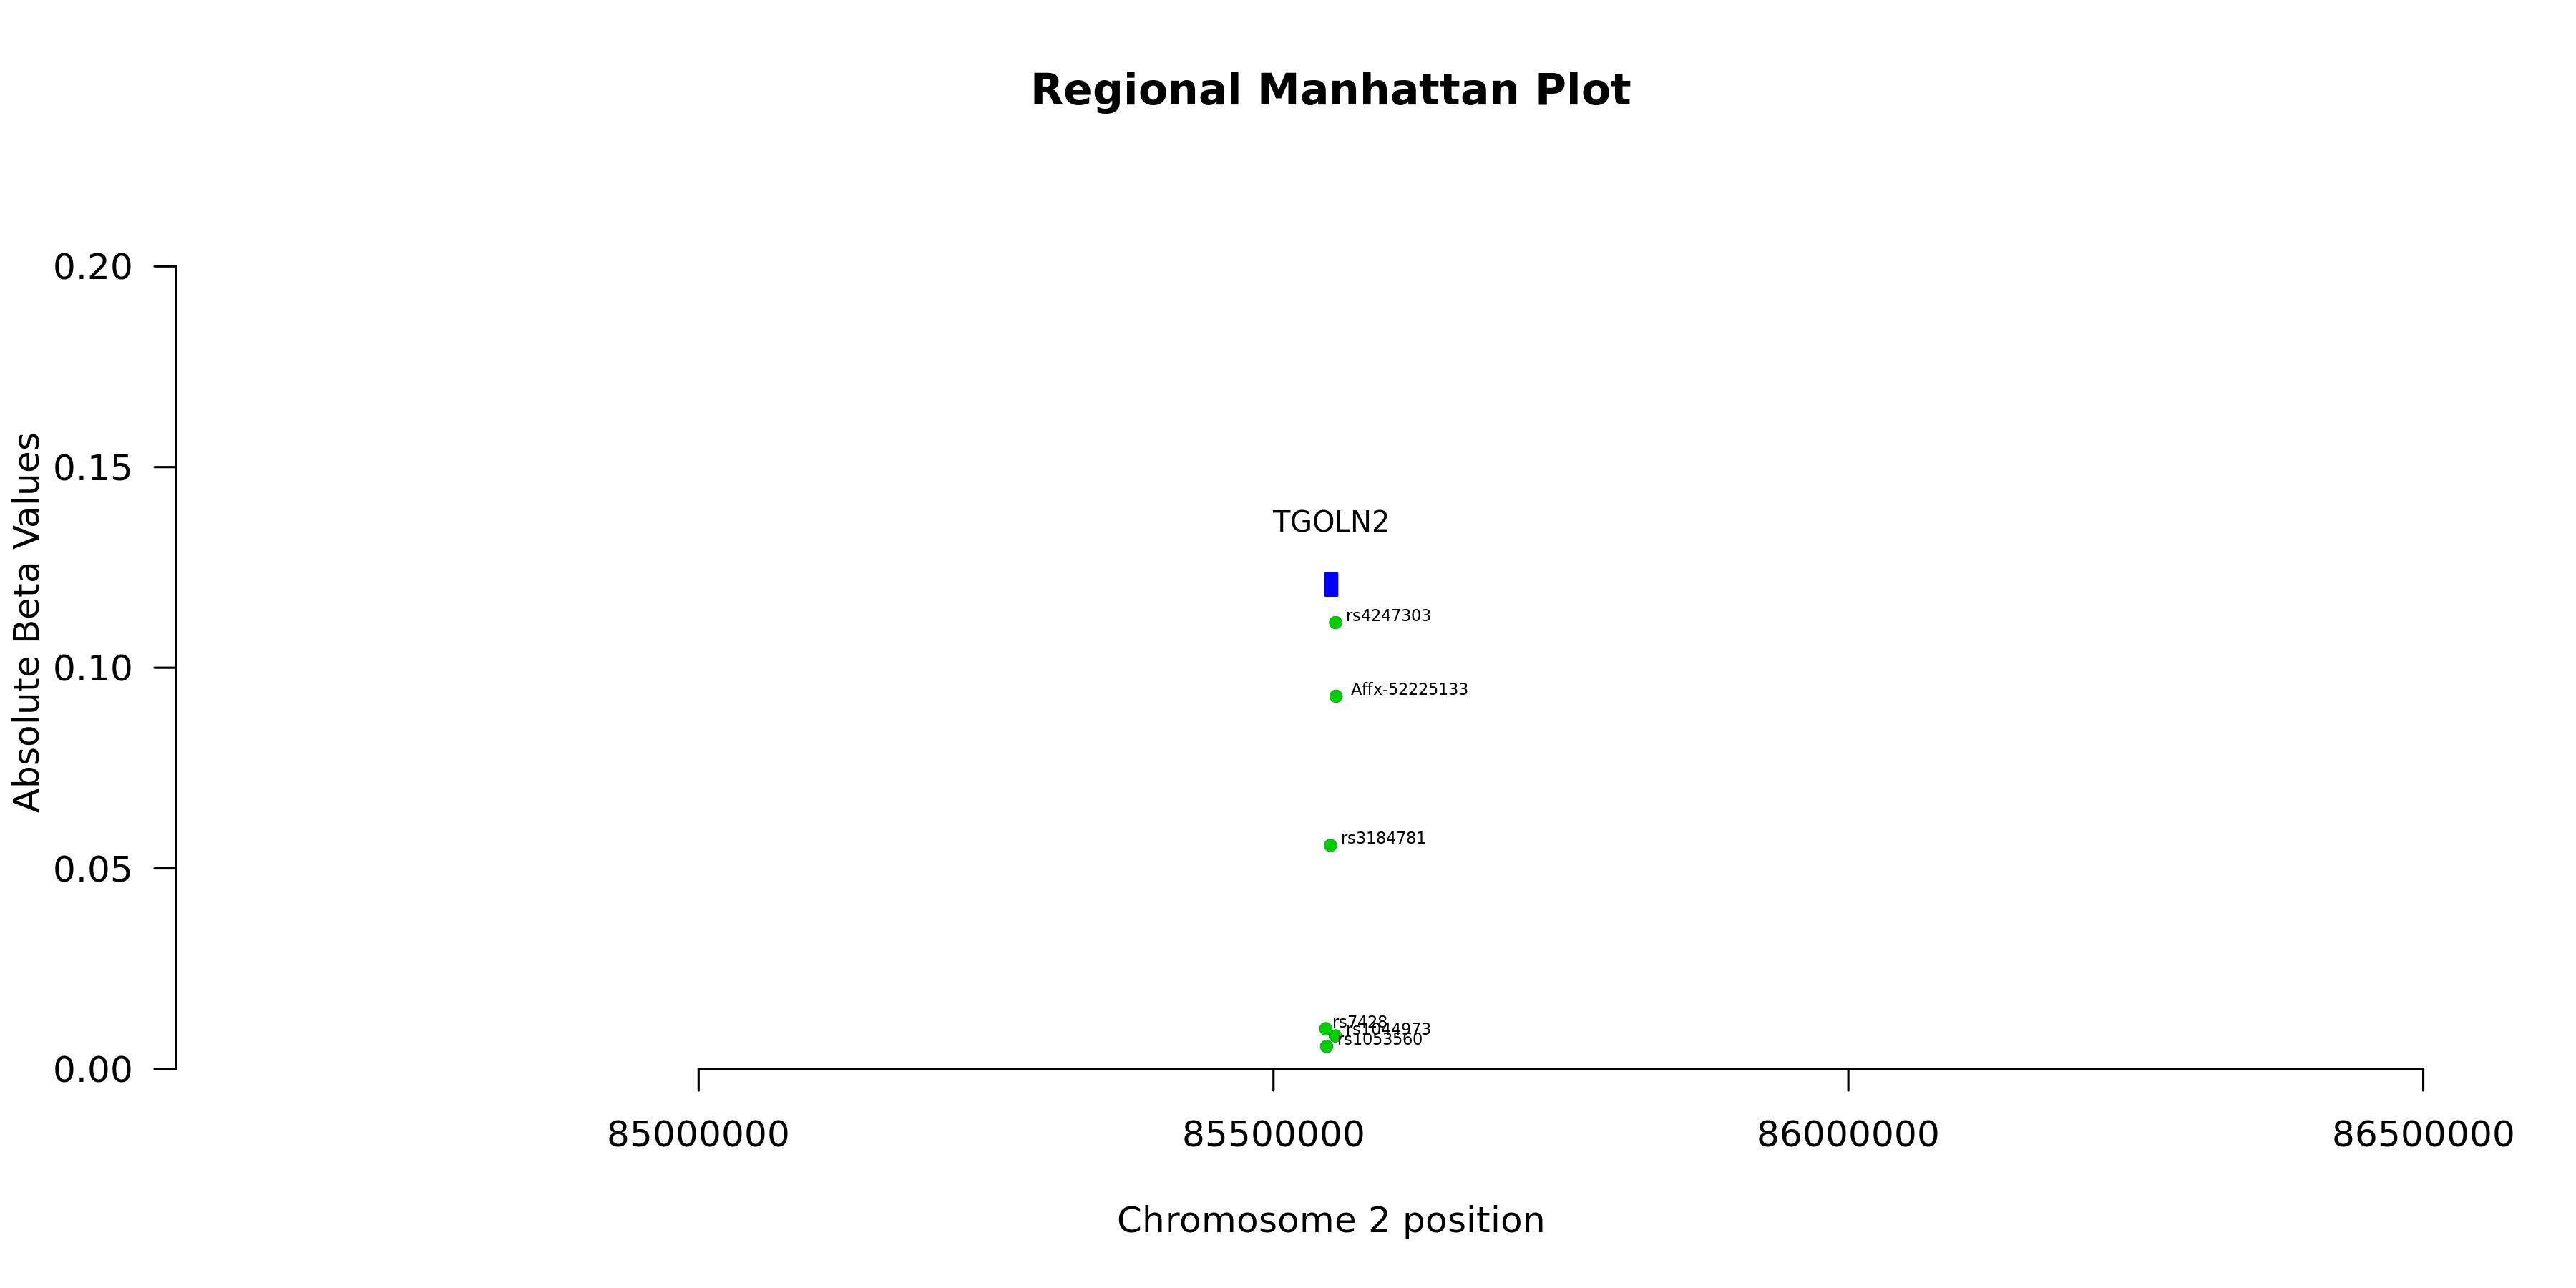
Regional Manhattan Plotenlarge ⤢
Model record
Field
Value
Gene
TGOLN2
test_n
10538
sparsity
291
pearson_coefficent
0.527223061247614
SE
0.00912051823963567
P_corr
0
R2 Covariate Model
0.0432
R2 Full Model
0.3182
P
0
P_full
0
n_cis_pqtl
16
max_cis_pqtl
rs4247303
rank_max_cis_pqtl
1
mean_pqtl_beta
0.0196662418464387
mean_nopqtl_beta
0.00308070891999987
percentage_pqtl
0.0549828178694158
percentage_nopqtl
0.945017182130584
cis and genome-wide metrics
Field
Value
Gene
TGOLN2
test_n_genomewide
10538
sparsity_genomewide
291
pearson_coefficent_genomewide
0.527223061247614
SE_genomewide
0.00912051823963567
P_corr_genomewide
0
R2_covariate_model_genomewide
0.0432127610445793
R2_full_model_genomewide
0.318219800780571
P_genomewide
0
P_full_genomewide
0
n_cis_pqtl
16
max_cis_pqtl
rs4247303
rank_max_cis_pqtl
1
mean_pqtl_beta
0.0196662418464387
mean_nopqtl_beta
0.00308070891999987
percentage_pqtl
0.0549828178694158
percentage_nopqtl
0.945017182130584
test_n_cis
10538
sparsity_cis
16
pearson_coefficent_cis
0.499937373191607
SE_cis
0.00929584555444805
P_corr_cis
0
R2_covariate_model_cis
0.0432127610445793
R2_full_model_cis
0.291651329356671
P_cis
0
P_full_cis
0