TFPI
Olink Explore plasma protein · SNPBoost PRS model
R2 Full Model
0.161
pearson_coefficent
0.3525
sparsity
491
n_cis_pqtl
23
max_cis_pqtl
rs7586970
Diagnostics
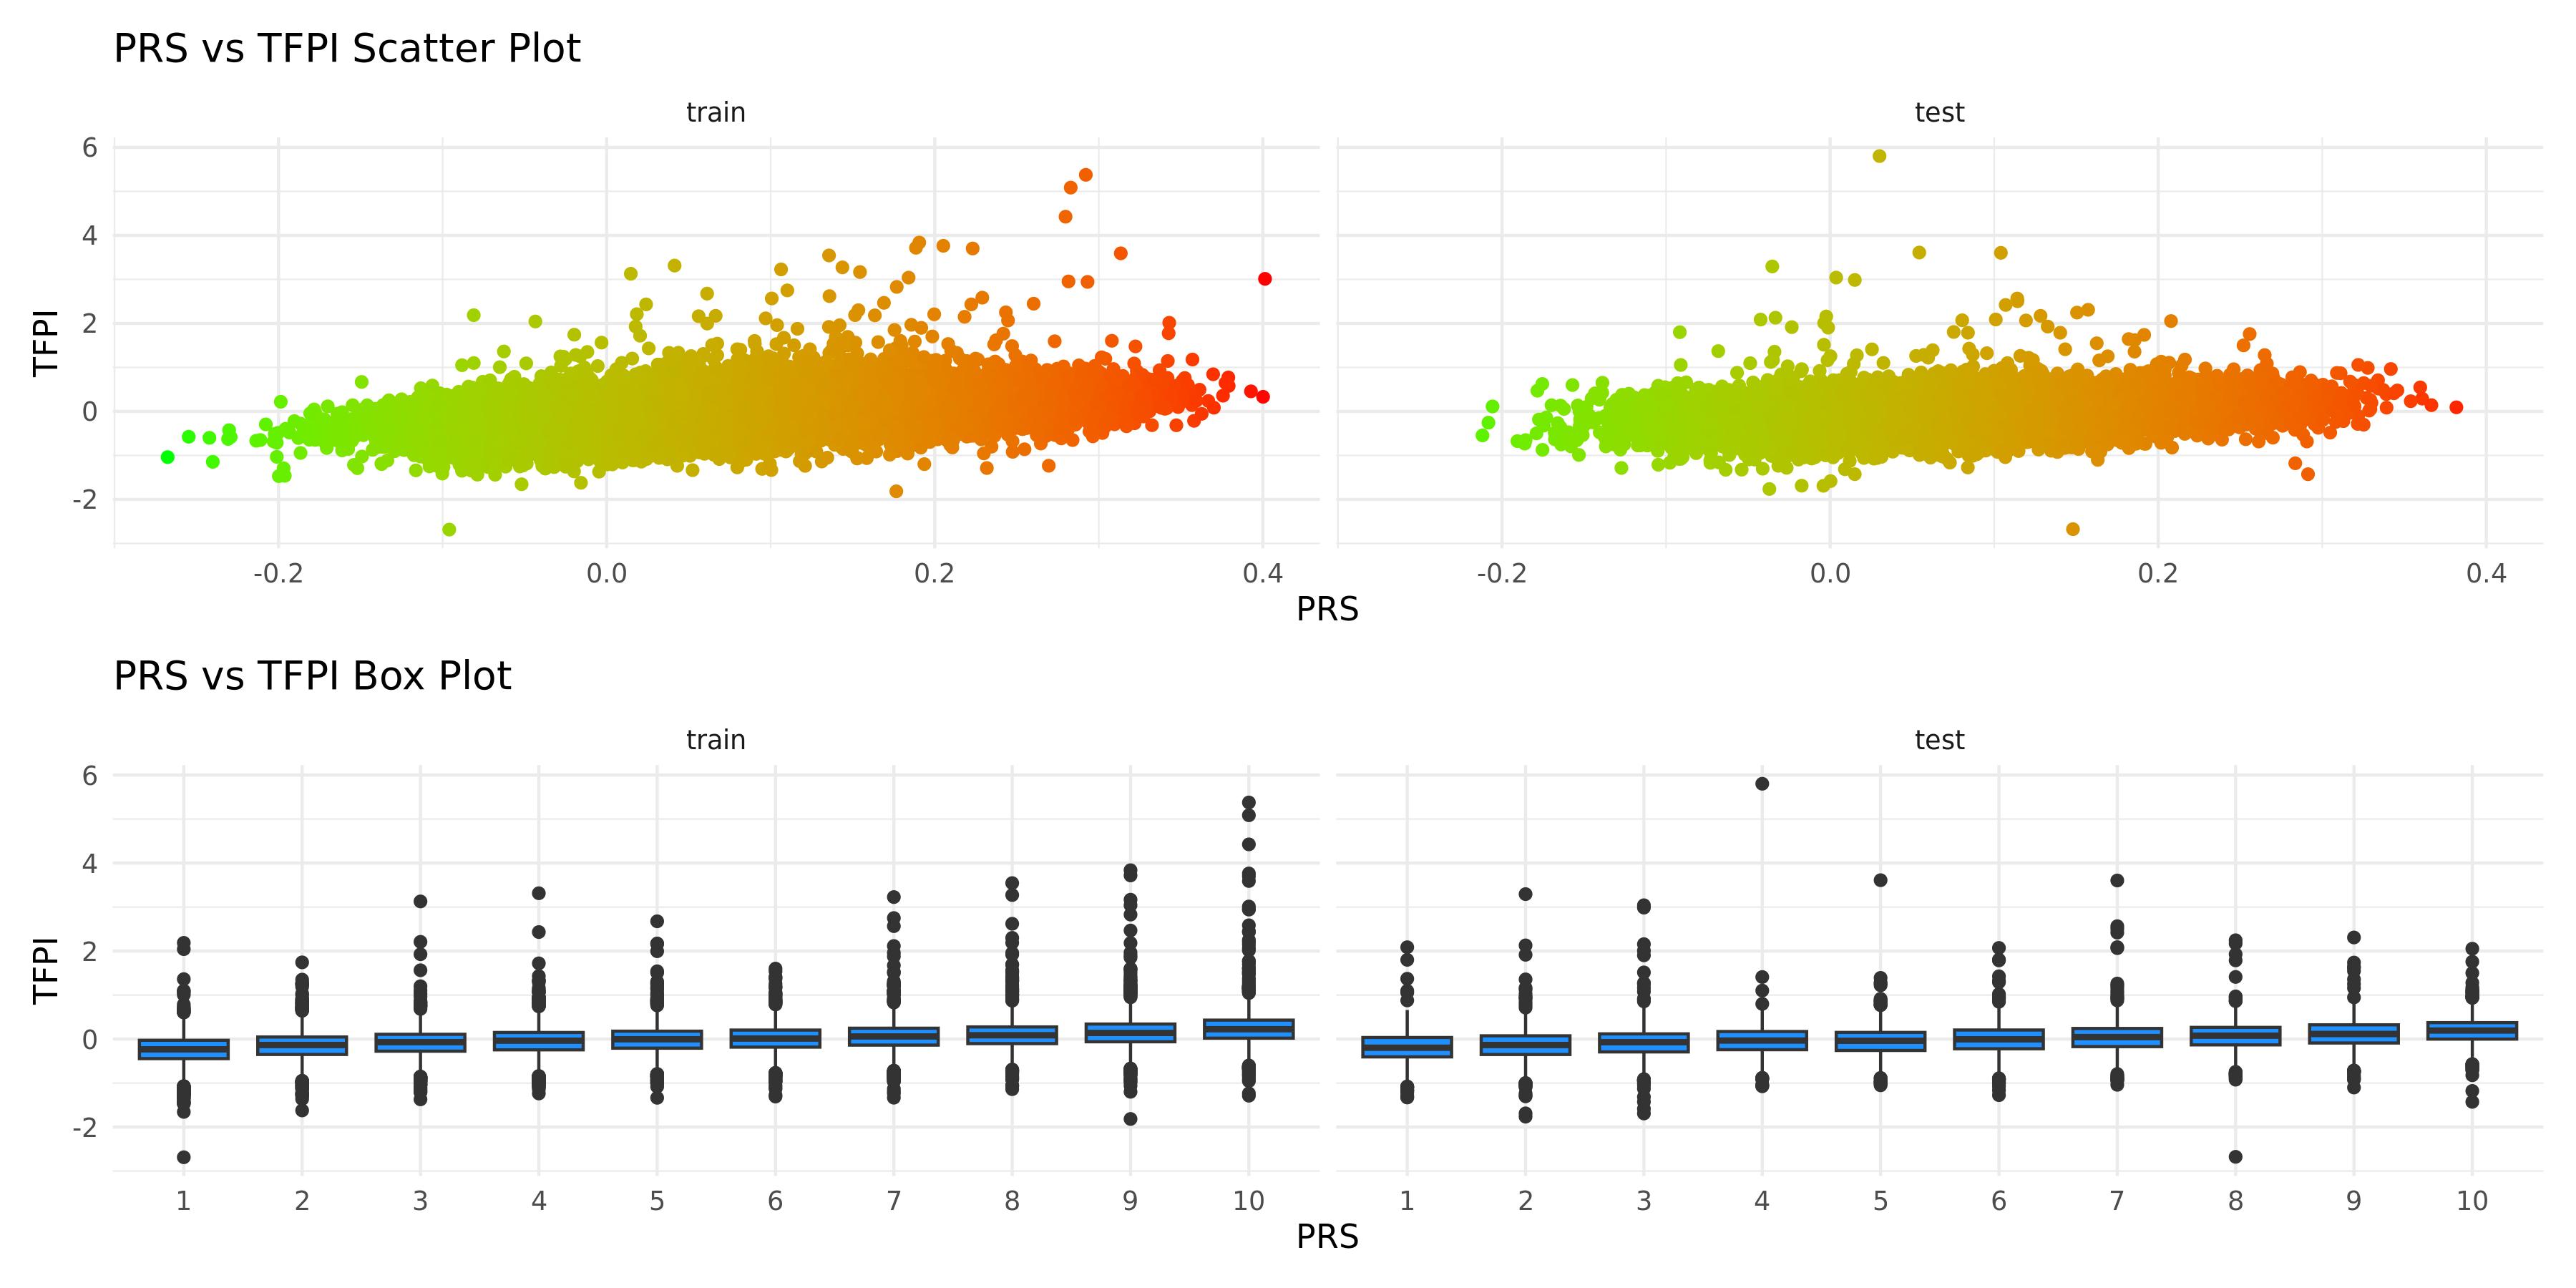
PRS scatter and box plotsenlarge ⤢
Genome-wide Manhattan Plotenlarge ⤢

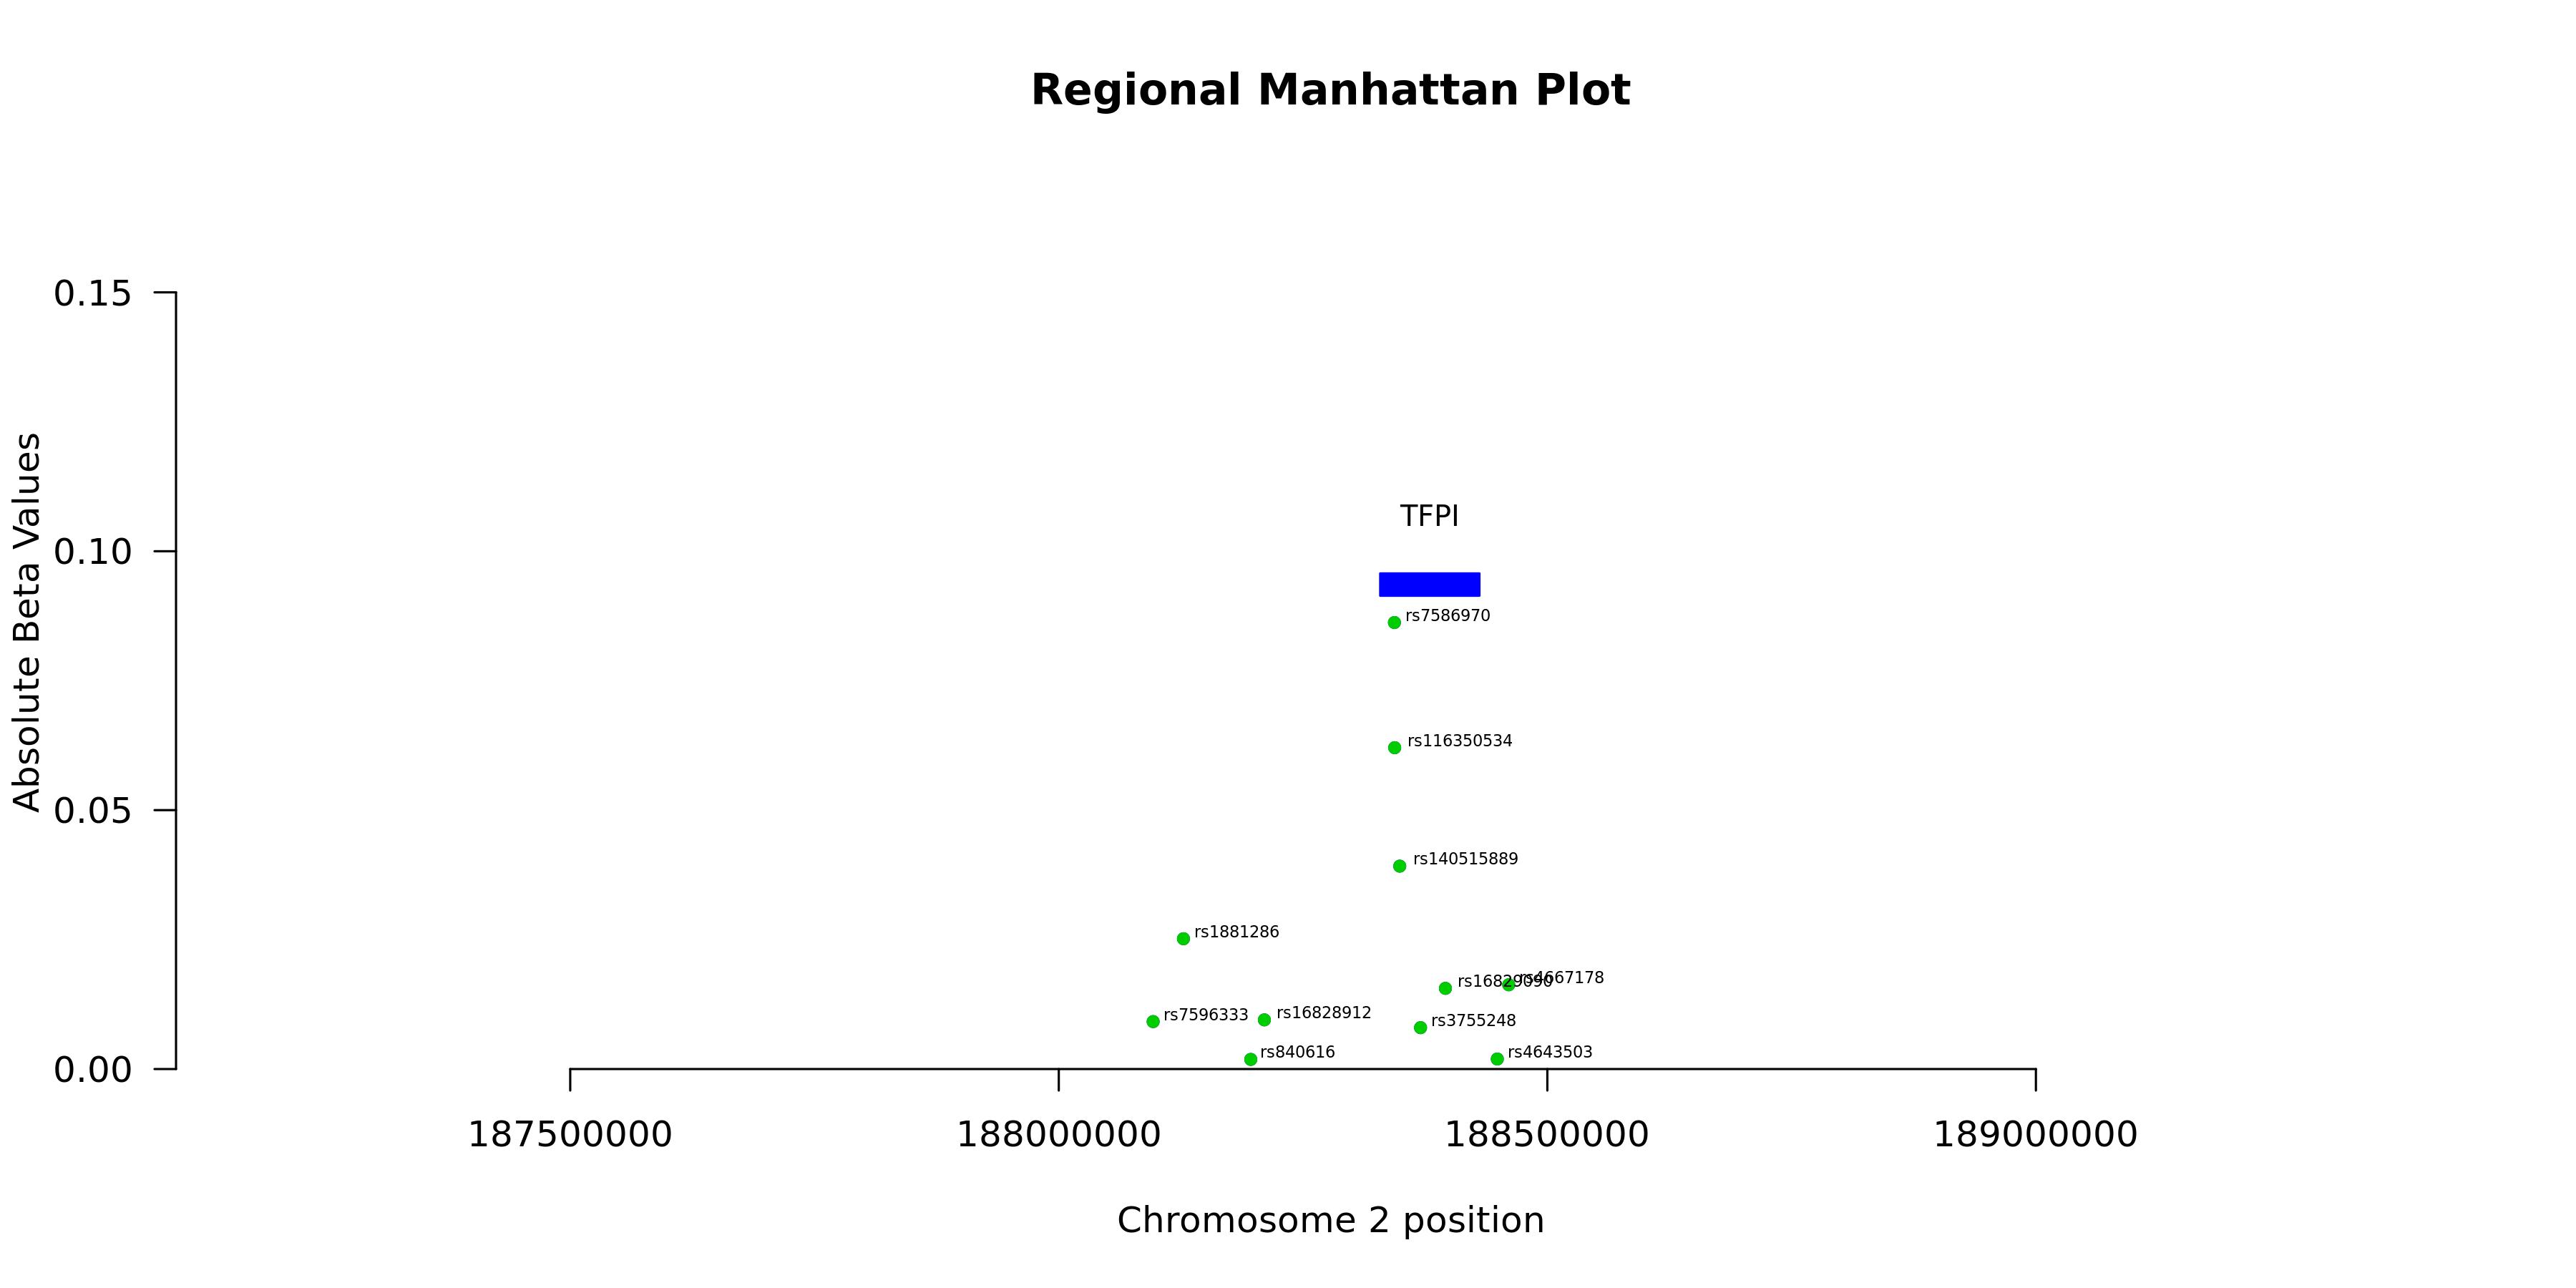
Regional Manhattan Plotenlarge ⤢
Model record
Field
Value
Gene
TFPI
test_n
10538
sparsity
491
pearson_coefficent
0.352481226663848
SE
0.00925013096119046
P_corr
3.14466500308471e-297
R2 Covariate Model
0.0426
R2 Full Model
0.161
P
0
P_full
0
n_cis_pqtl
23
max_cis_pqtl
rs7586970
rank_max_cis_pqtl
1
mean_pqtl_beta
0.0133342735821852
mean_nopqtl_beta
0.00418200228287387
percentage_pqtl
0.0468431771894094
percentage_nopqtl
0.953156822810591
cis and genome-wide metrics
Field
Value
Gene
TFPI
test_n_genomewide
10538
sparsity_genomewide
491
pearson_coefficent_genomewide
0.352481226663848
SE_genomewide
0.00925013096119046
P_corr_genomewide
3.14466500308471e-297
R2_covariate_model_genomewide
0.042564868038826
R2_full_model_genomewide
0.161045711039595
P_genomewide
0
P_full_genomewide
0
n_cis_pqtl
23
max_cis_pqtl
rs7586970
rank_max_cis_pqtl
1
mean_pqtl_beta
0.0133342735821852
mean_nopqtl_beta
0.00418200228287387
percentage_pqtl
0.0468431771894094
percentage_nopqtl
0.953156822810591
test_n_cis
10538
sparsity_cis
23
pearson_coefficent_cis
0.249858039368429
SE_cis
0.00957101837767693
P_corr_cis
1.69738767723437e-145
R2_covariate_model_cis
0.042564868038826
R2_full_model_cis
0.103822844885002
P_cis
5.71862851404355e-246
P_full_cis
0