SERPINH1
Olink Explore plasma protein · SNPBoost PRS model
R2 Full Model
0.0427
pearson_coefficent
0.2013
sparsity
179
n_cis_pqtl
11
max_cis_pqtl
rs2511005
Diagnostics
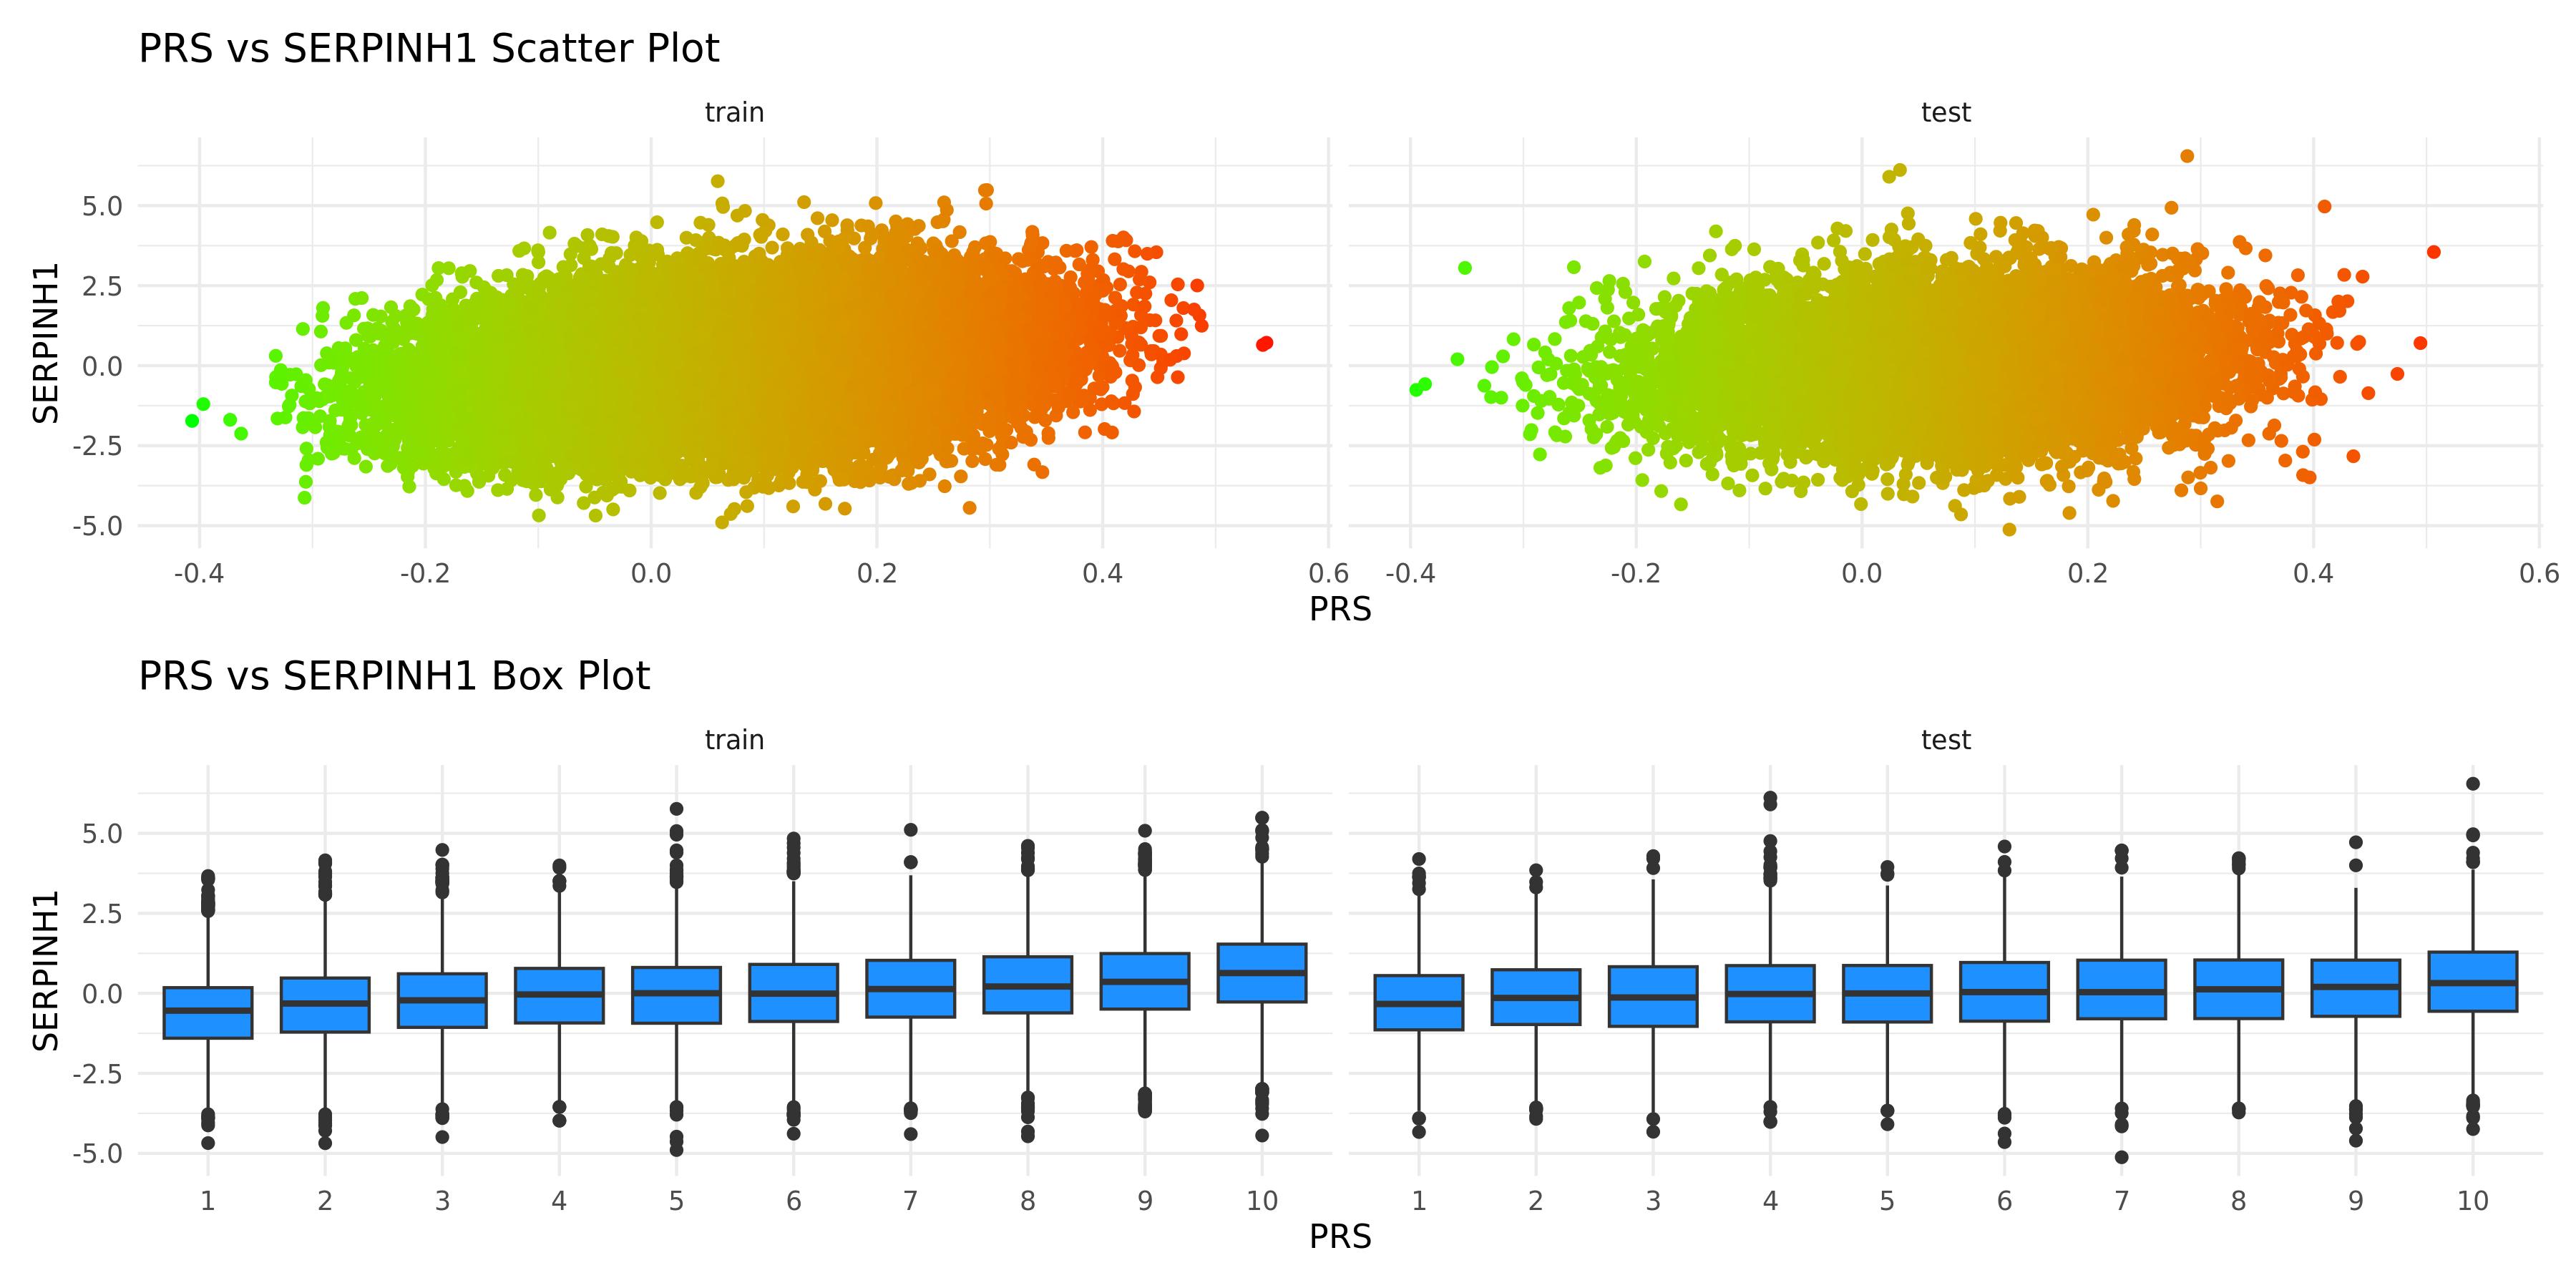
PRS scatter and box plotsenlarge ⤢
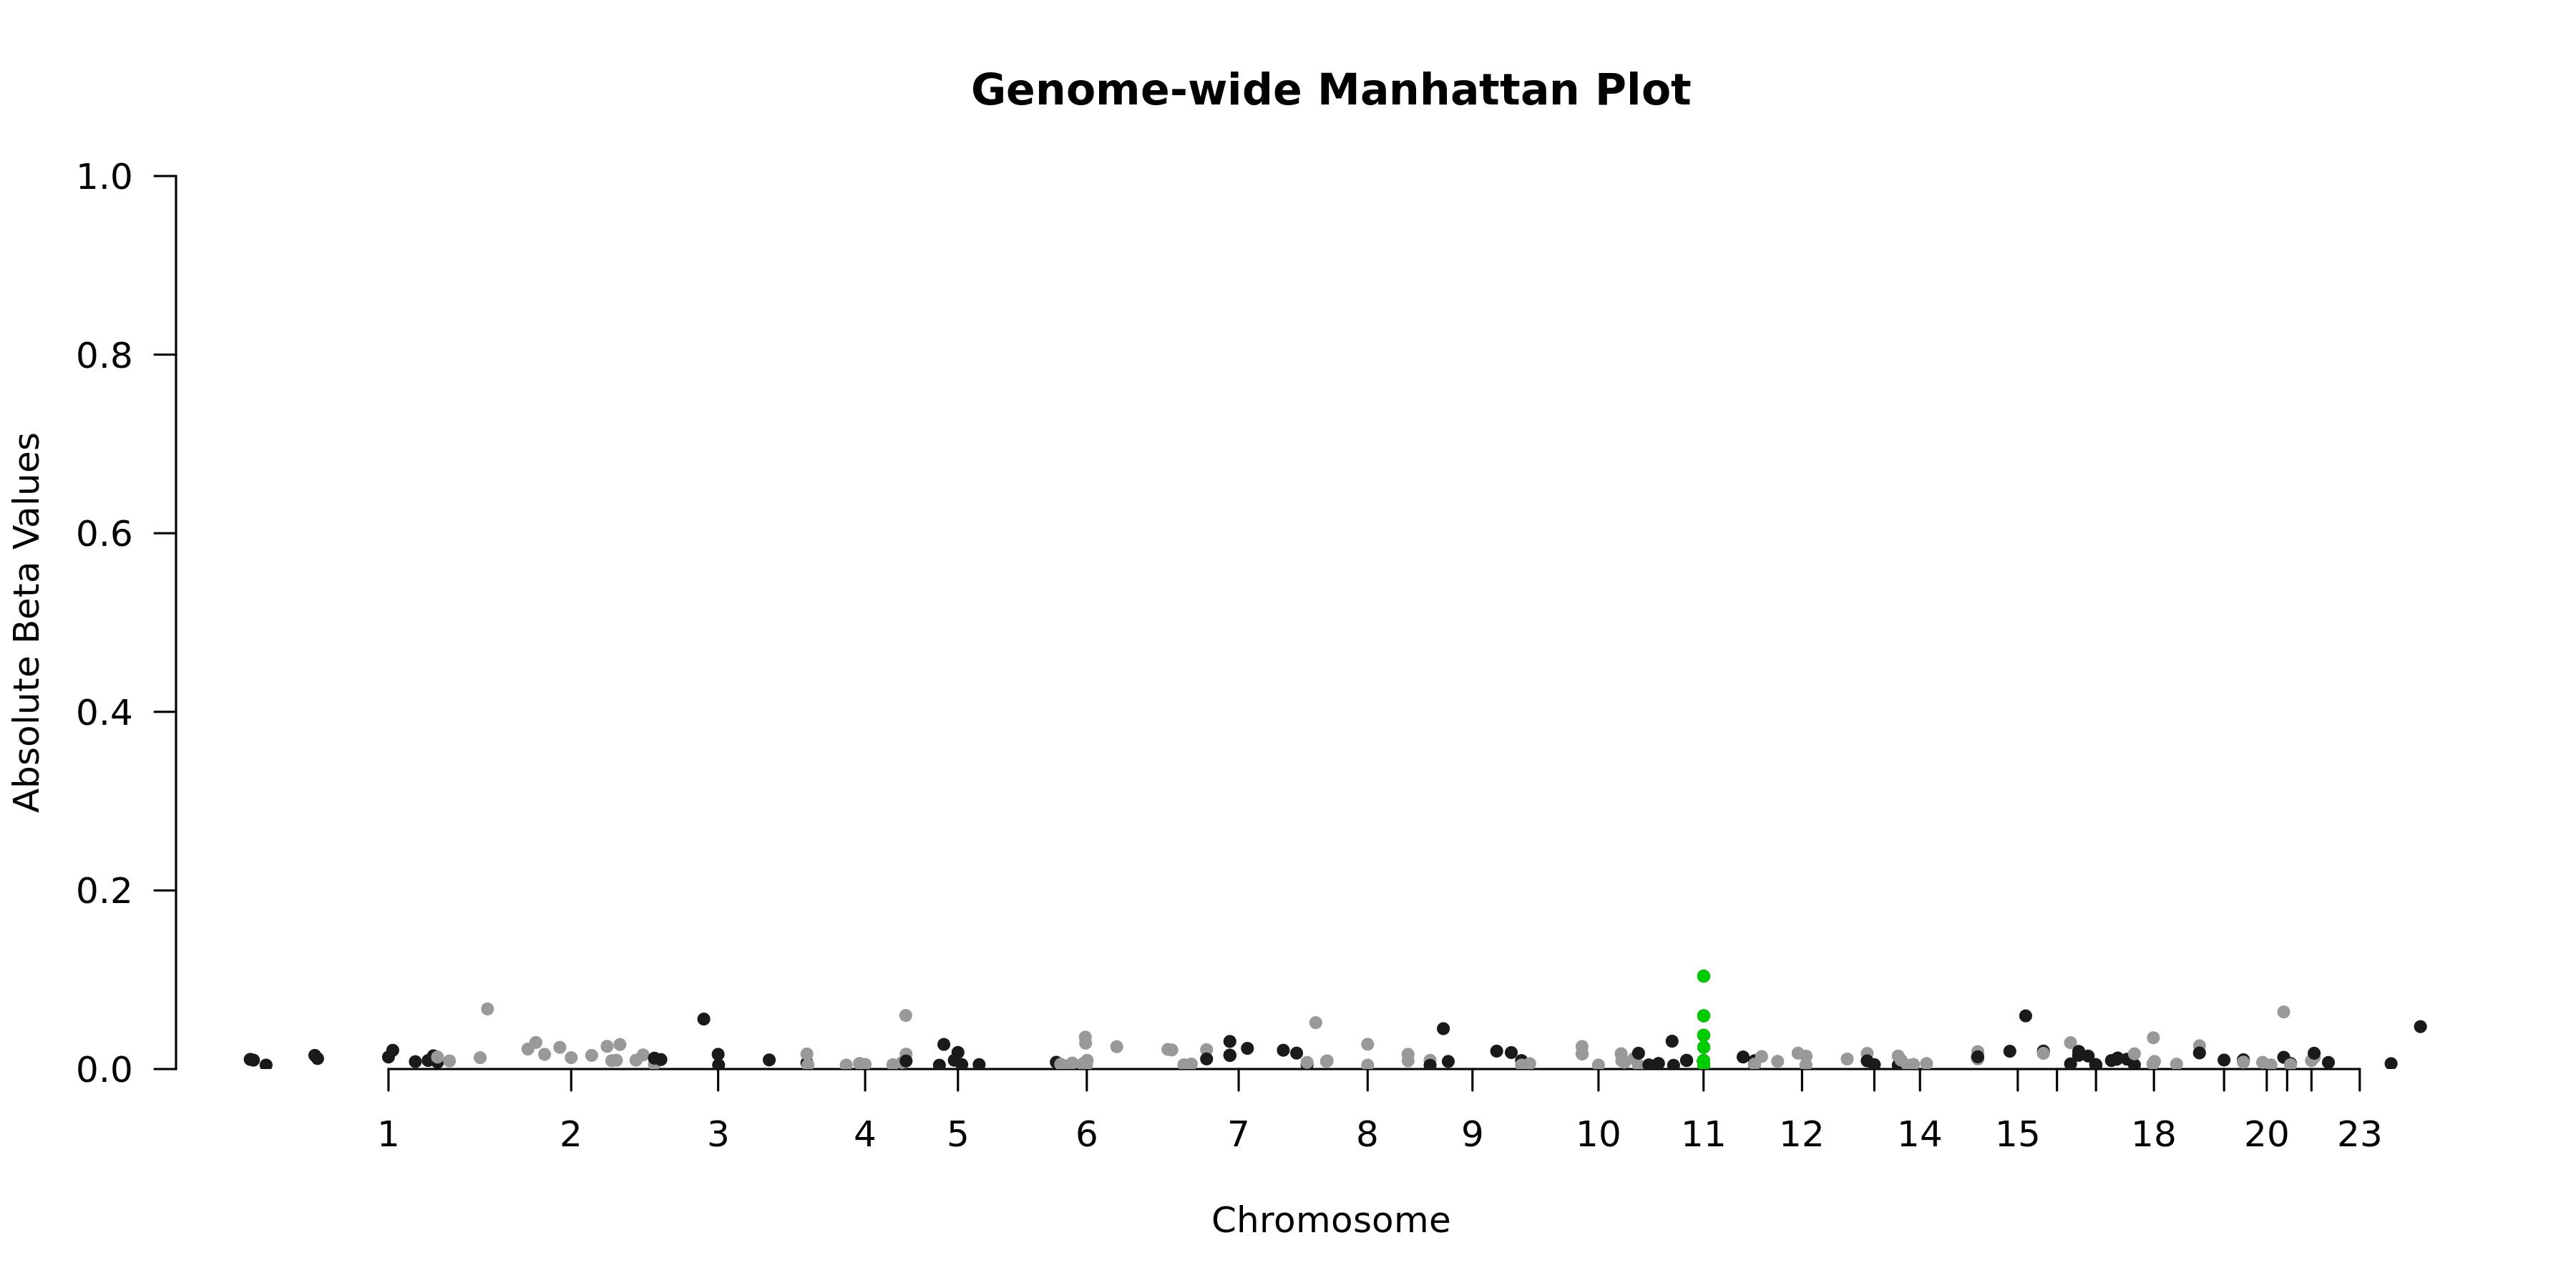
Genome-wide Manhattan Plotenlarge ⤢
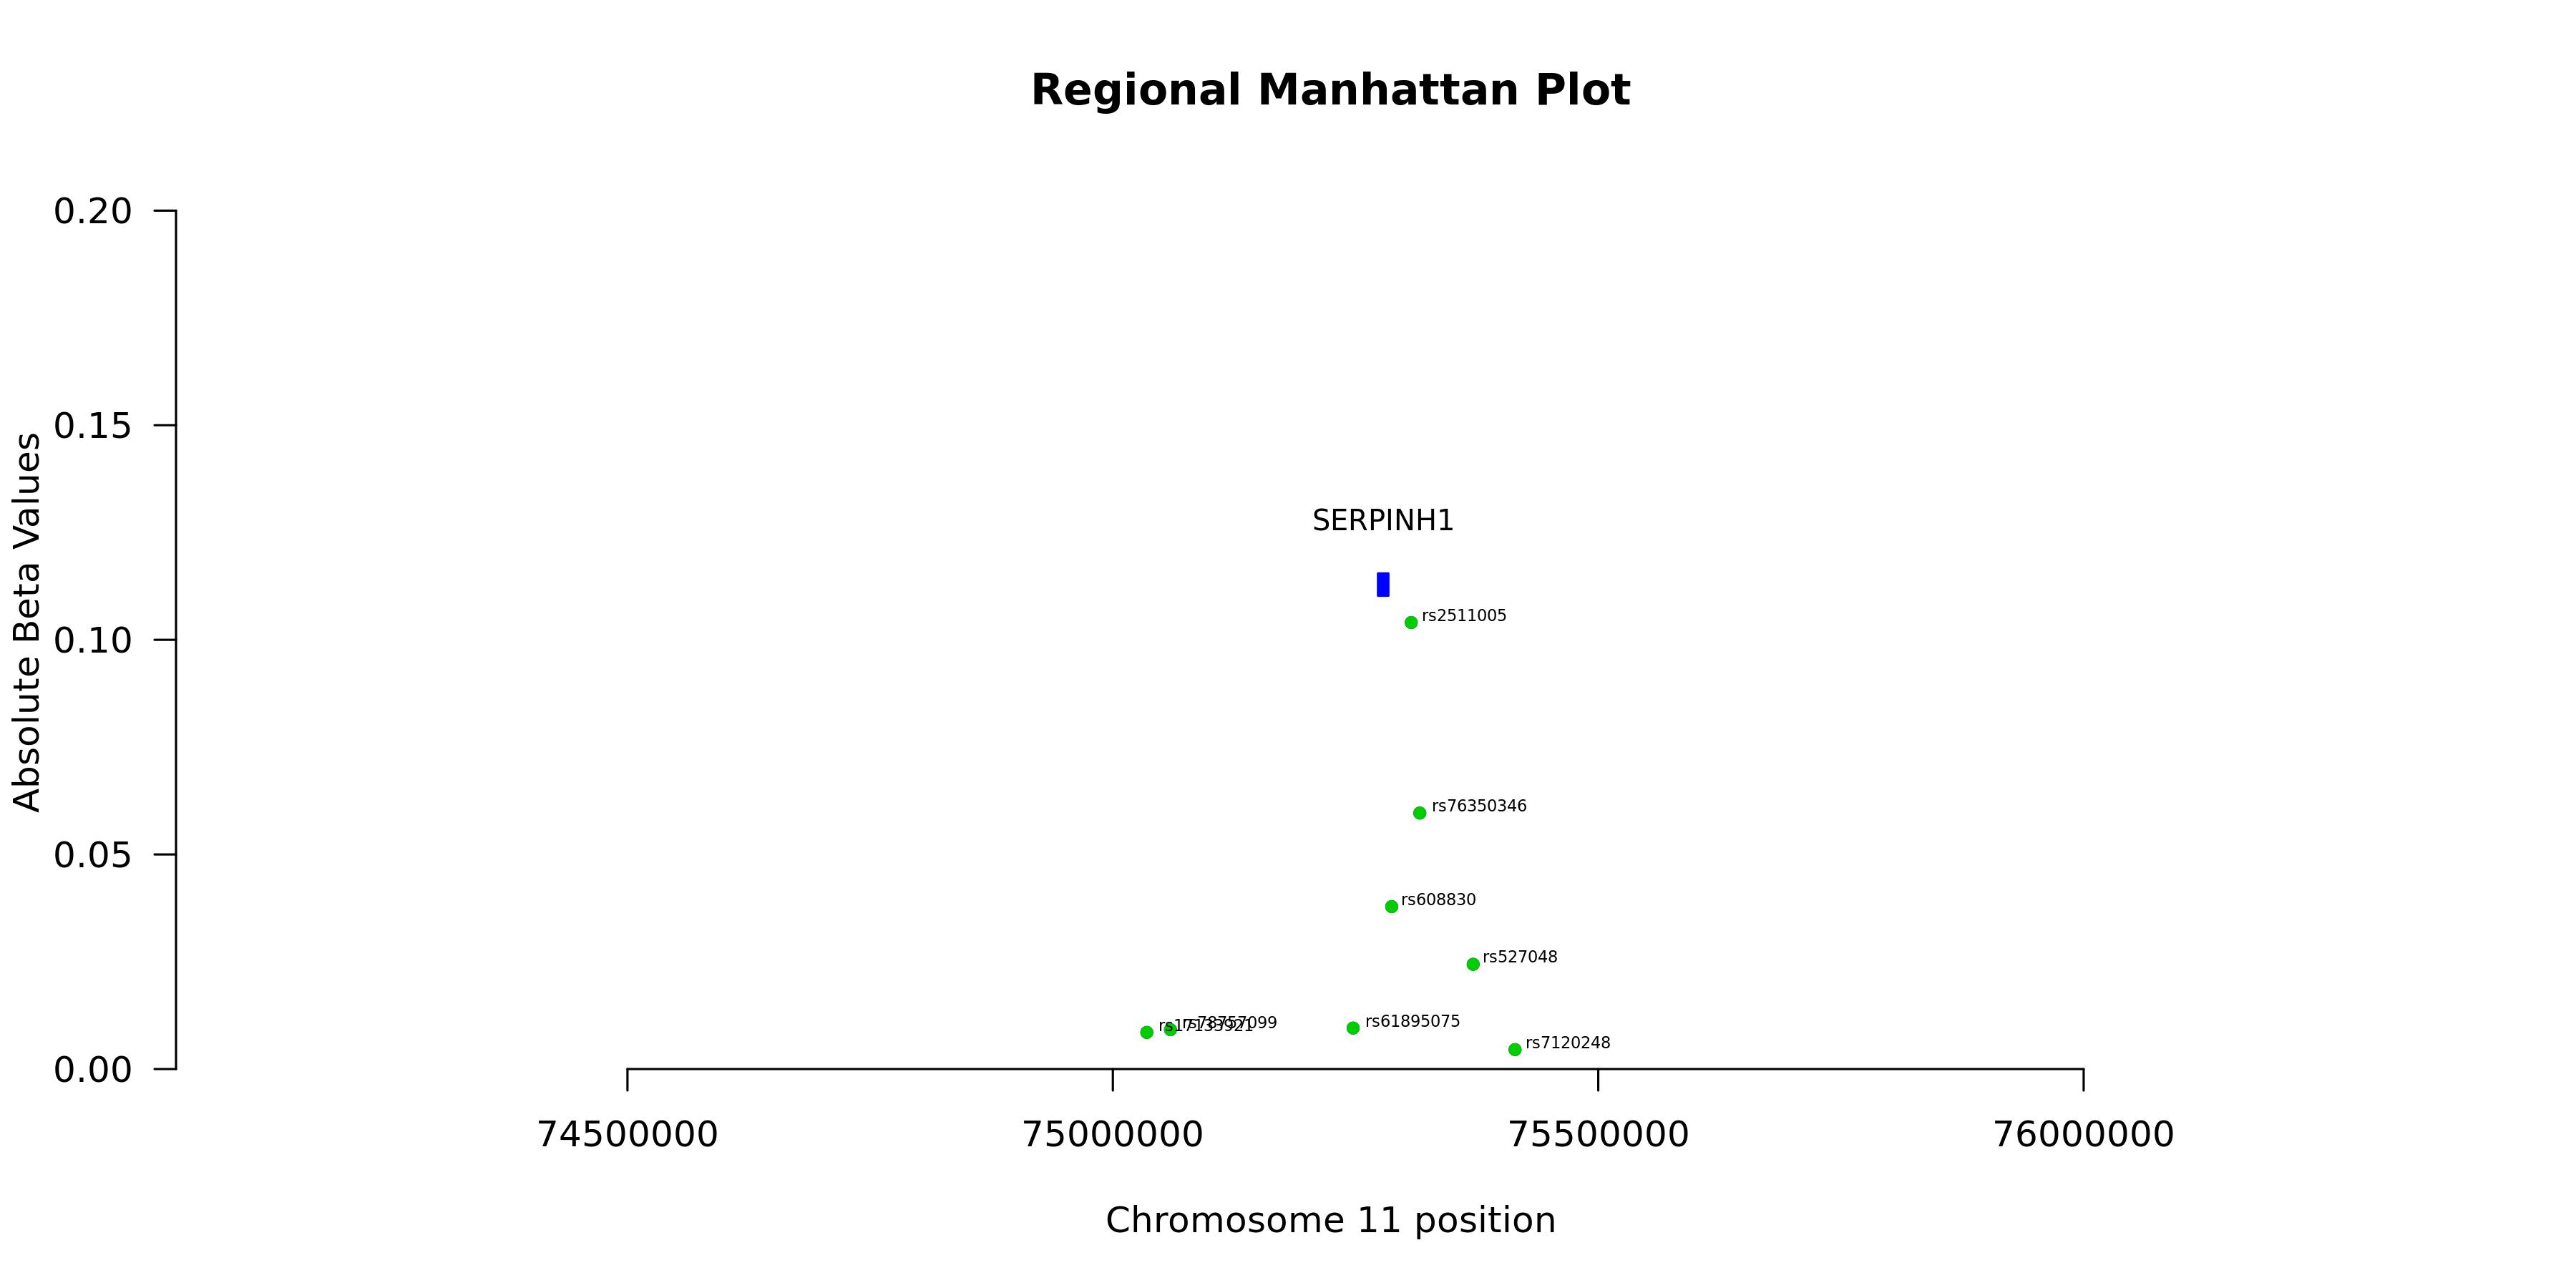
Regional Manhattan Plotenlarge ⤢
Model record
Field
Value
Gene
SERPINH1
test_n
10538
sparsity
179
pearson_coefficent
0.20127976875063
SE
0.0106126811142778
P_corr
1.3372341135885e-78
R2 Covariate Model
0.0025
R2 Full Model
0.0427
P
6.42602267482893e-83
P_full
1.24370574339467e-235
n_cis_pqtl
11
max_cis_pqtl
rs2511005
rank_max_cis_pqtl
1
mean_pqtl_beta
0.0259620991378801
mean_nopqtl_beta
0.0143709778769153
percentage_pqtl
0.0614525139664804
percentage_nopqtl
0.93854748603352
cis and genome-wide metrics
Field
Value
Gene
SERPINH1
test_n_genomewide
10538
sparsity_genomewide
179
pearson_coefficent_genomewide
0.20127976875063
SE_genomewide
0.0106126811142778
P_corr_genomewide
1.3372341135885e-78
R2_covariate_model_genomewide
0.00247473197965042
R2_full_model_genomewide
0.0427147810485148
P_genomewide
6.42602267482893e-83
P_full_genomewide
1.24370574339467e-235
n_cis_pqtl
11
max_cis_pqtl
rs2511005
rank_max_cis_pqtl
1
mean_pqtl_beta
0.0259620991378801
mean_nopqtl_beta
0.0143709778769153
percentage_pqtl
0.0614525139664804
percentage_nopqtl
0.93854748603352
test_n_cis
10538
sparsity_cis
11
pearson_coefficent_cis
0.0839883343594078
SE_cis
0.0107961397439764
P_corr_cis
8.13322609296784e-15
R2_covariate_model_cis
0.00247473197965042
R2_full_model_cis
0.00936069620633995
P_cis
4.99948653179752e-20
P_full_cis
5.06857487512679e-60