S100G
Olink Explore plasma protein · SNPBoost PRS model
R2 Full Model
0.0637
pearson_coefficent
0.2267
sparsity
234
n_cis_pqtl
0
max_cis_pqtl
—
Diagnostics
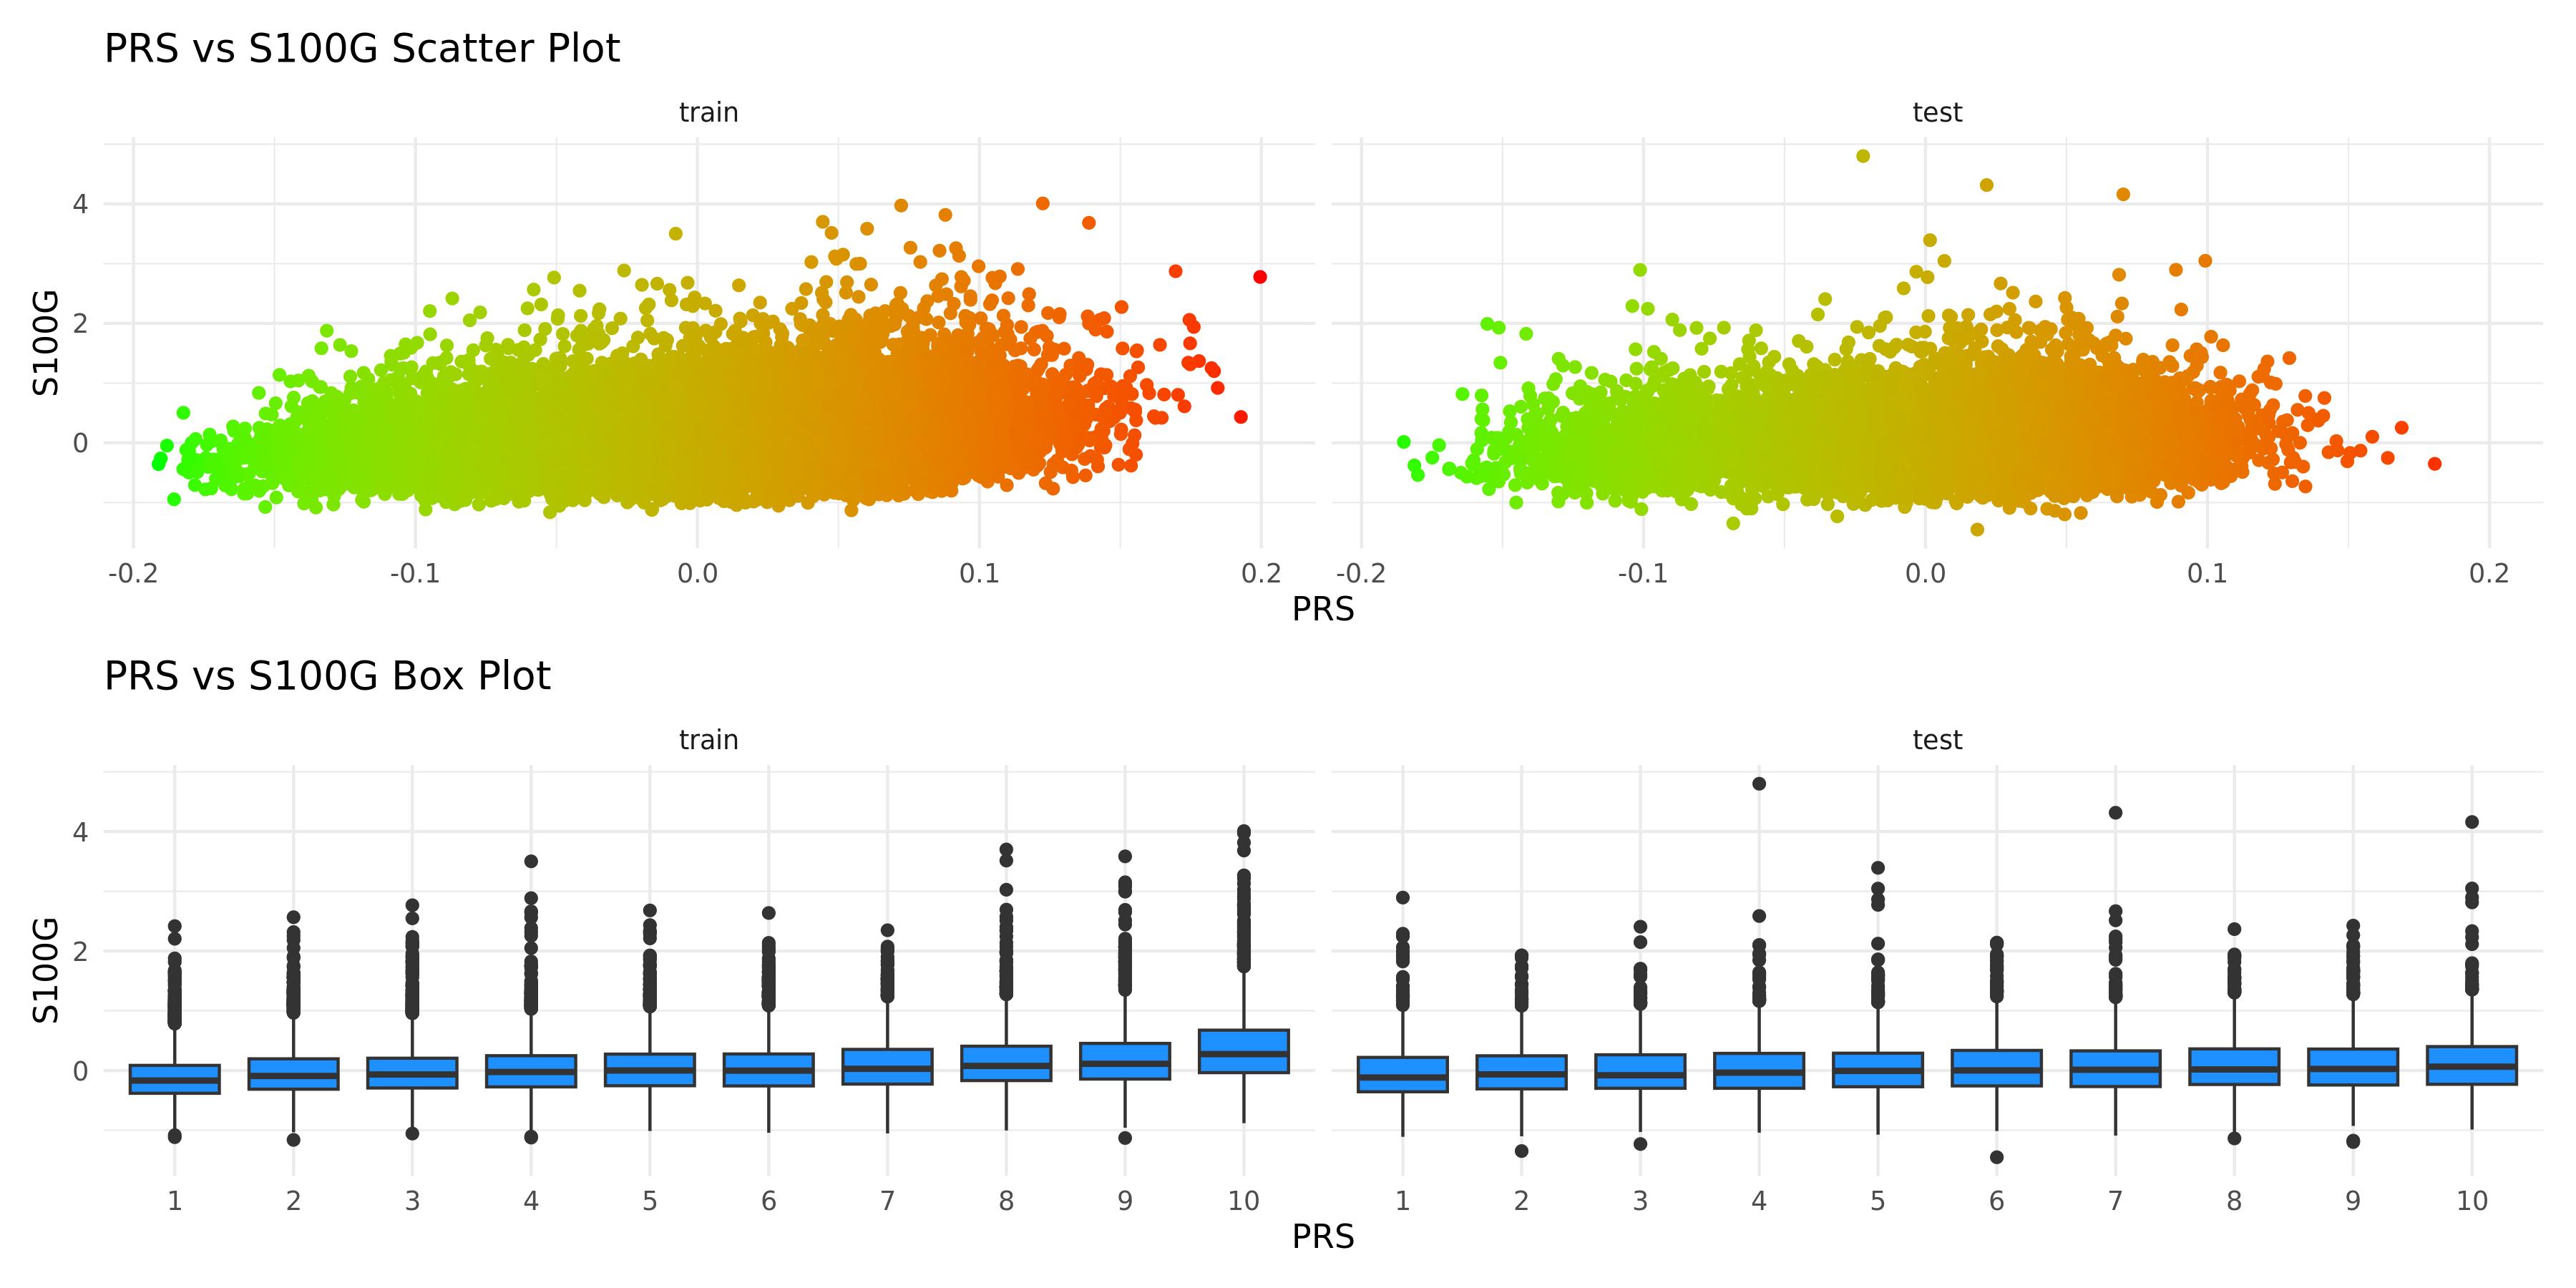
PRS scatter and box plotsenlarge ⤢
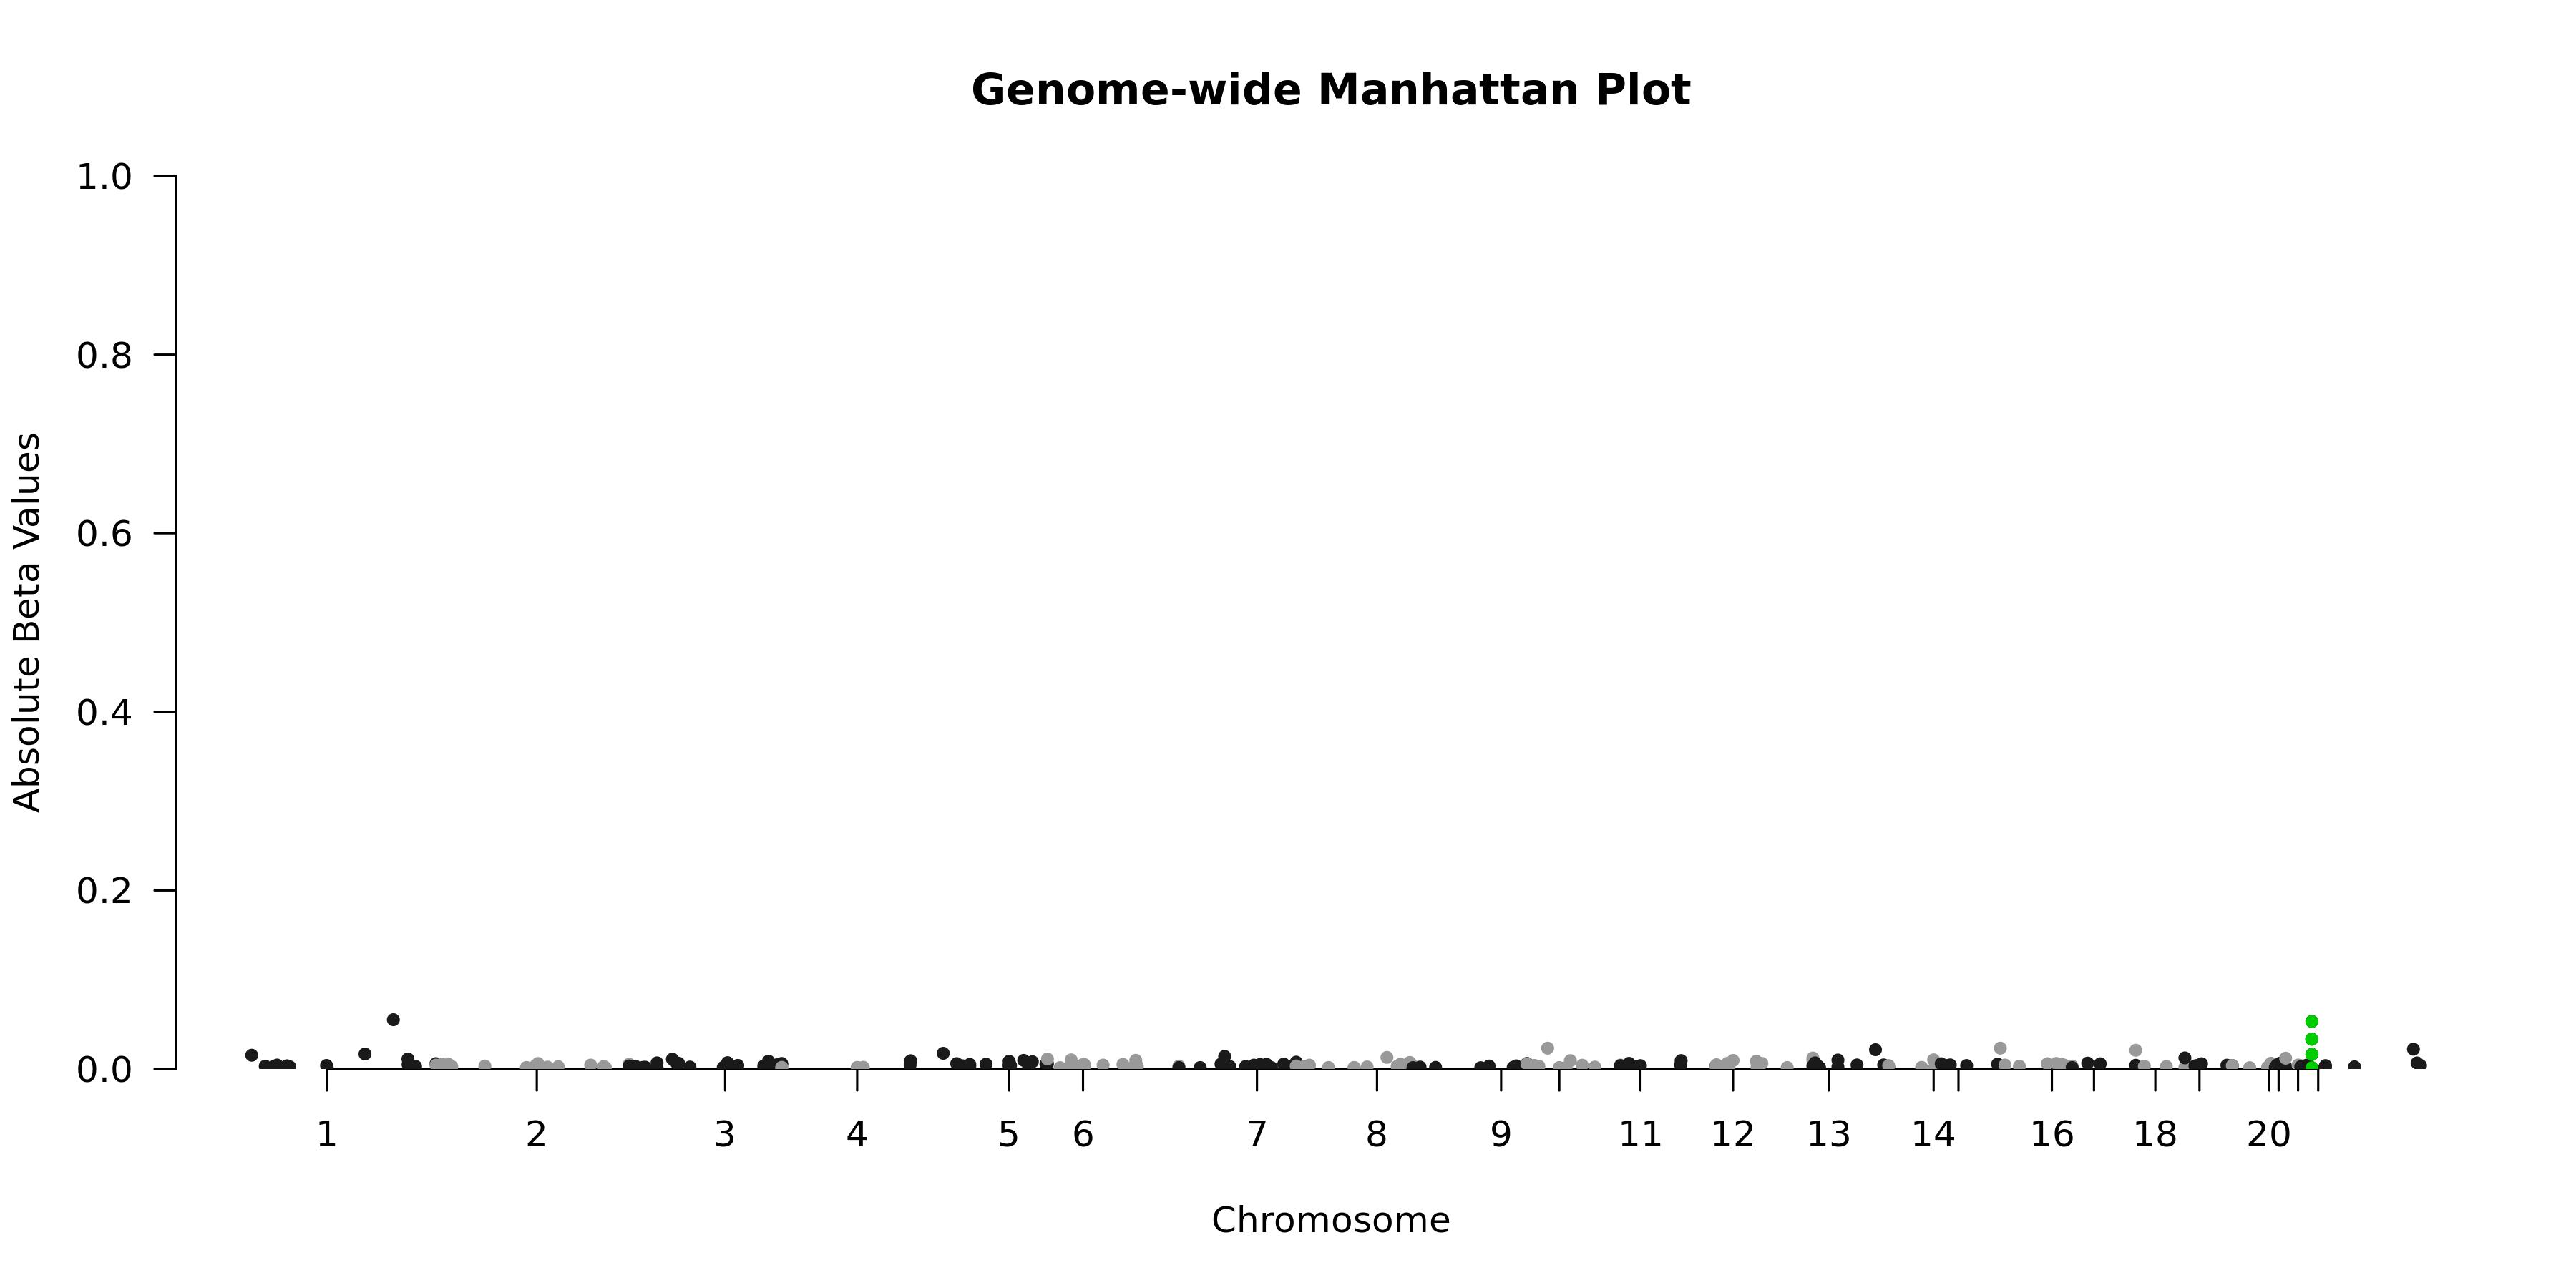
Genome-wide Manhattan Plotenlarge ⤢
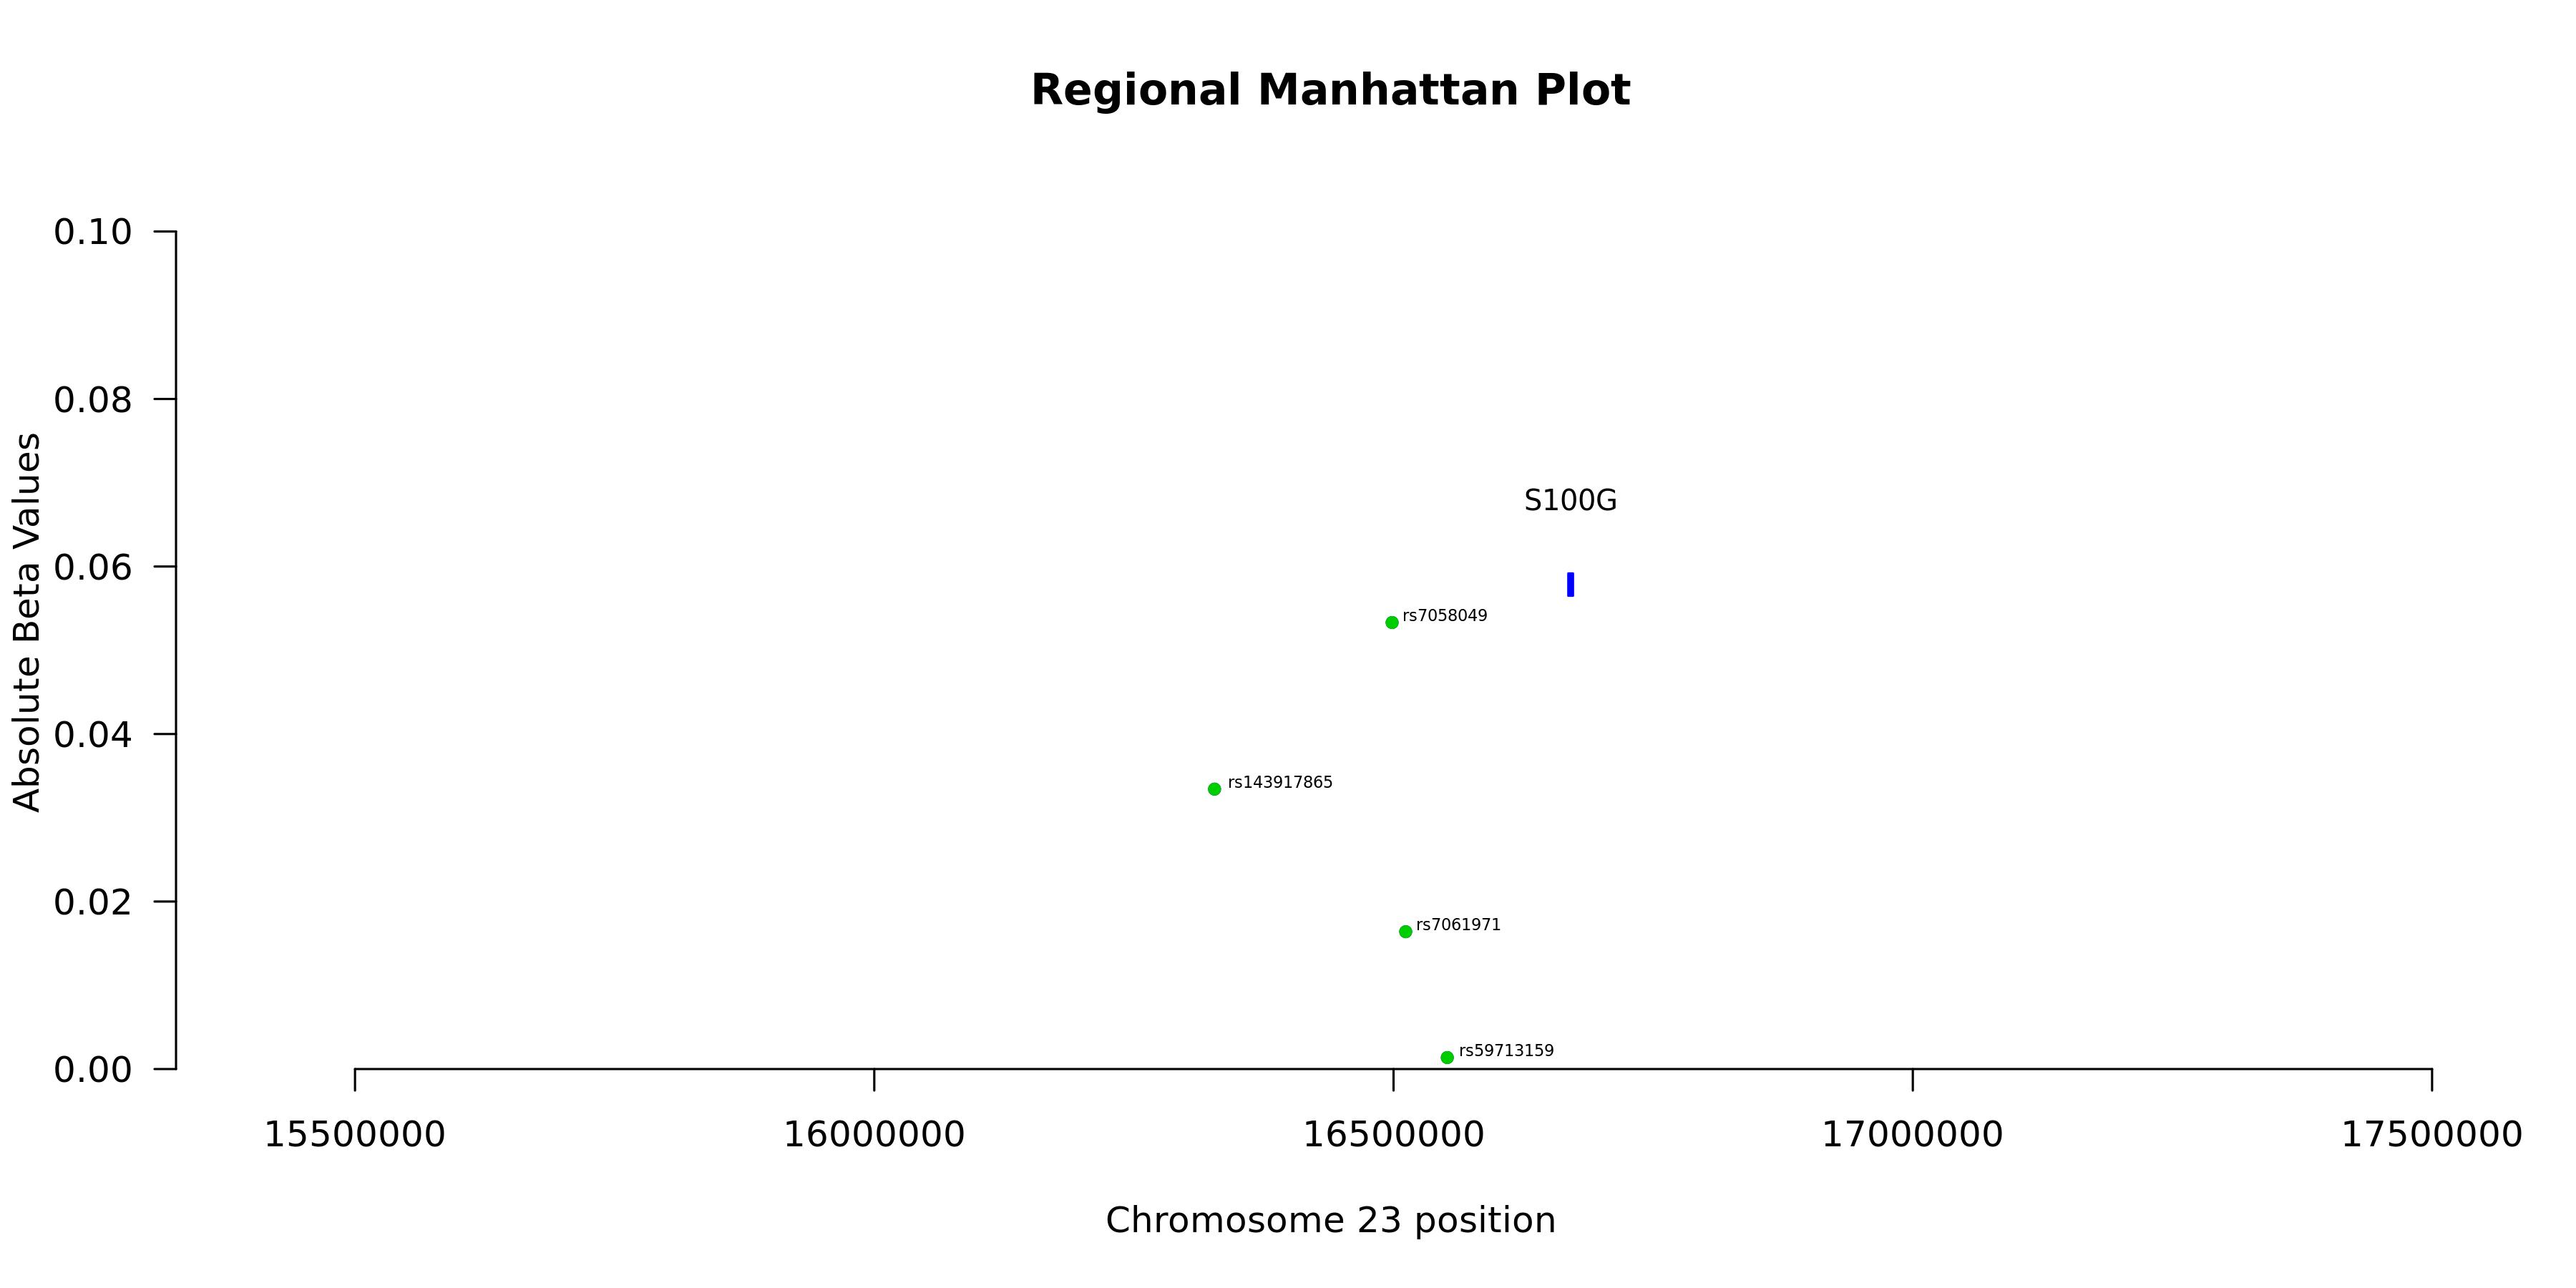
Regional Manhattan Plotenlarge ⤢
Model record
Field
Value
Gene
S100G
test_n
10538
sparsity
234
pearson_coefficent
0.226671432611714
SE
0.0104758379897251
P_corr
3.71700311852786e-101
R2 Covariate Model
0.0116
R2 Full Model
0.0637
P
6.14024605760911e-126
P_full
4.62634315215538e-255
n_cis_pqtl
0
max_cis_pqtl
—
rank_max_cis_pqtl
—
mean_pqtl_beta
—
mean_nopqtl_beta
0.00542788333601498
percentage_pqtl
0
percentage_nopqtl
1
cis and genome-wide metrics
Field
Value
Gene
S100G
test_n_genomewide
10538
sparsity_genomewide
234
pearson_coefficent_genomewide
0.226671432611714
SE_genomewide
0.0104758379897251
P_corr_genomewide
3.71700311852786e-101
R2_covariate_model_genomewide
0.0115757439226262
R2_full_model_genomewide
0.0637287216390793
P_genomewide
6.14024605760911e-126
P_full_genomewide
4.62634315215538e-255
n_cis_pqtl
0
max_cis_pqtl
NA
rank_max_cis_pqtl
NA
mean_pqtl_beta
NA
mean_nopqtl_beta
0.00542788333601498
percentage_pqtl
0
percentage_nopqtl
1
test_n_cis
NA
sparsity_cis
NA
pearson_coefficent_cis
NA
SE_cis
NA
P_corr_cis
NA
R2_covariate_model_cis
NA
R2_full_model_cis
NA
P_cis
NA
P_full_cis
NA