RPGR
Olink Explore plasma protein · SNPBoost PRS model
R2 Full Model
0.0208
pearson_coefficent
0.1444
sparsity
110
n_cis_pqtl
0
max_cis_pqtl
—
Diagnostics
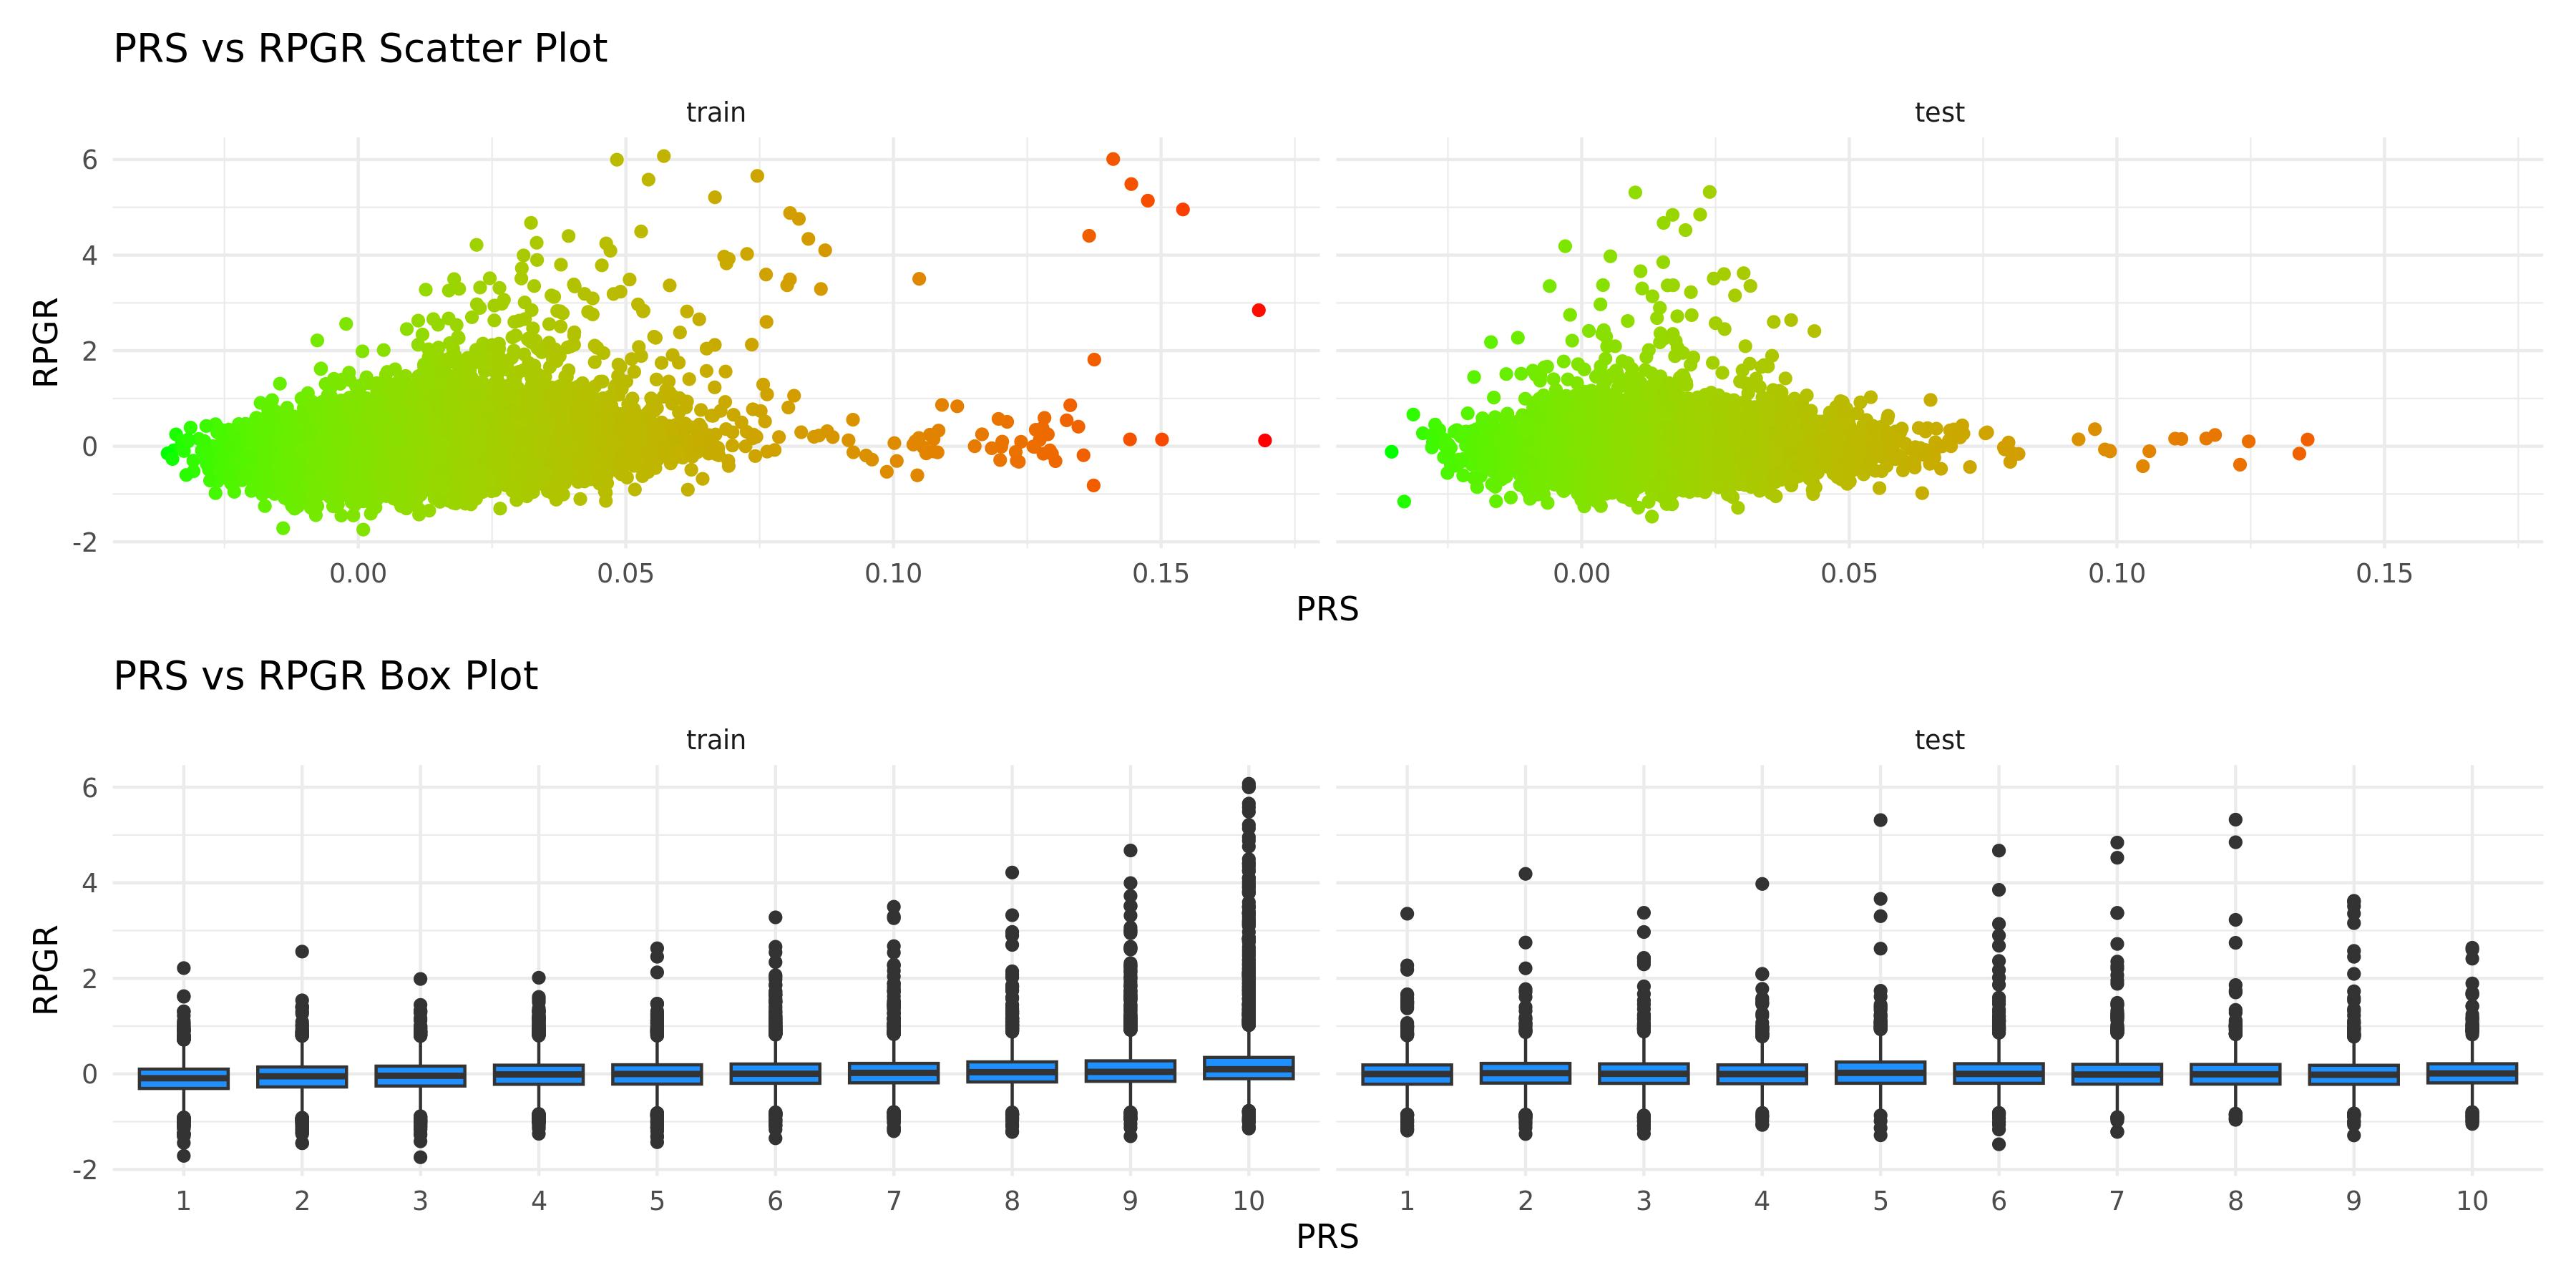
PRS scatter and box plotsenlarge ⤢
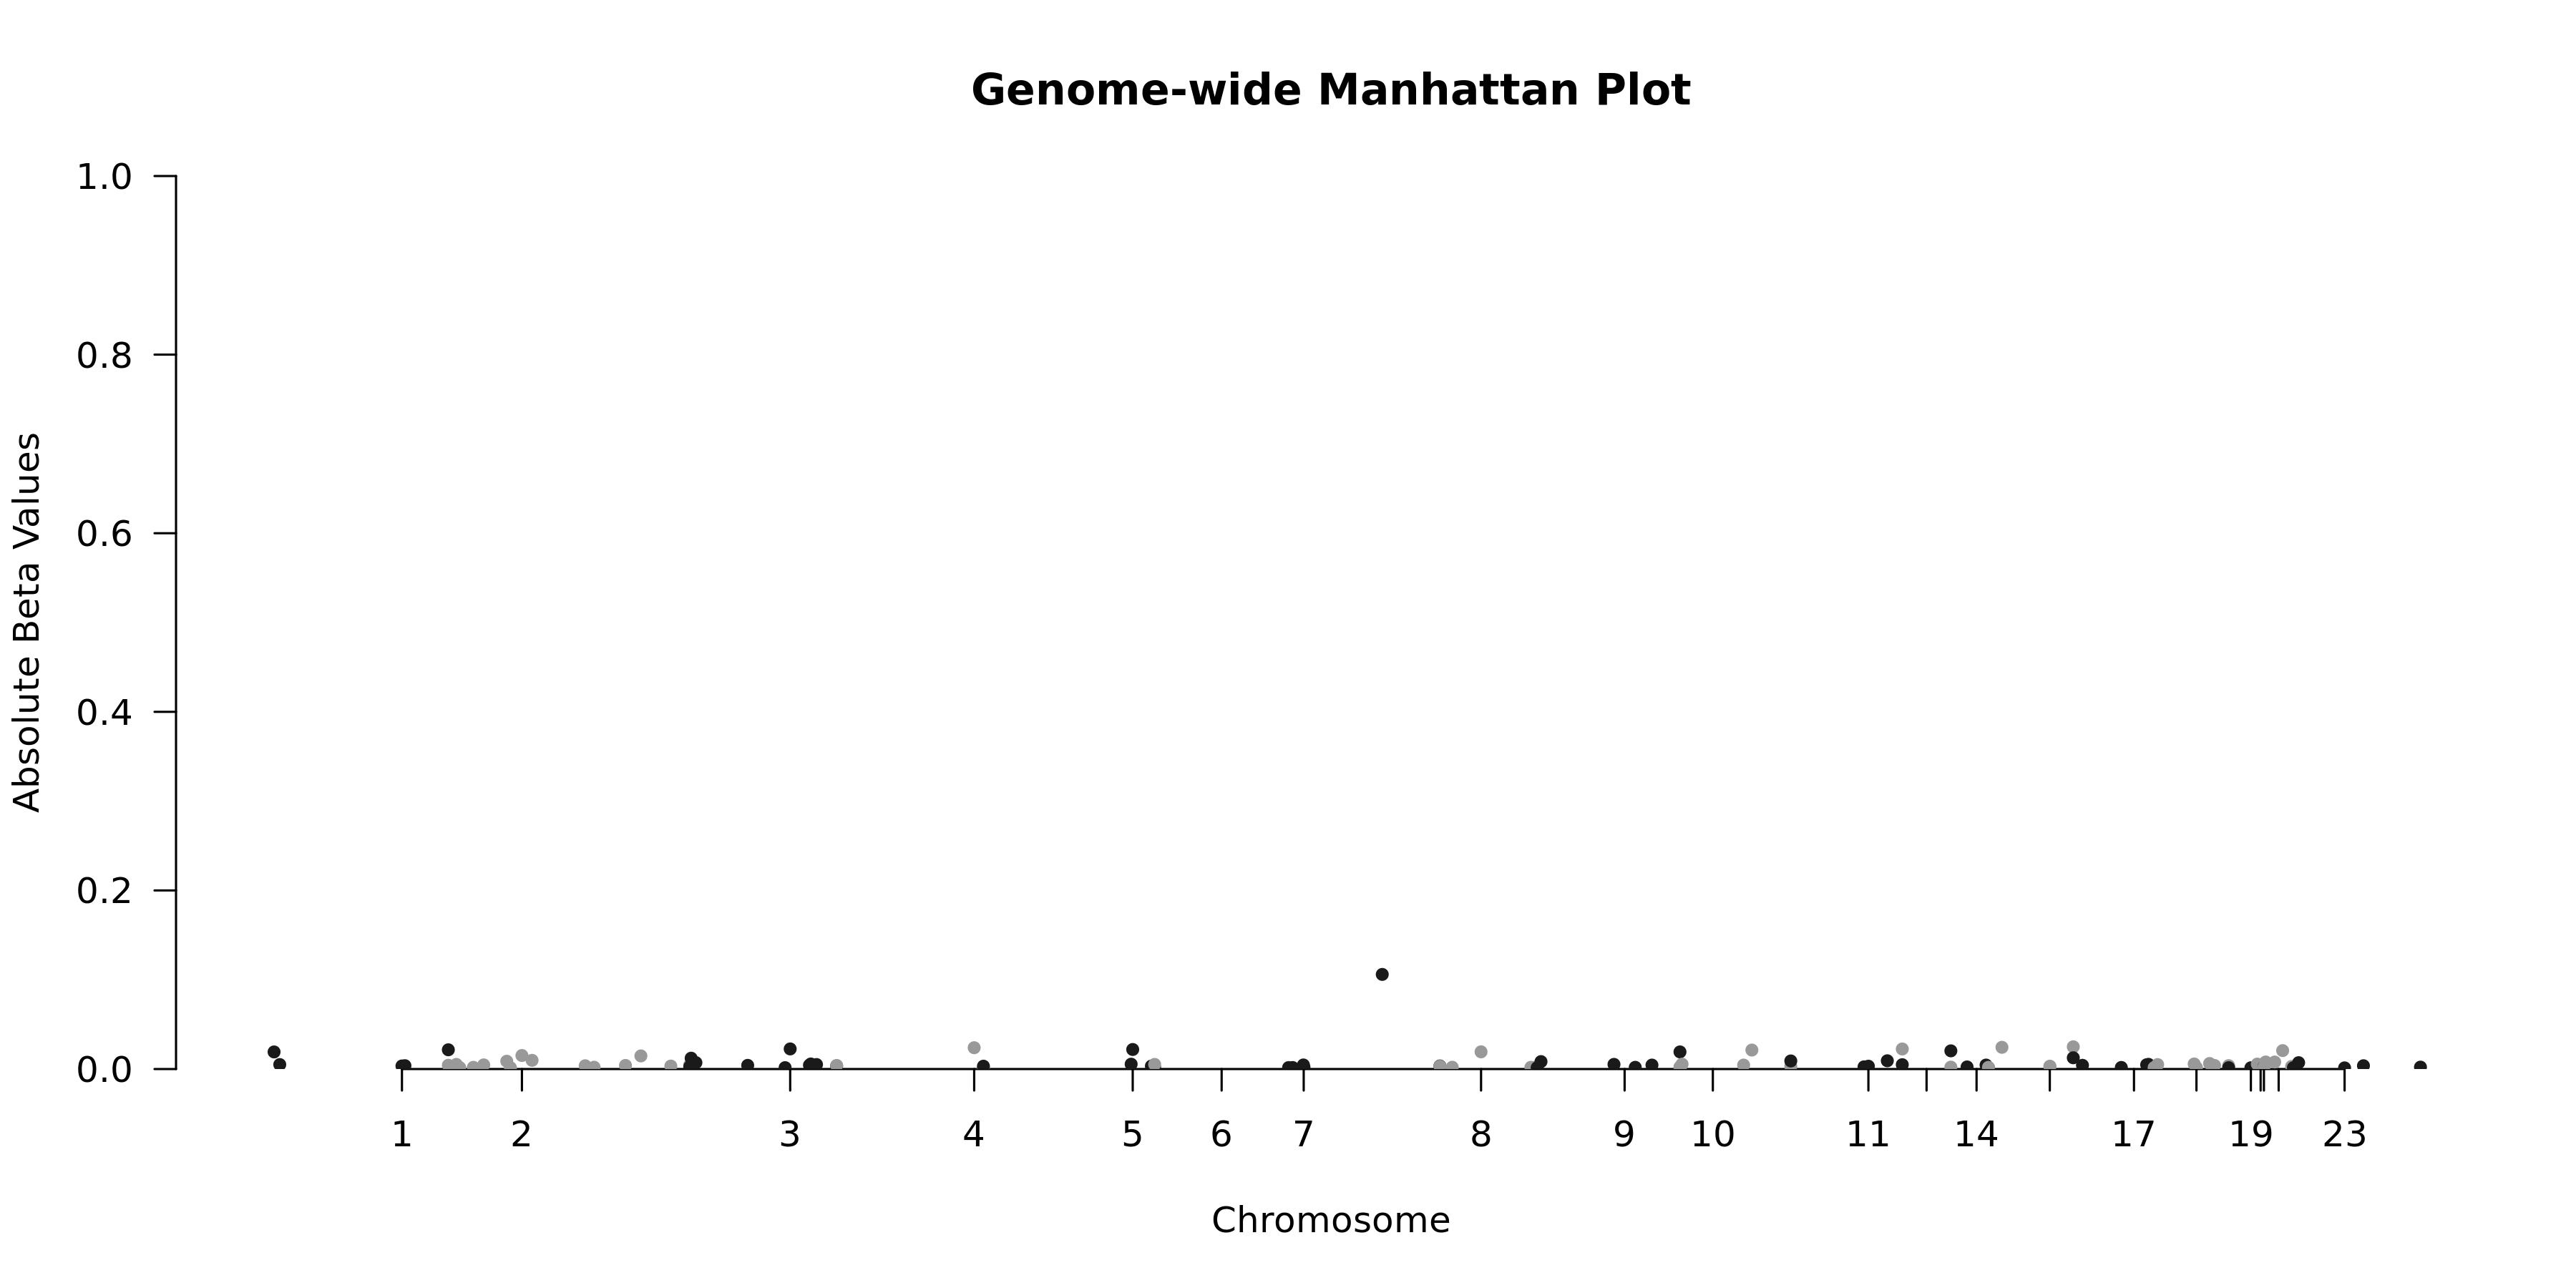
Genome-wide Manhattan Plotenlarge ⤢
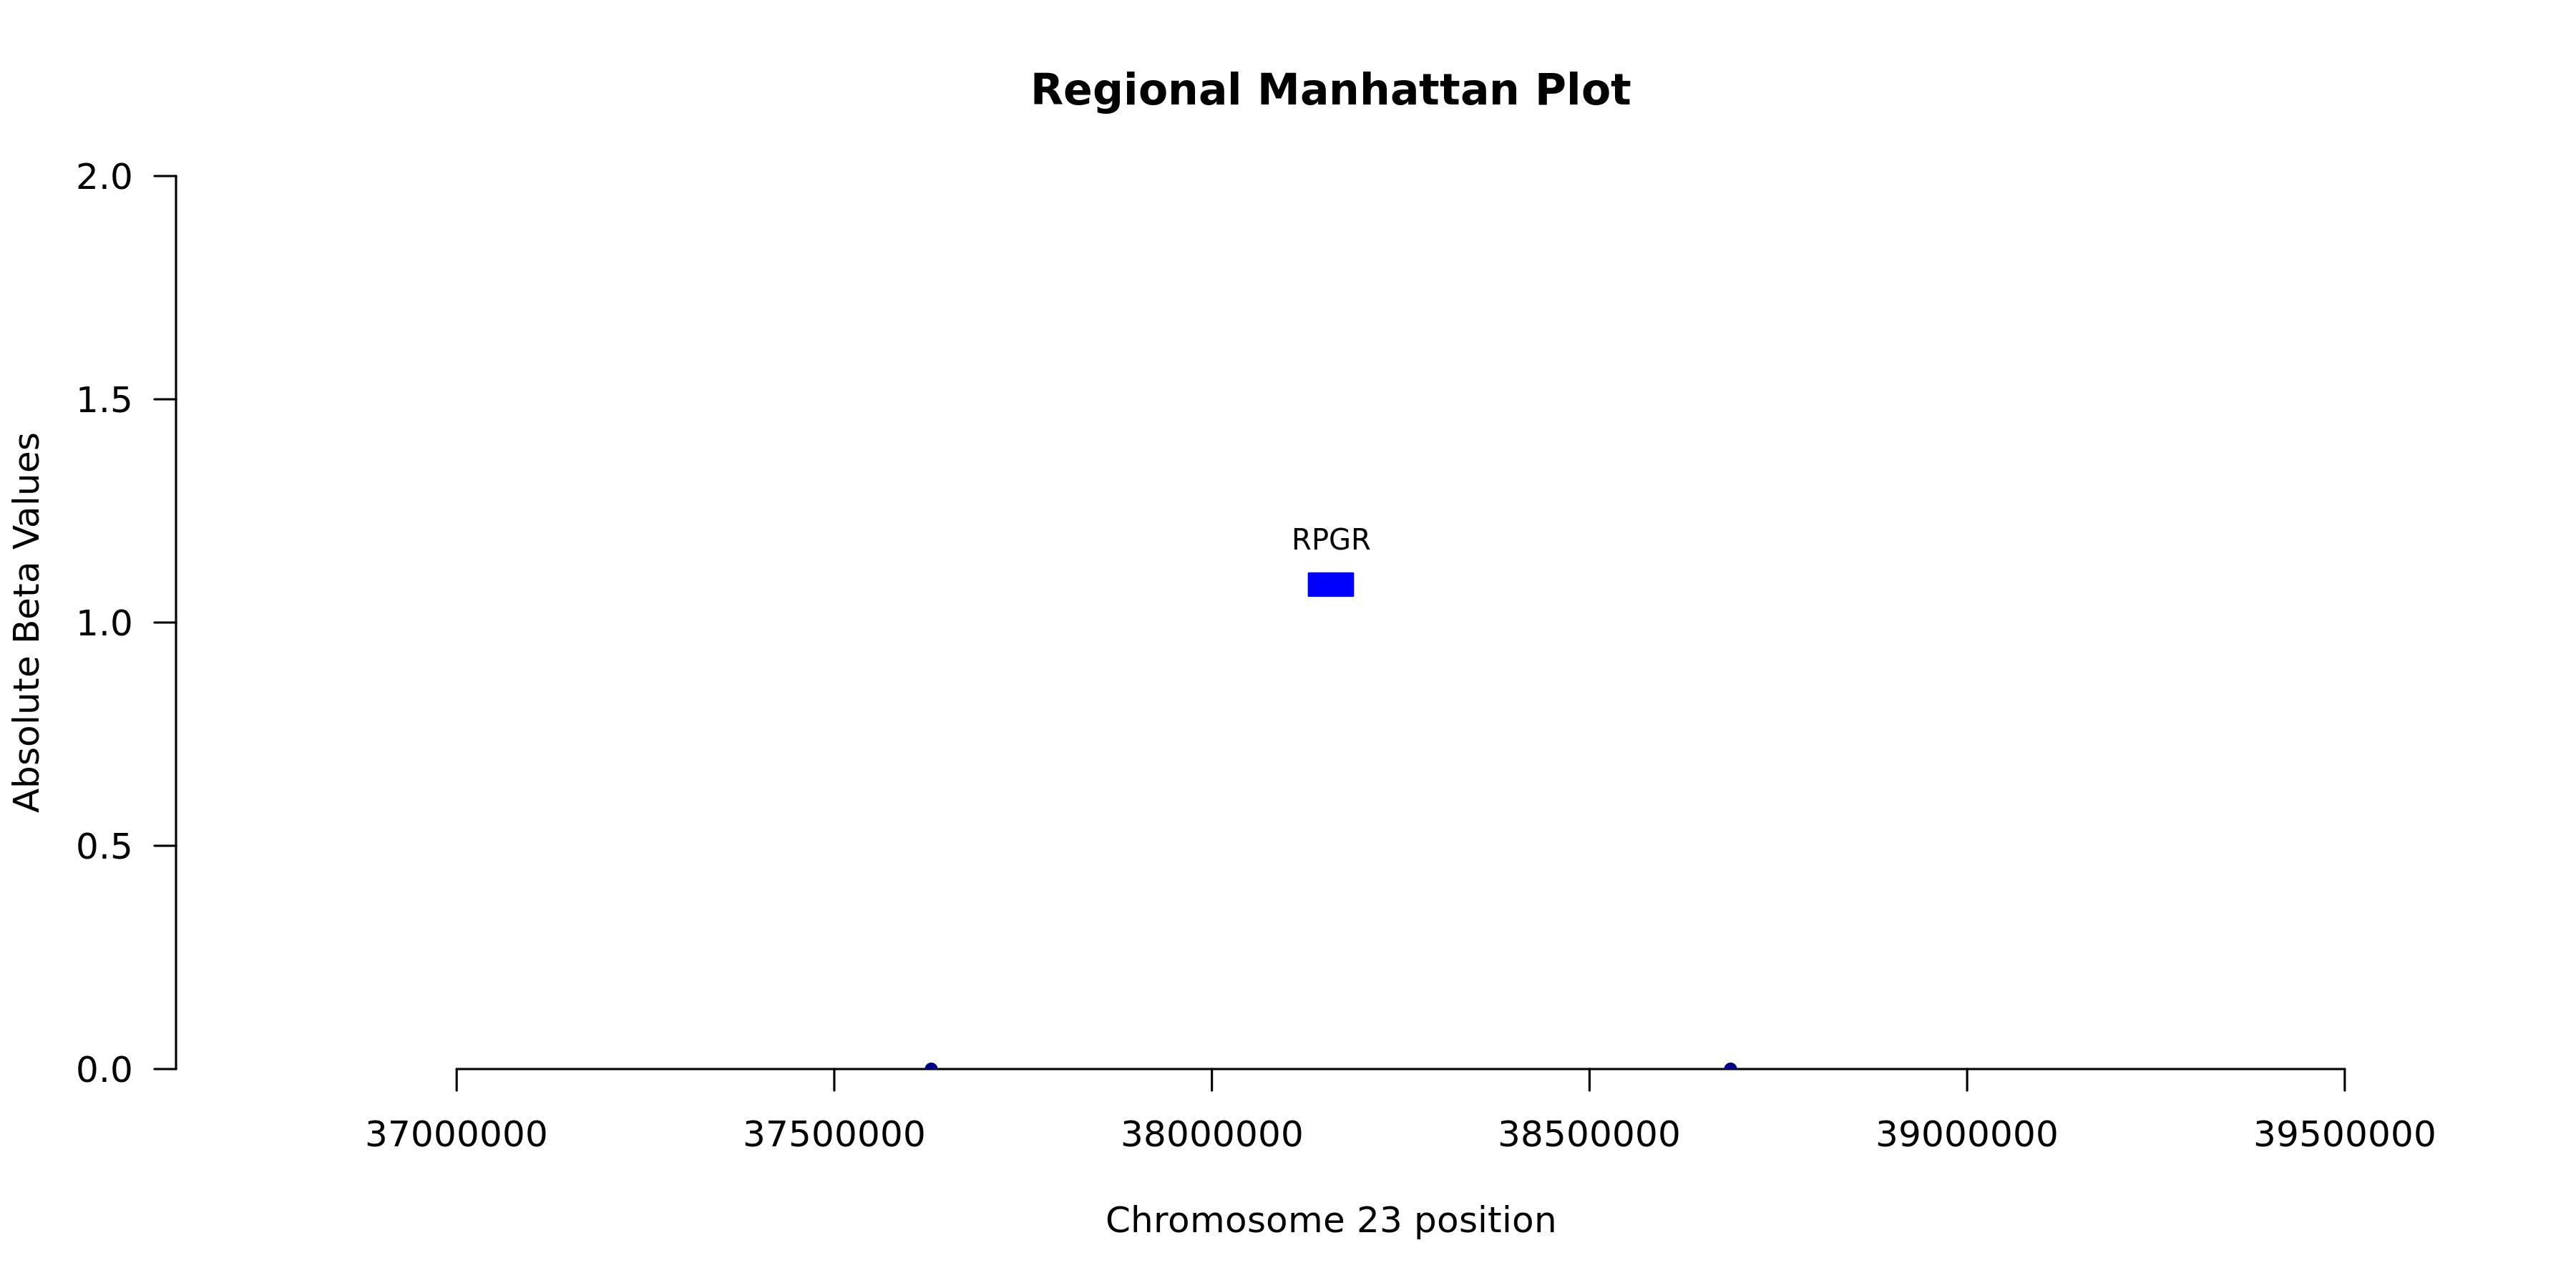
Regional Manhattan Plotenlarge ⤢
Model record
Field
Value
Gene
RPGR
test_n
10538
sparsity
110
pearson_coefficent
0.144355197431898
SE
0.0107773849211375
P_corr
1.69174184311954e-40
R2 Covariate Model
0
R2 Full Model
0.0208
P
8.03124403593094e-41
P_full
2.43592748160236e-131
n_cis_pqtl
0
max_cis_pqtl
—
rank_max_cis_pqtl
—
mean_pqtl_beta
—
mean_nopqtl_beta
0.00707704684197228
percentage_pqtl
0
percentage_nopqtl
1
cis and genome-wide metrics
Field
Value
Gene
RPGR
test_n_genomewide
10538
sparsity_genomewide
110
pearson_coefficent_genomewide
0.144355197431898
SE_genomewide
0.0107773849211375
P_corr_genomewide
1.69174184311954e-40
R2_covariate_model_genomewide
4.35412681952796e-05
R2_full_model_genomewide
0.0208353460920213
P_genomewide
8.03124403593094e-41
P_full_genomewide
2.43592748160236e-131
n_cis_pqtl
0
max_cis_pqtl
NA
rank_max_cis_pqtl
NA
mean_pqtl_beta
NA
mean_nopqtl_beta
0.00707704684197228
percentage_pqtl
0
percentage_nopqtl
1
test_n_cis
NA
sparsity_cis
NA
pearson_coefficent_cis
NA
SE_cis
NA
P_corr_cis
NA
R2_covariate_model_cis
NA
R2_full_model_cis
NA
P_cis
NA
P_full_cis
NA