PYY
Olink Explore plasma protein · SNPBoost PRS model
R2 Full Model
0.1216
pearson_coefficent
0.2934
sparsity
415
n_cis_pqtl
15
max_cis_pqtl
rs151196
Diagnostics
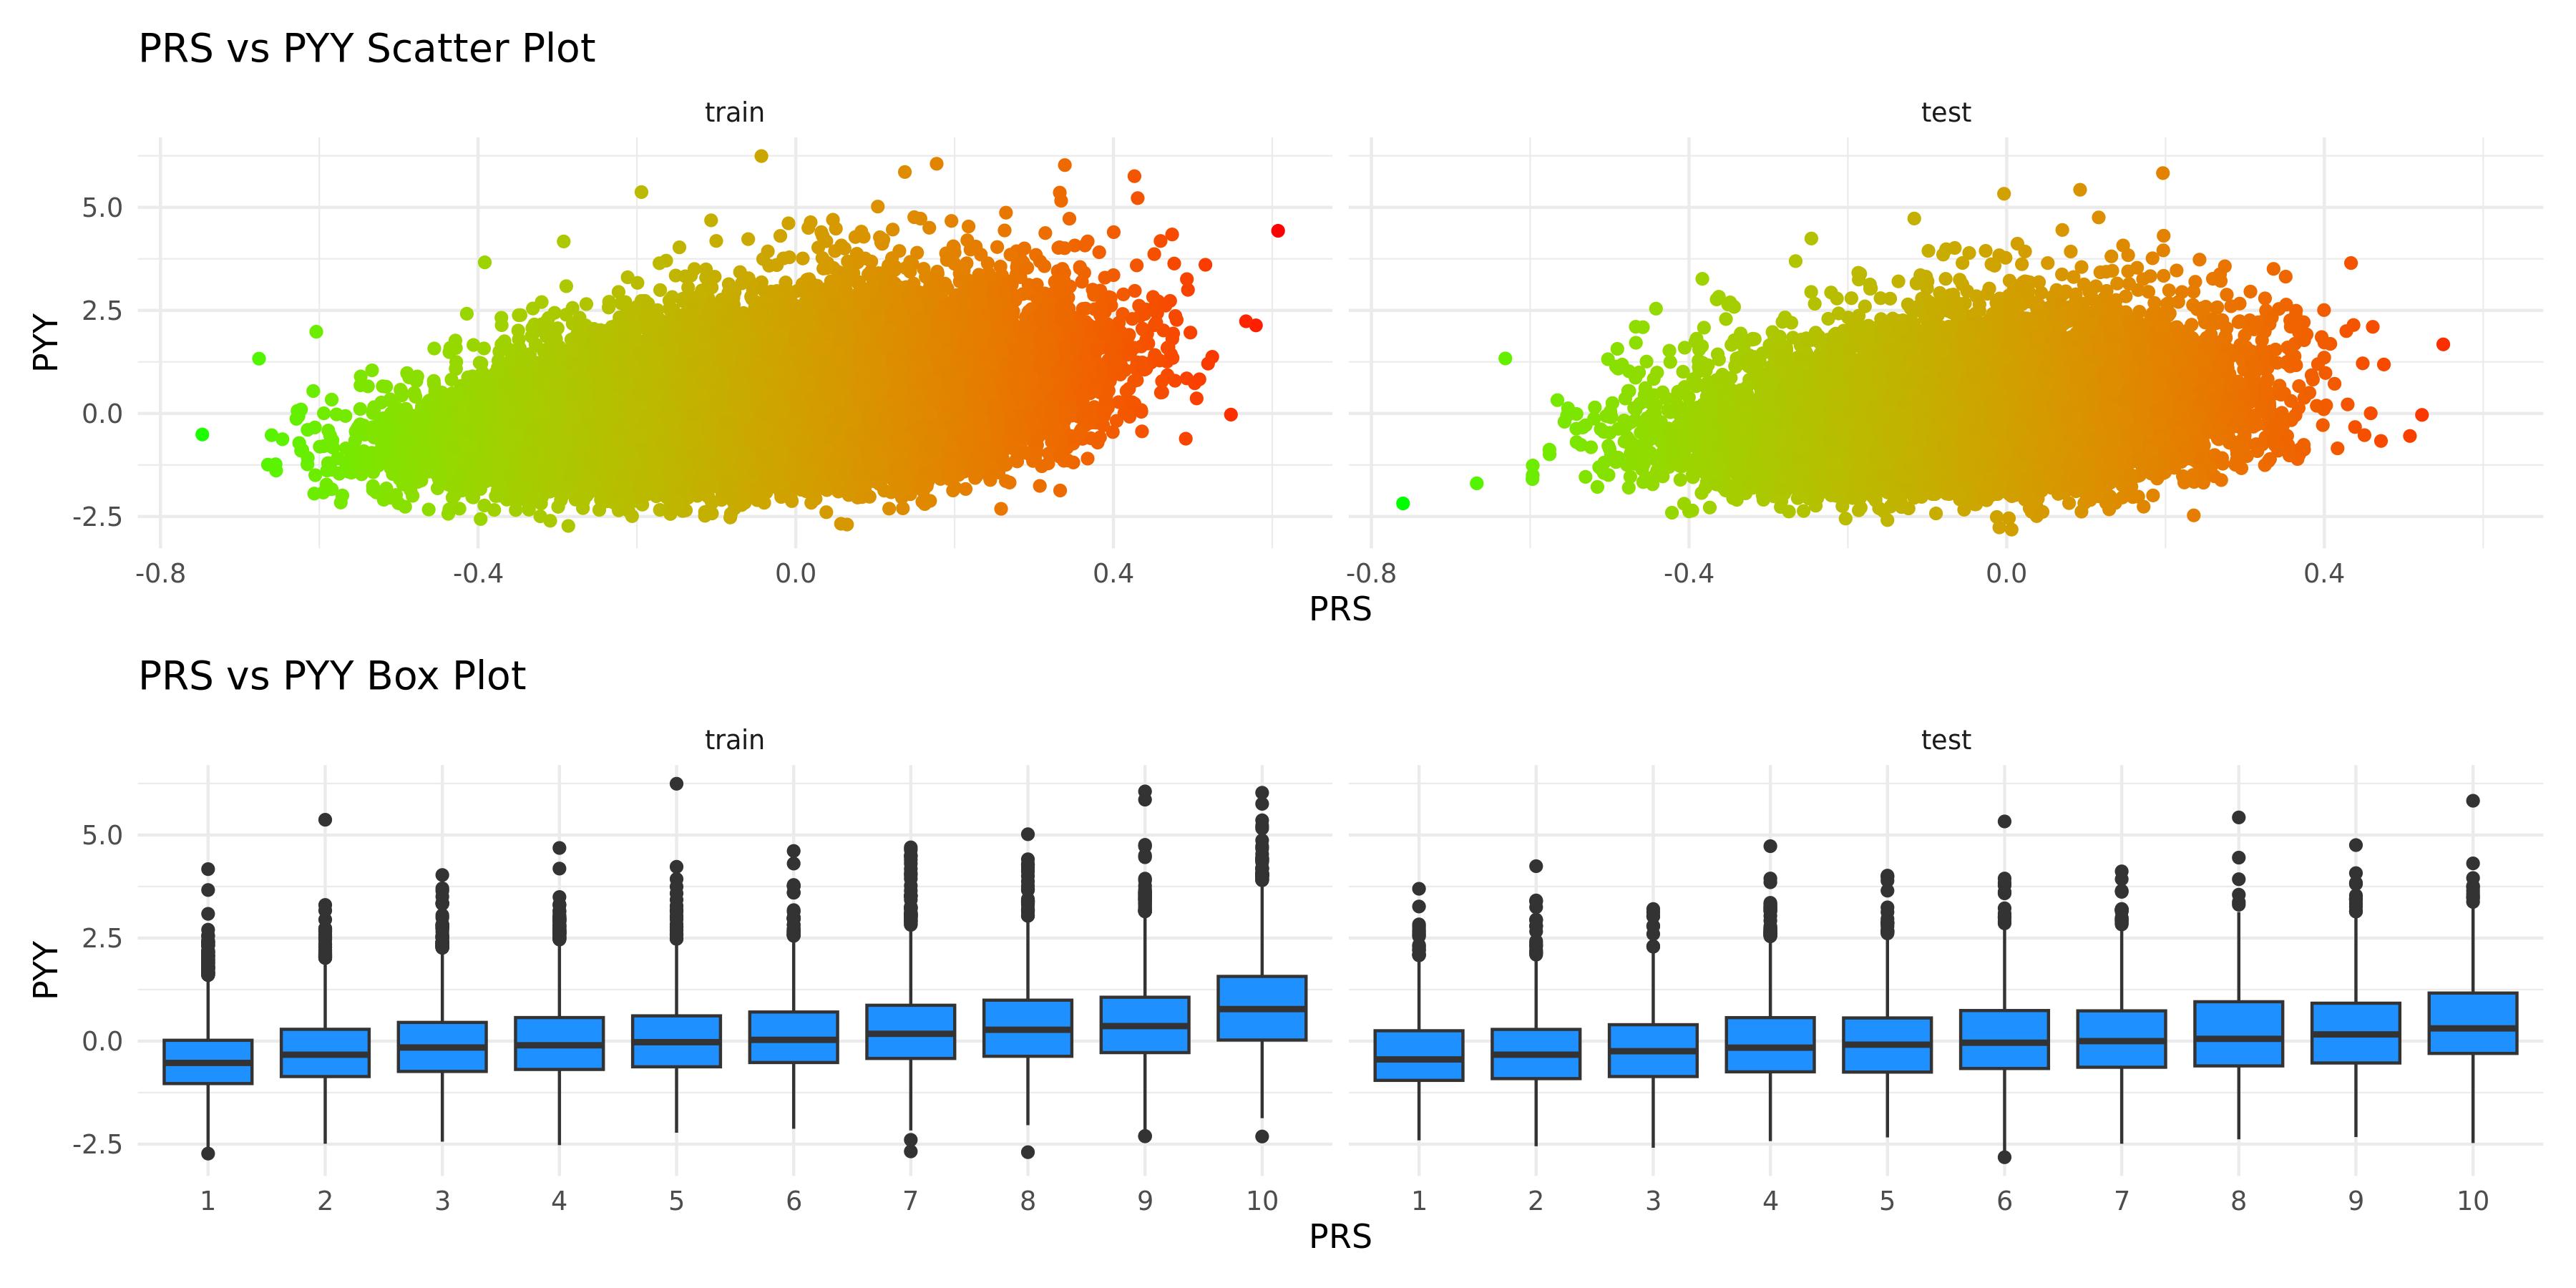
PRS scatter and box plotsenlarge ⤢
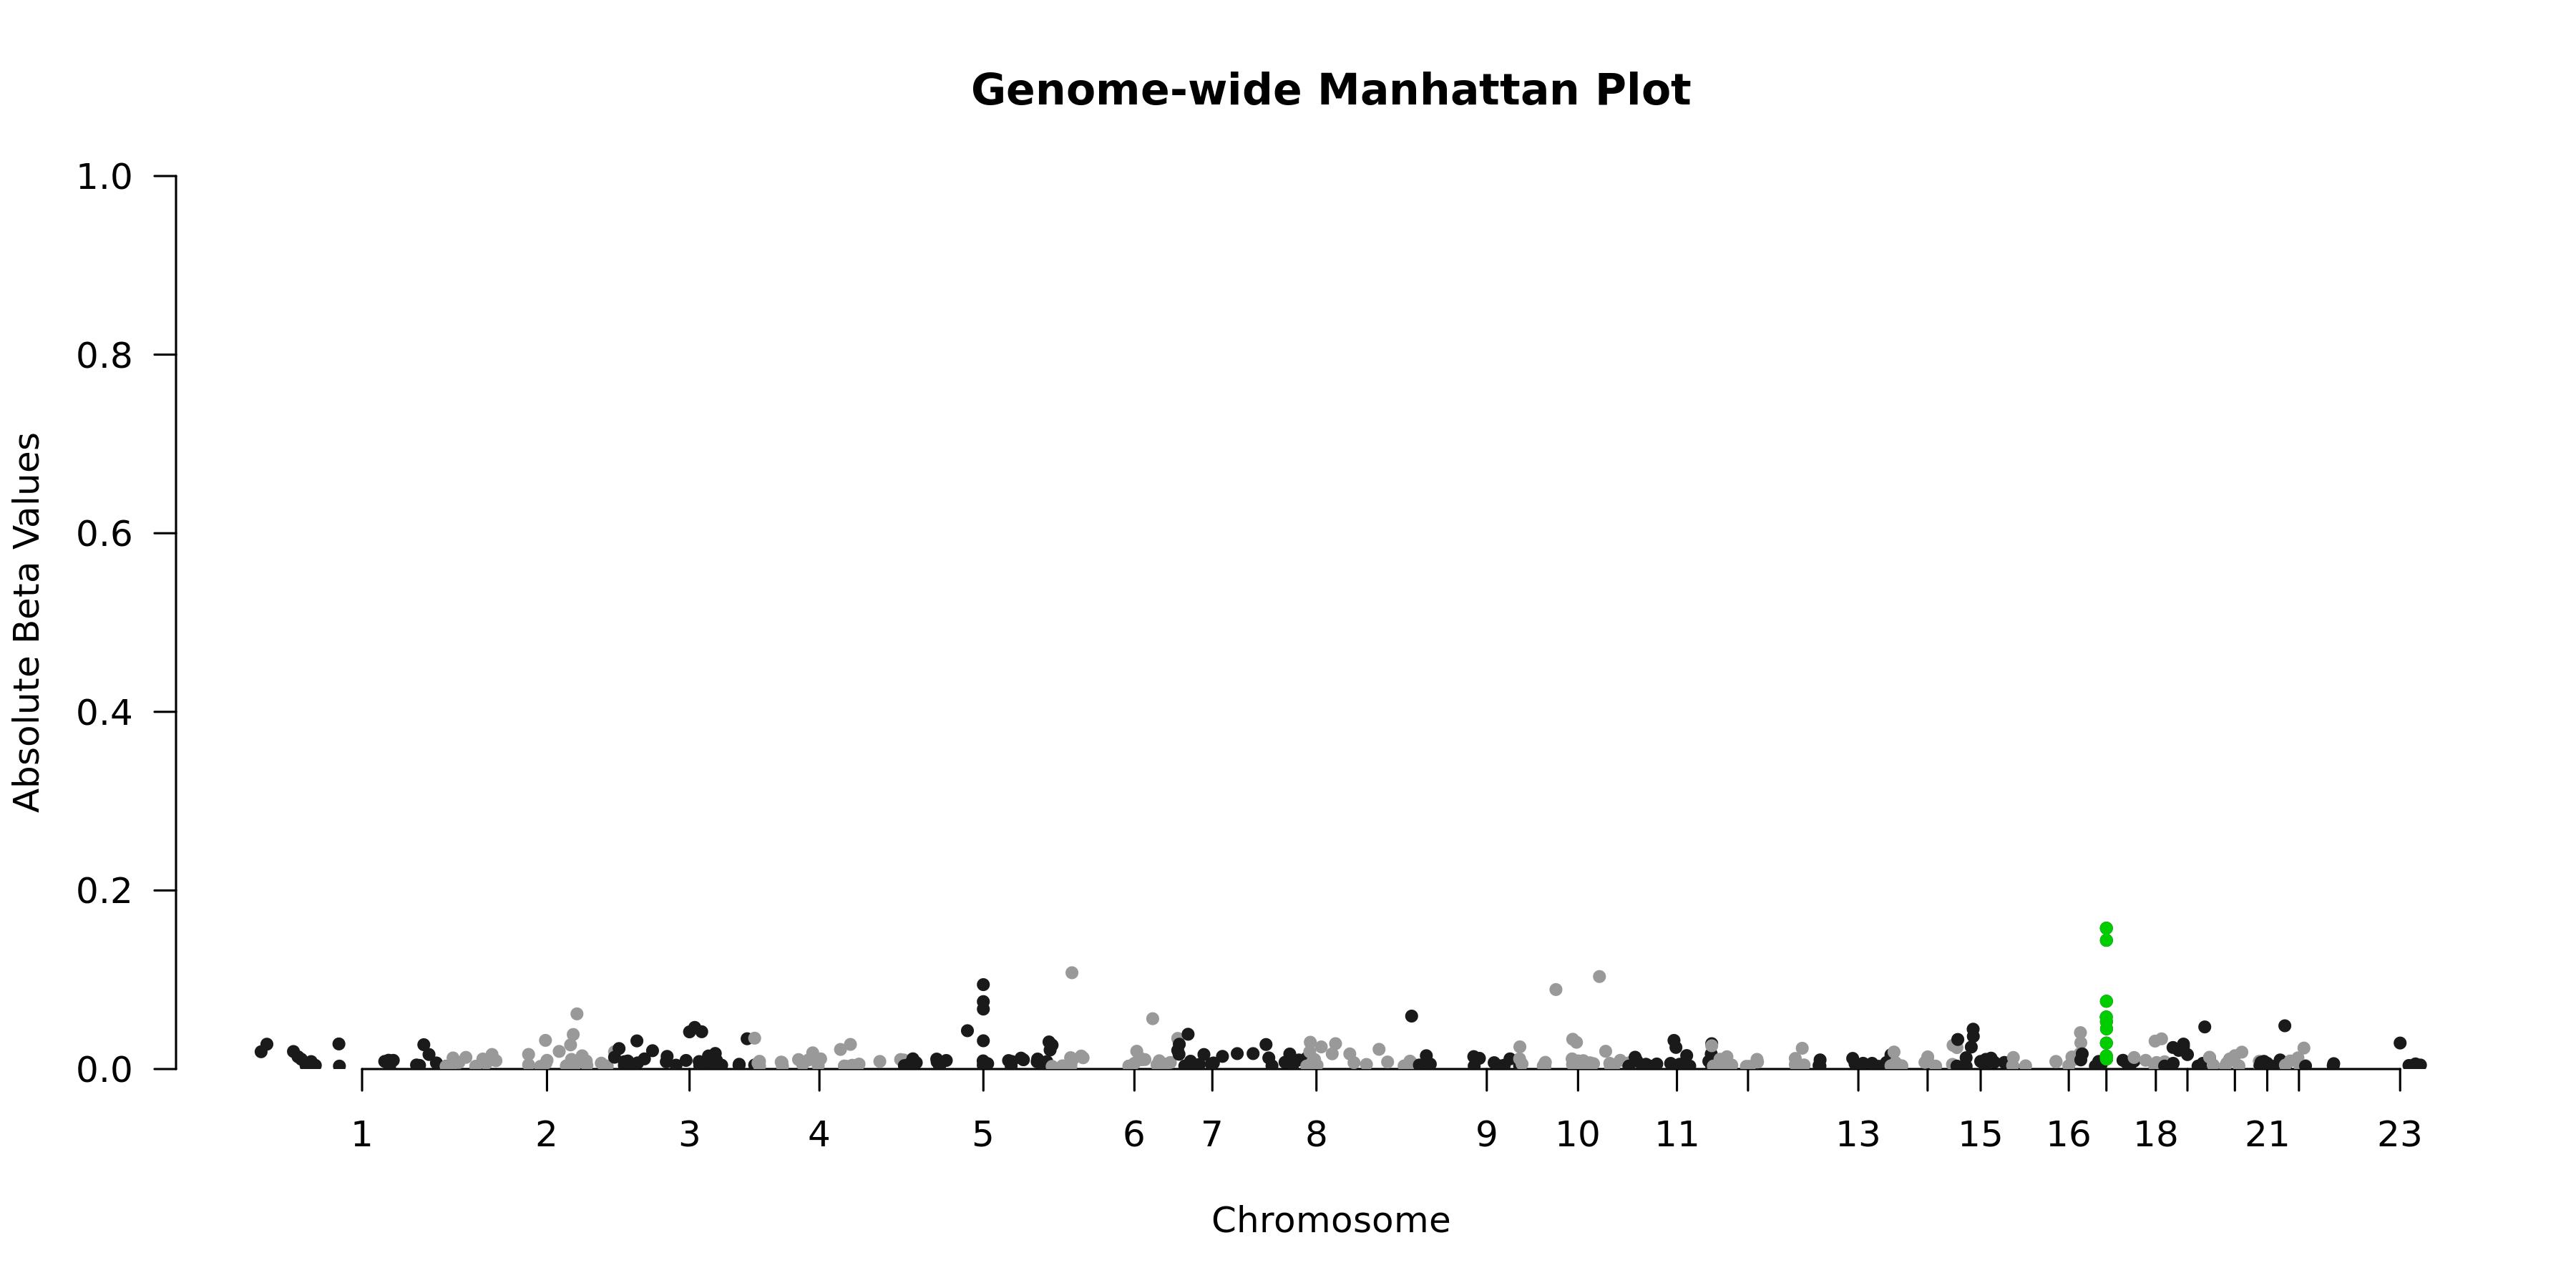
Genome-wide Manhattan Plotenlarge ⤢
Regional Manhattan Plotenlarge ⤢

Model record
Field
Value
Gene
PYY
test_n
10538
sparsity
415
pearson_coefficent
0.293377971736462
SE
0.0104388581098866
P_corr
3.62468704831674e-166
R2 Covariate Model
0.0388
R2 Full Model
0.1216
P
7.6742912924241e-239
P_full
0
n_cis_pqtl
15
max_cis_pqtl
rs151196
rank_max_cis_pqtl
1
mean_pqtl_beta
0.0428880524990765
mean_nopqtl_beta
0.0124953980732285
percentage_pqtl
0.036144578313253
percentage_nopqtl
0.963855421686747
cis and genome-wide metrics
Field
Value
Gene
PYY
test_n_genomewide
10538
sparsity_genomewide
415
pearson_coefficent_genomewide
0.293377971736462
SE_genomewide
0.0104388581098866
P_corr_genomewide
3.62468704831674e-166
R2_covariate_model_genomewide
0.0388040794512091
R2_full_model_genomewide
0.121613707094144
P_genomewide
7.6742912924241e-239
P_full_genomewide
0
n_cis_pqtl
15
max_cis_pqtl
rs151196
rank_max_cis_pqtl
1
mean_pqtl_beta
0.0428880524990765
mean_nopqtl_beta
0.0124953980732285
percentage_pqtl
0.036144578313253
percentage_nopqtl
0.963855421686747
test_n_cis
10538
sparsity_cis
15
pearson_coefficent_cis
0.157111880888272
SE_cis
0.0107837378332093
P_corr_cis
1.66972885197875e-47
R2_covariate_model_cis
0.0388040794512091
R2_full_model_cis
0.063907987224988
P_cis
9.19037551264591e-123
P_full_cis
3.11895026208016e-140