PPP1CC
Olink Explore plasma protein · SNPBoost PRS model
R2 Full Model
0.0397
pearson_coefficent
0.1975
sparsity
168
n_cis_pqtl
2
max_cis_pqtl
rs72650673
Diagnostics
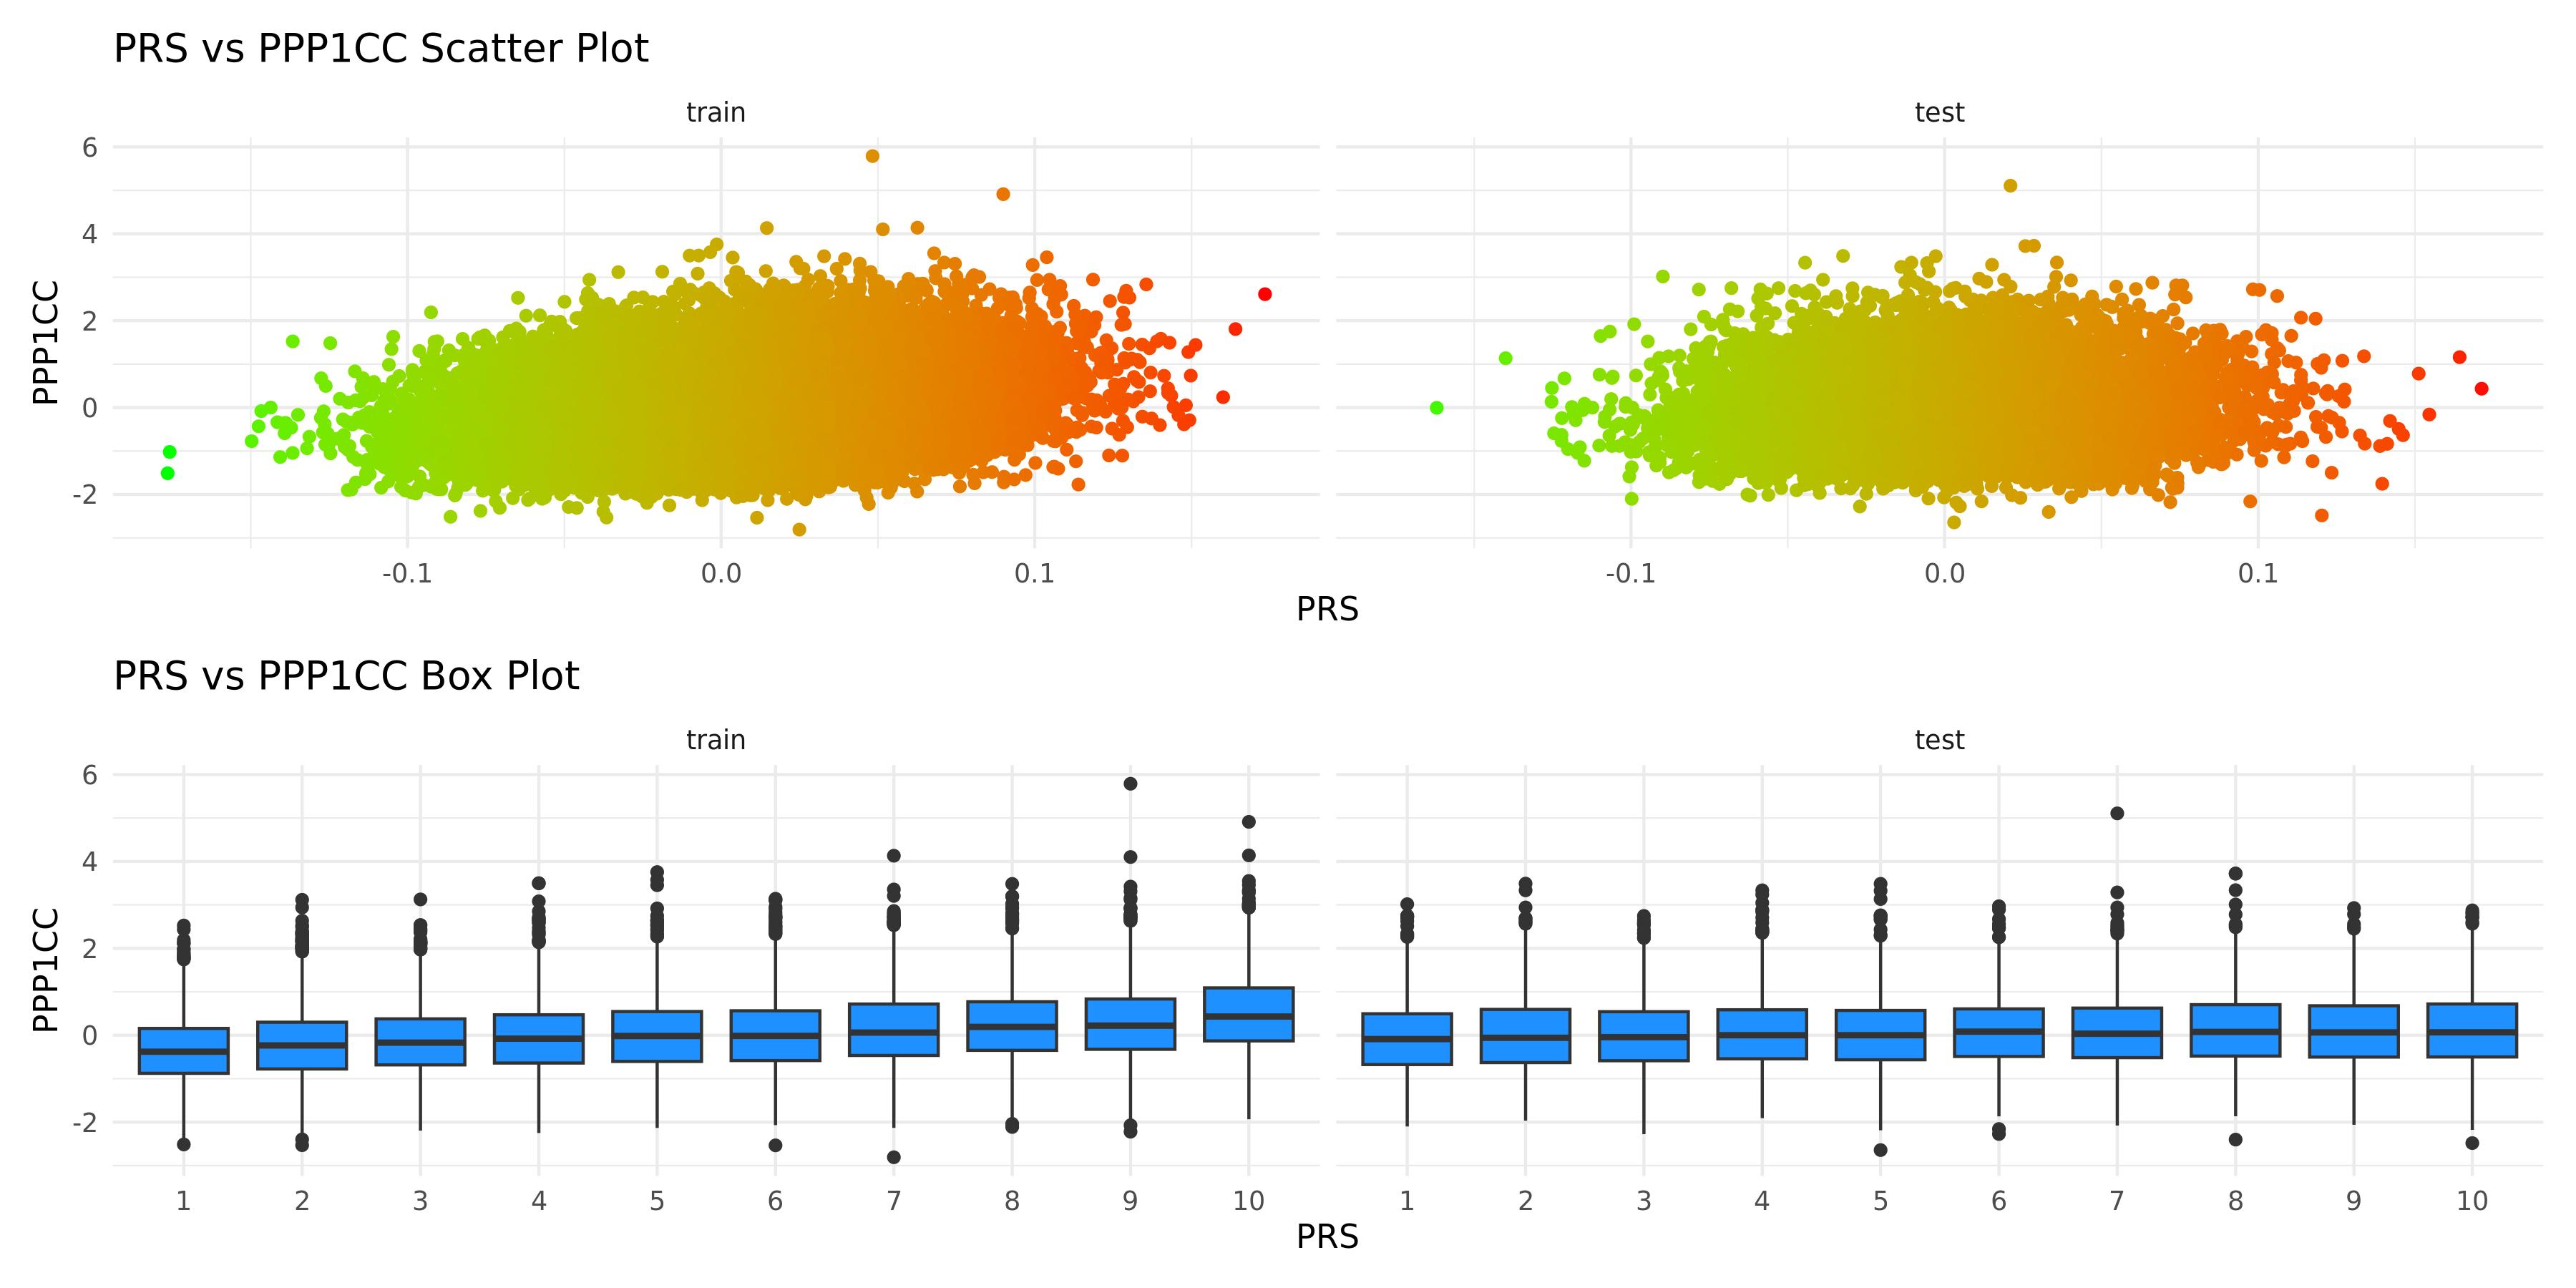
PRS scatter and box plotsenlarge ⤢
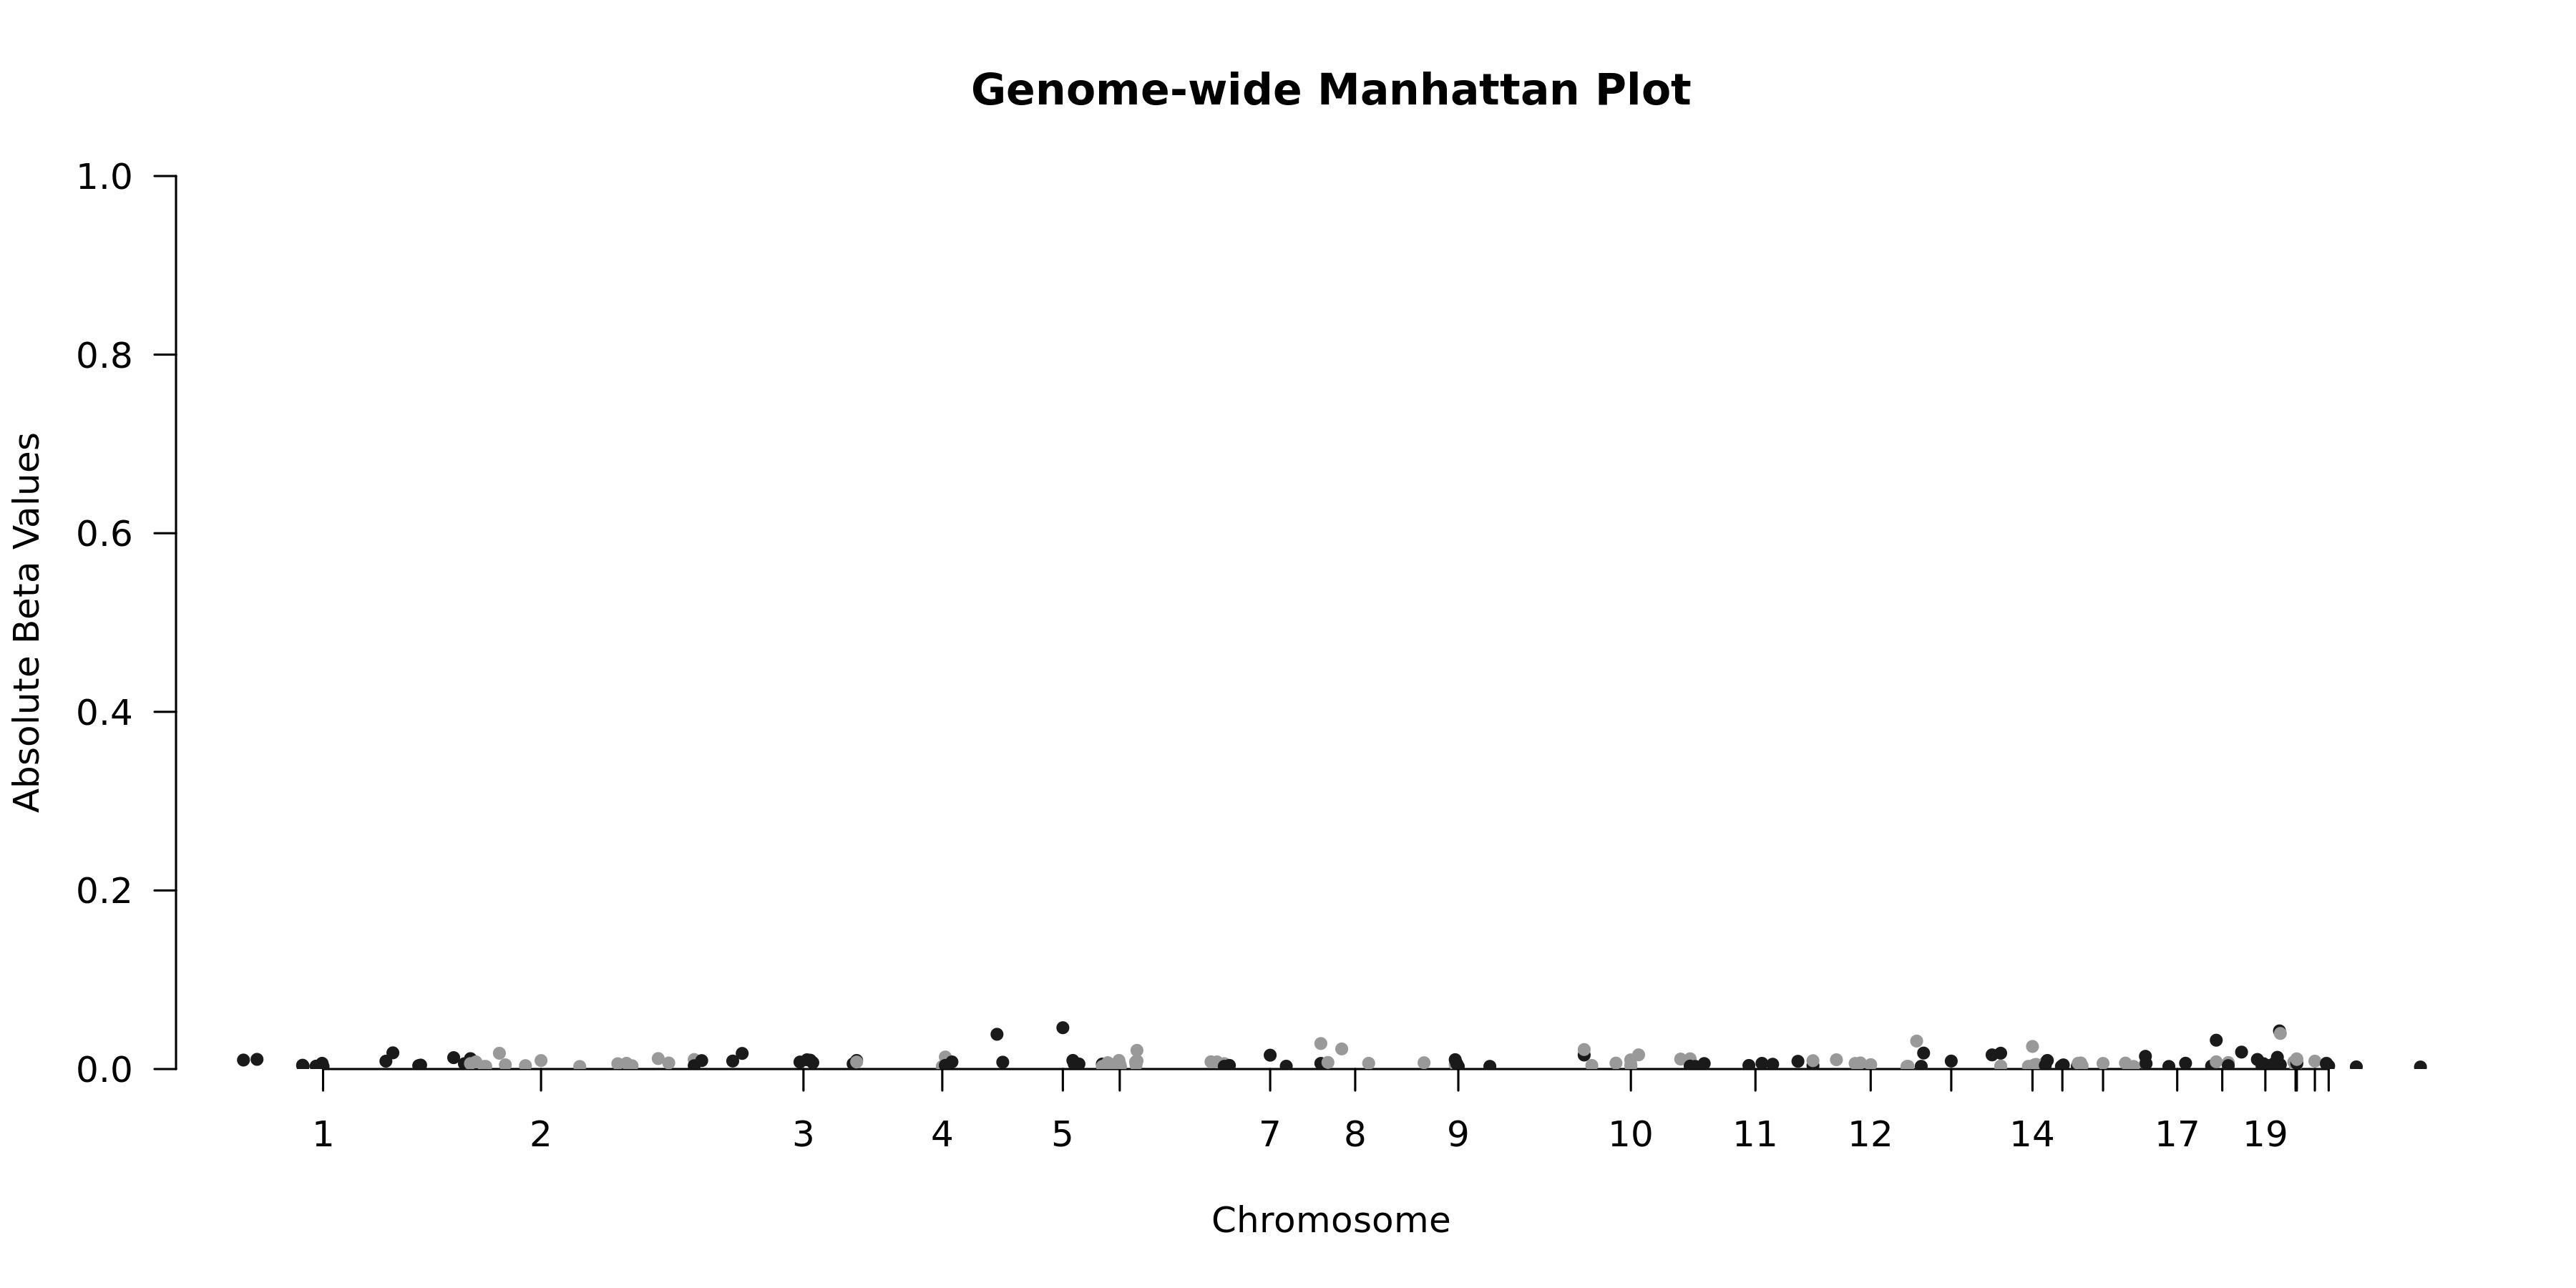
Genome-wide Manhattan Plotenlarge ⤢
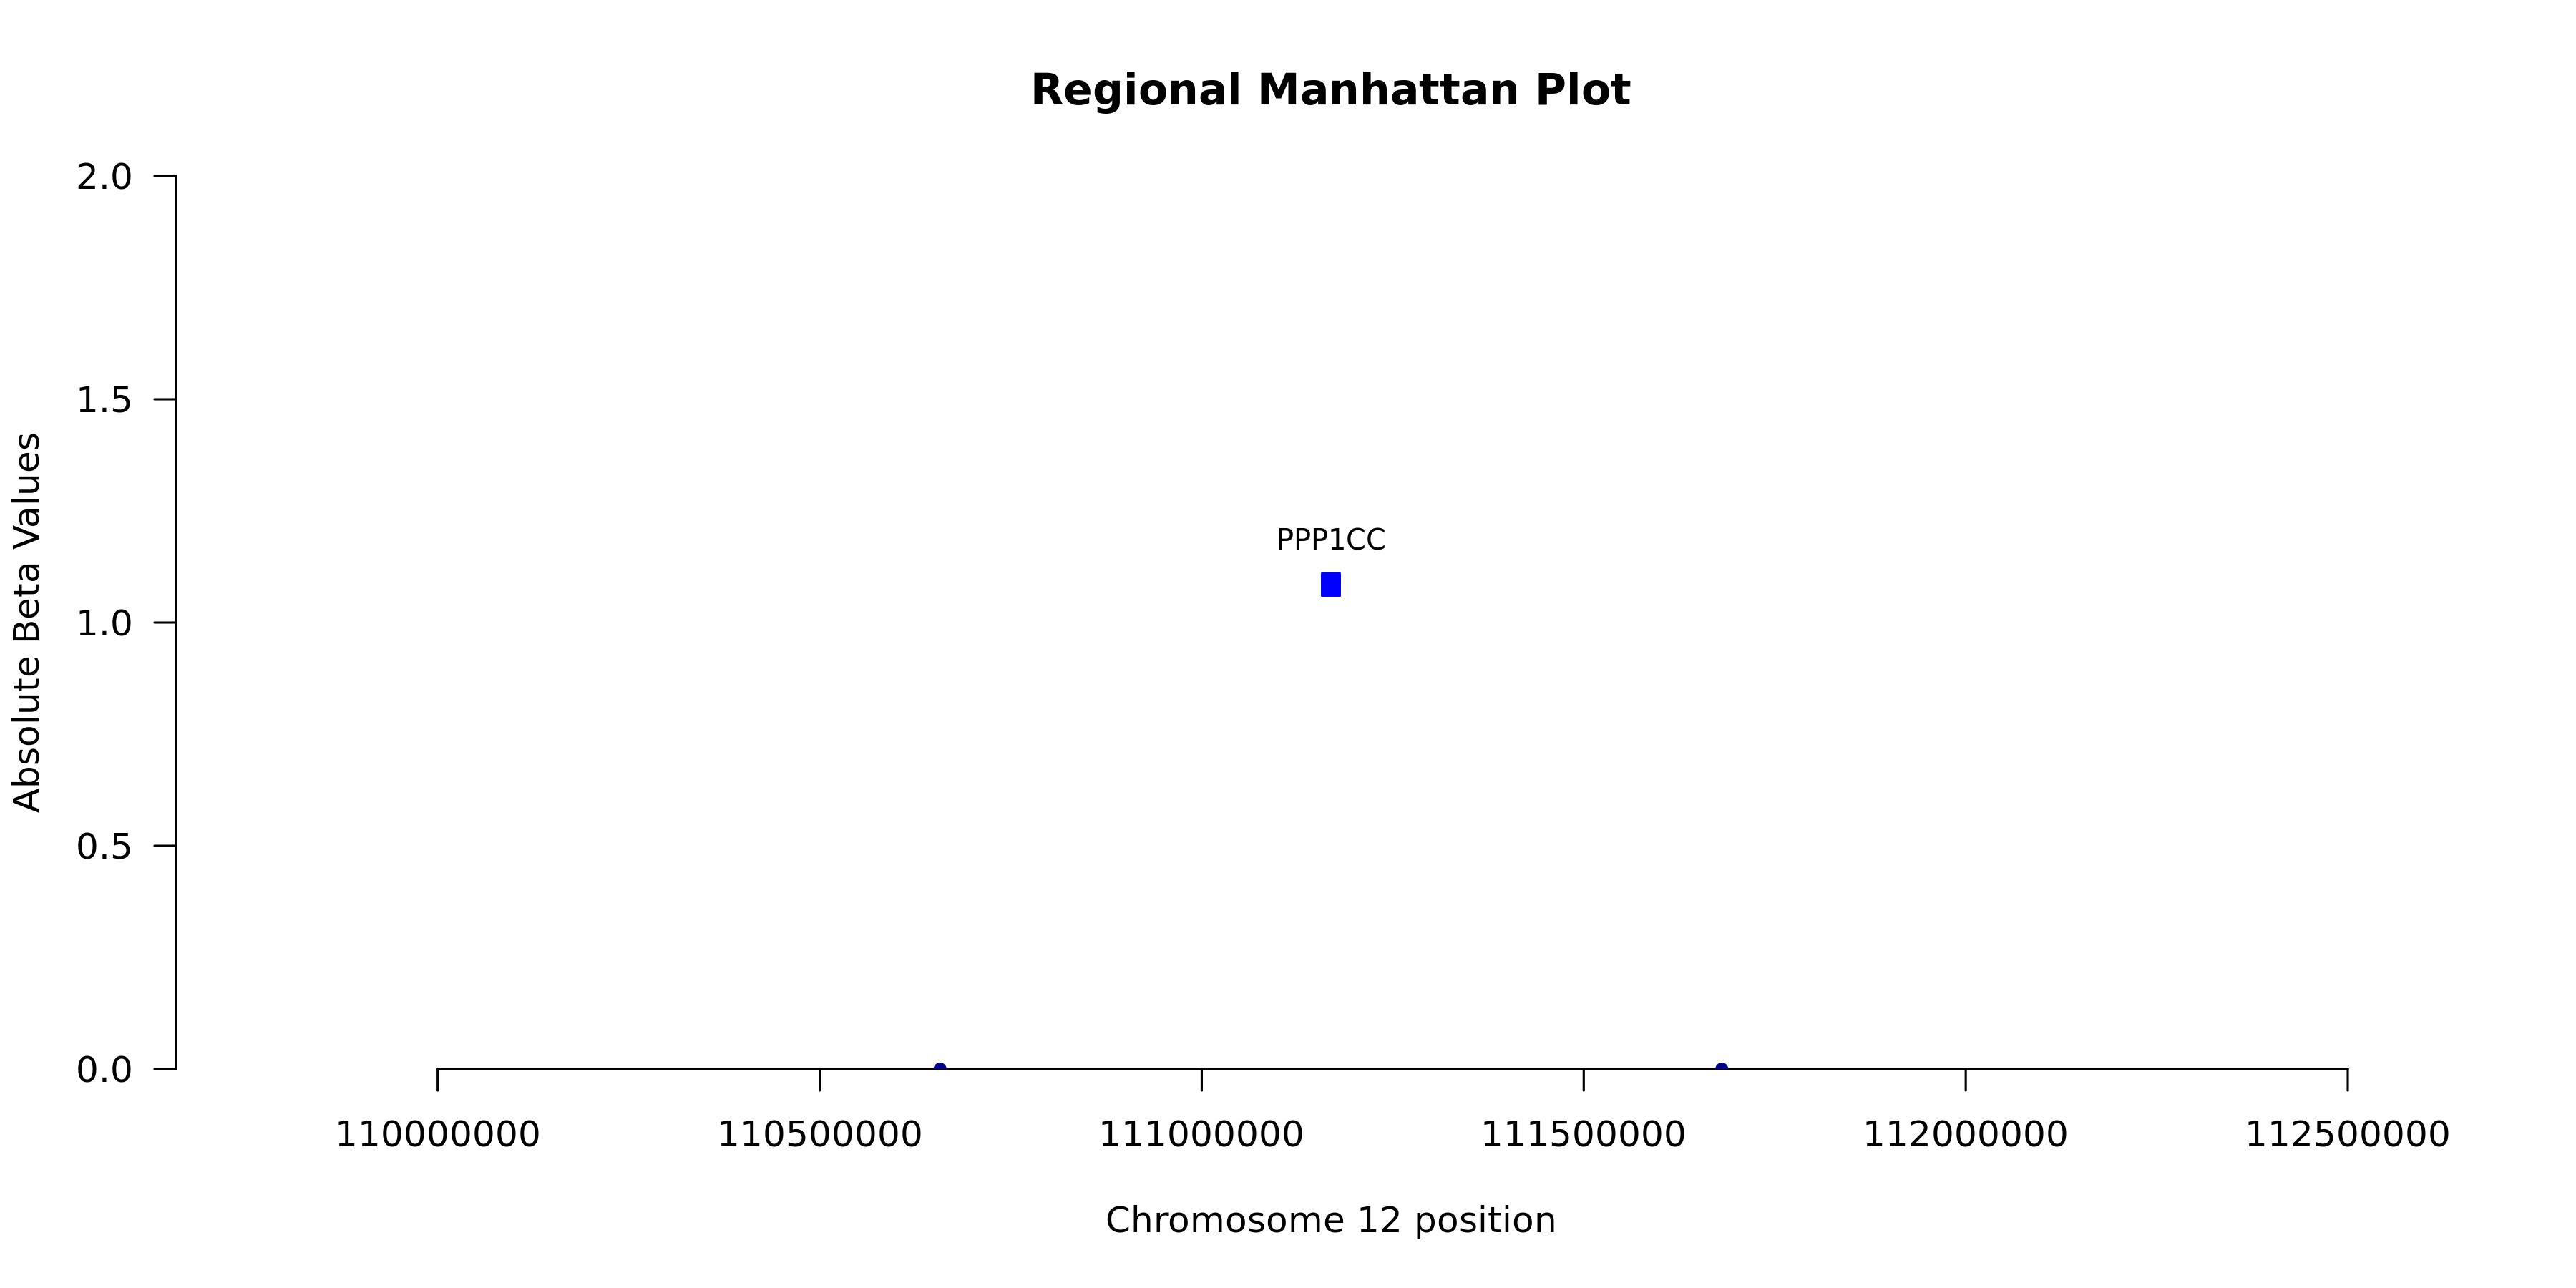
Regional Manhattan Plotenlarge ⤢
Model record
Field
Value
Gene
PPP1CC
test_n
10538
sparsity
168
pearson_coefficent
0.197468091318728
SE
0.0105470594099002
P_corr
1.05449170175321e-76
R2 Covariate Model
0.0021
R2 Full Model
0.0397
P
2.95537626523246e-78
P_full
3.8128005237817e-207
n_cis_pqtl
2
max_cis_pqtl
rs72650673
rank_max_cis_pqtl
6
mean_pqtl_beta
0.0172046041212334
mean_nopqtl_beta
0.0083930375362051
percentage_pqtl
0.0119047619047619
percentage_nopqtl
0.988095238095238
cis and genome-wide metrics
Field
Value
Gene
PPP1CC
test_n_genomewide
10538
sparsity_genomewide
168
pearson_coefficent_genomewide
0.197468091318728
SE_genomewide
0.0105470594099002
P_corr_genomewide
1.05449170175321e-76
R2_covariate_model_genomewide
0.00205420994706829
R2_full_model_genomewide
0.0397278245249254
P_genomewide
2.95537626523246e-78
P_full_genomewide
3.8128005237817e-207
n_cis_pqtl
2
max_cis_pqtl
rs72650673
rank_max_cis_pqtl
6
mean_pqtl_beta
0.0172046041212334
mean_nopqtl_beta
0.0083930375362051
percentage_pqtl
0.0119047619047619
percentage_nopqtl
0.988095238095238
test_n_cis
10538
sparsity_cis
2
pearson_coefficent_cis
0.0216104876335211
SE_cis
0.0107563971432236
P_corr_cis
0.0445594515232434
R2_covariate_model_cis
0.00205420994706829
R2_full_model_cis
0.00247032791148594
P_cis
2.36662861753143e-06
P_full_cis
7.02136811682716e-05