PAMR1
Olink Explore plasma protein · SNPBoost PRS model
R2 Full Model
0.2338
pearson_coefficent
0.4459
sparsity
695
n_cis_pqtl
57
max_cis_pqtl
rs61736408
Diagnostics
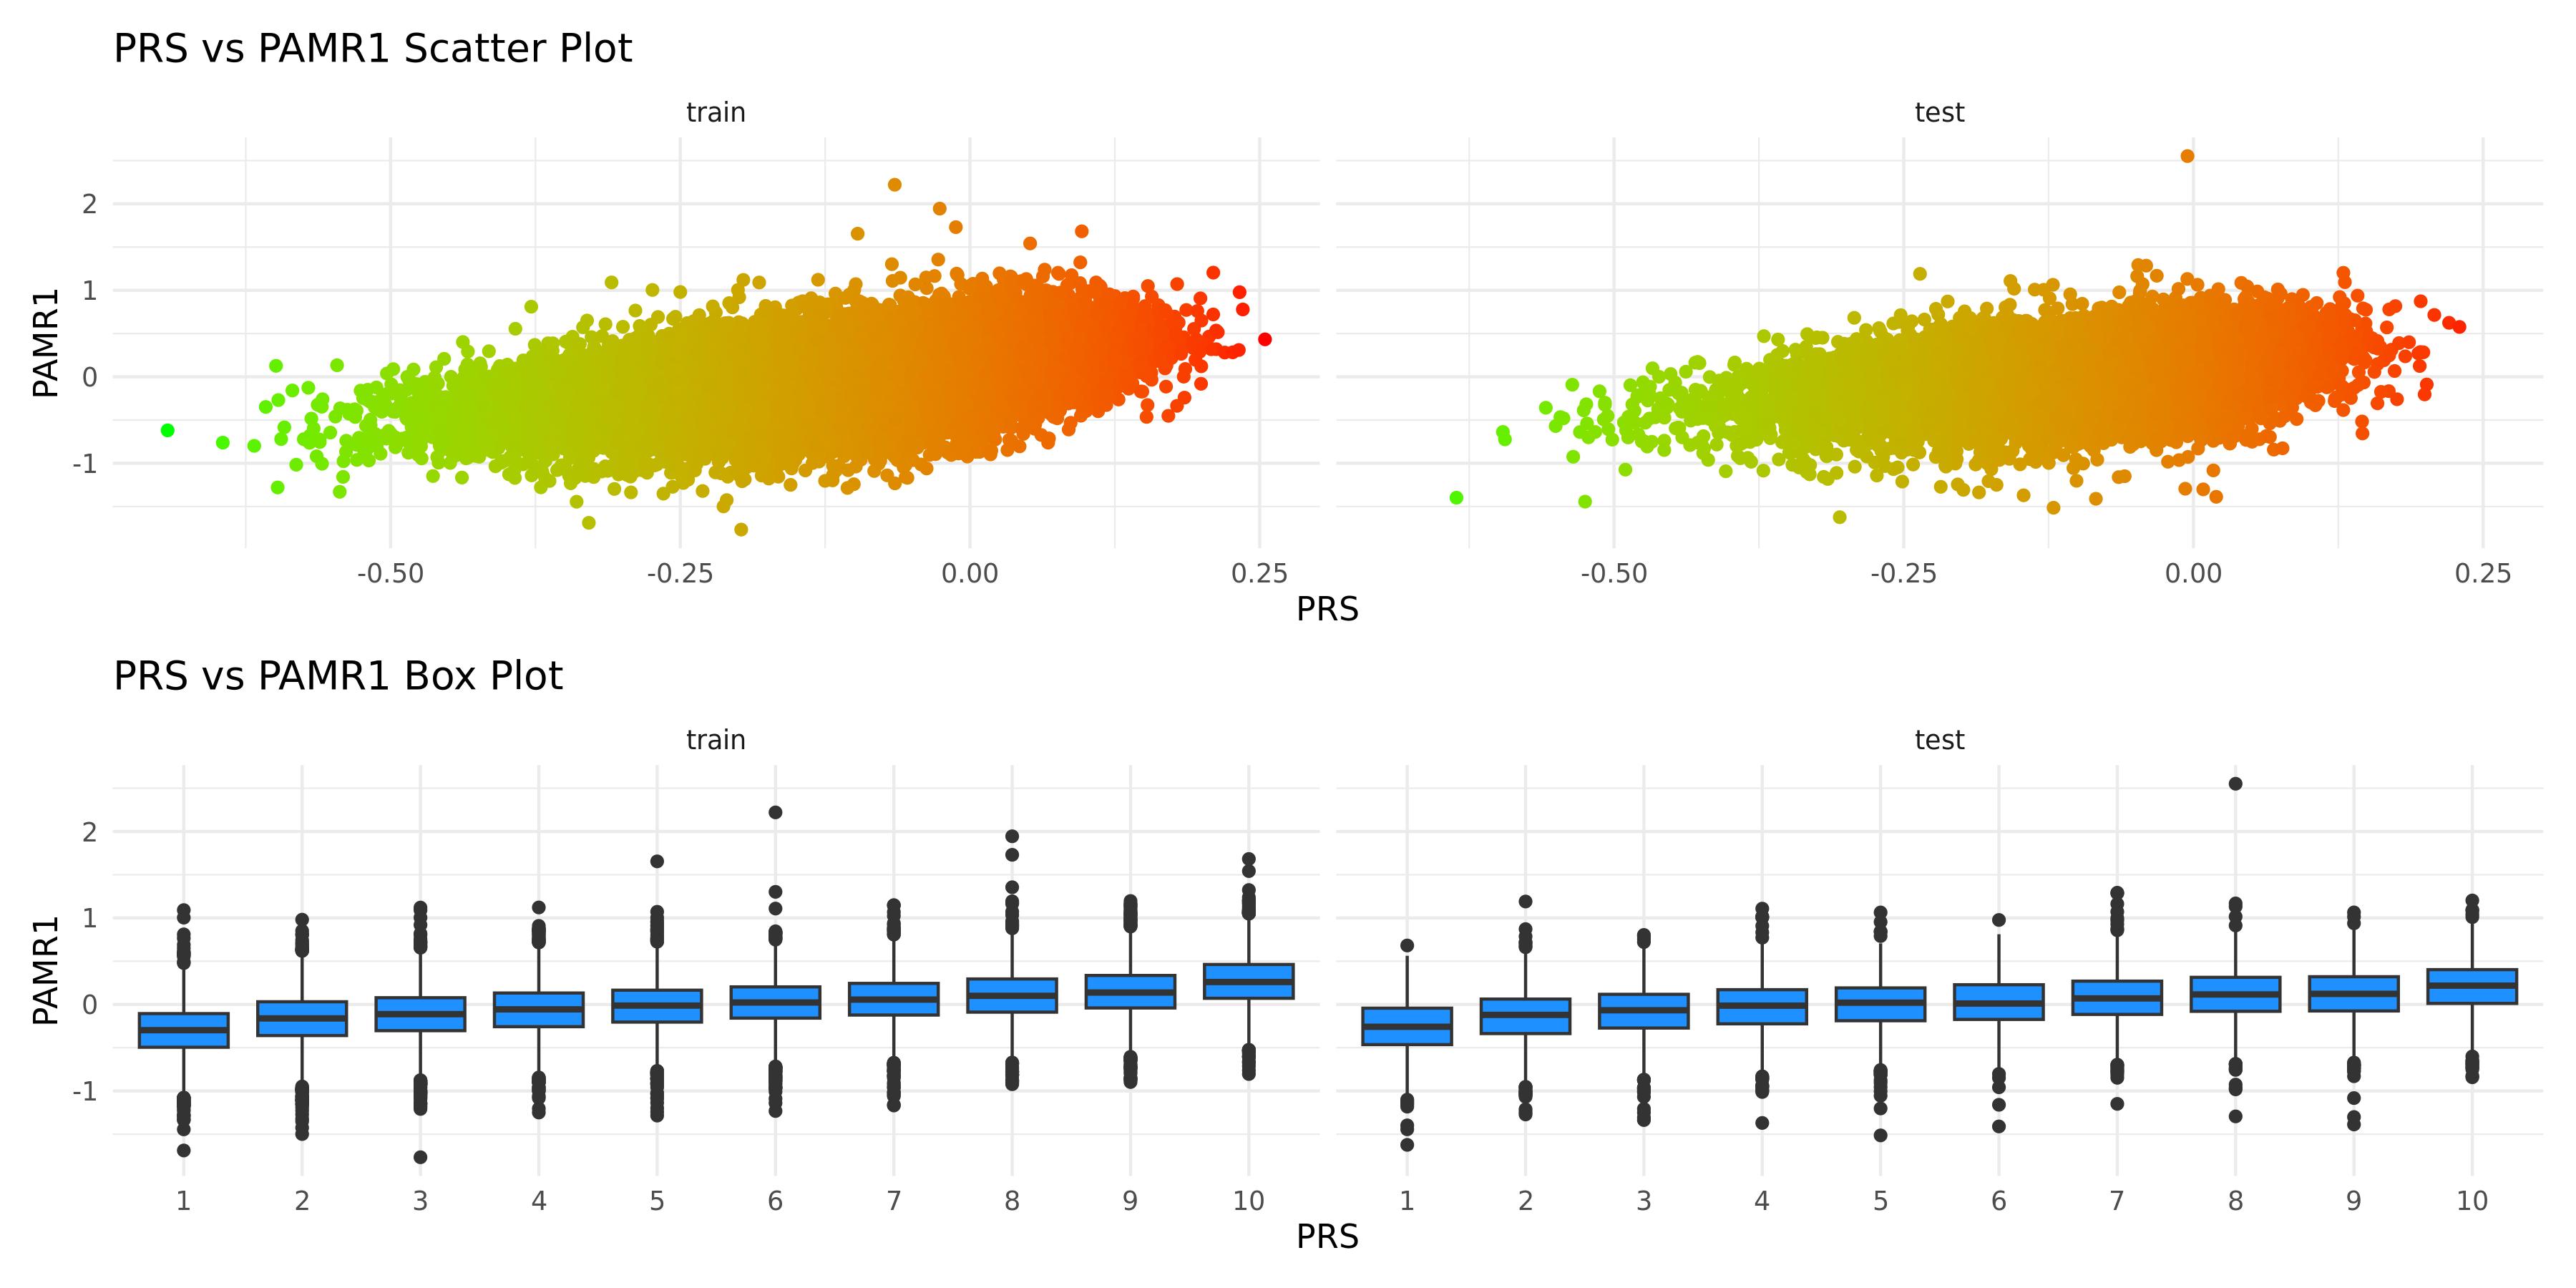
PRS scatter and box plotsenlarge ⤢
Genome-wide Manhattan Plotenlarge ⤢

Regional Manhattan Plotenlarge ⤢

Model record
Field
Value
Gene
PAMR1
test_n
10538
sparsity
695
pearson_coefficent
0.445901915764727
SE
0.00883797081566653
P_corr
0
R2 Covariate Model
0.0365
R2 Full Model
0.2338
P
0
P_full
0
n_cis_pqtl
57
max_cis_pqtl
rs61736408
rank_max_cis_pqtl
1
mean_pqtl_beta
0.0117753807136736
mean_nopqtl_beta
0.00326373101004708
percentage_pqtl
0.0820143884892086
percentage_nopqtl
0.917985611510791
cis and genome-wide metrics
Field
Value
Gene
PAMR1
test_n_genomewide
10538
sparsity_genomewide
695
pearson_coefficent_genomewide
0.445901915764727
SE_genomewide
0.00883797081566653
P_corr_genomewide
0
R2_covariate_model_genomewide
0.0365128942526536
R2_full_model_genomewide
0.233798602980444
P_genomewide
0
P_full_genomewide
0
n_cis_pqtl
57
max_cis_pqtl
rs61736408
rank_max_cis_pqtl
1
mean_pqtl_beta
0.0117753807136736
mean_nopqtl_beta
0.00326373101004708
percentage_pqtl
0.0820143884892086
percentage_nopqtl
0.917985611510791
test_n_cis
10538
sparsity_cis
57
pearson_coefficent_cis
0.358564406917669
SE_cis
0.00921735821760385
P_corr_cis
1.44901001844685e-308
R2_covariate_model_cis
0.0365128942526536
R2_full_model_cis
0.166983259959481
P_cis
0
P_full_cis
0