NEK7
Olink Explore plasma protein · SNPBoost PRS model
R2 Full Model
0.0041
pearson_coefficent
0.0631
sparsity
24
n_cis_pqtl
1
max_cis_pqtl
rs2786563
Diagnostics
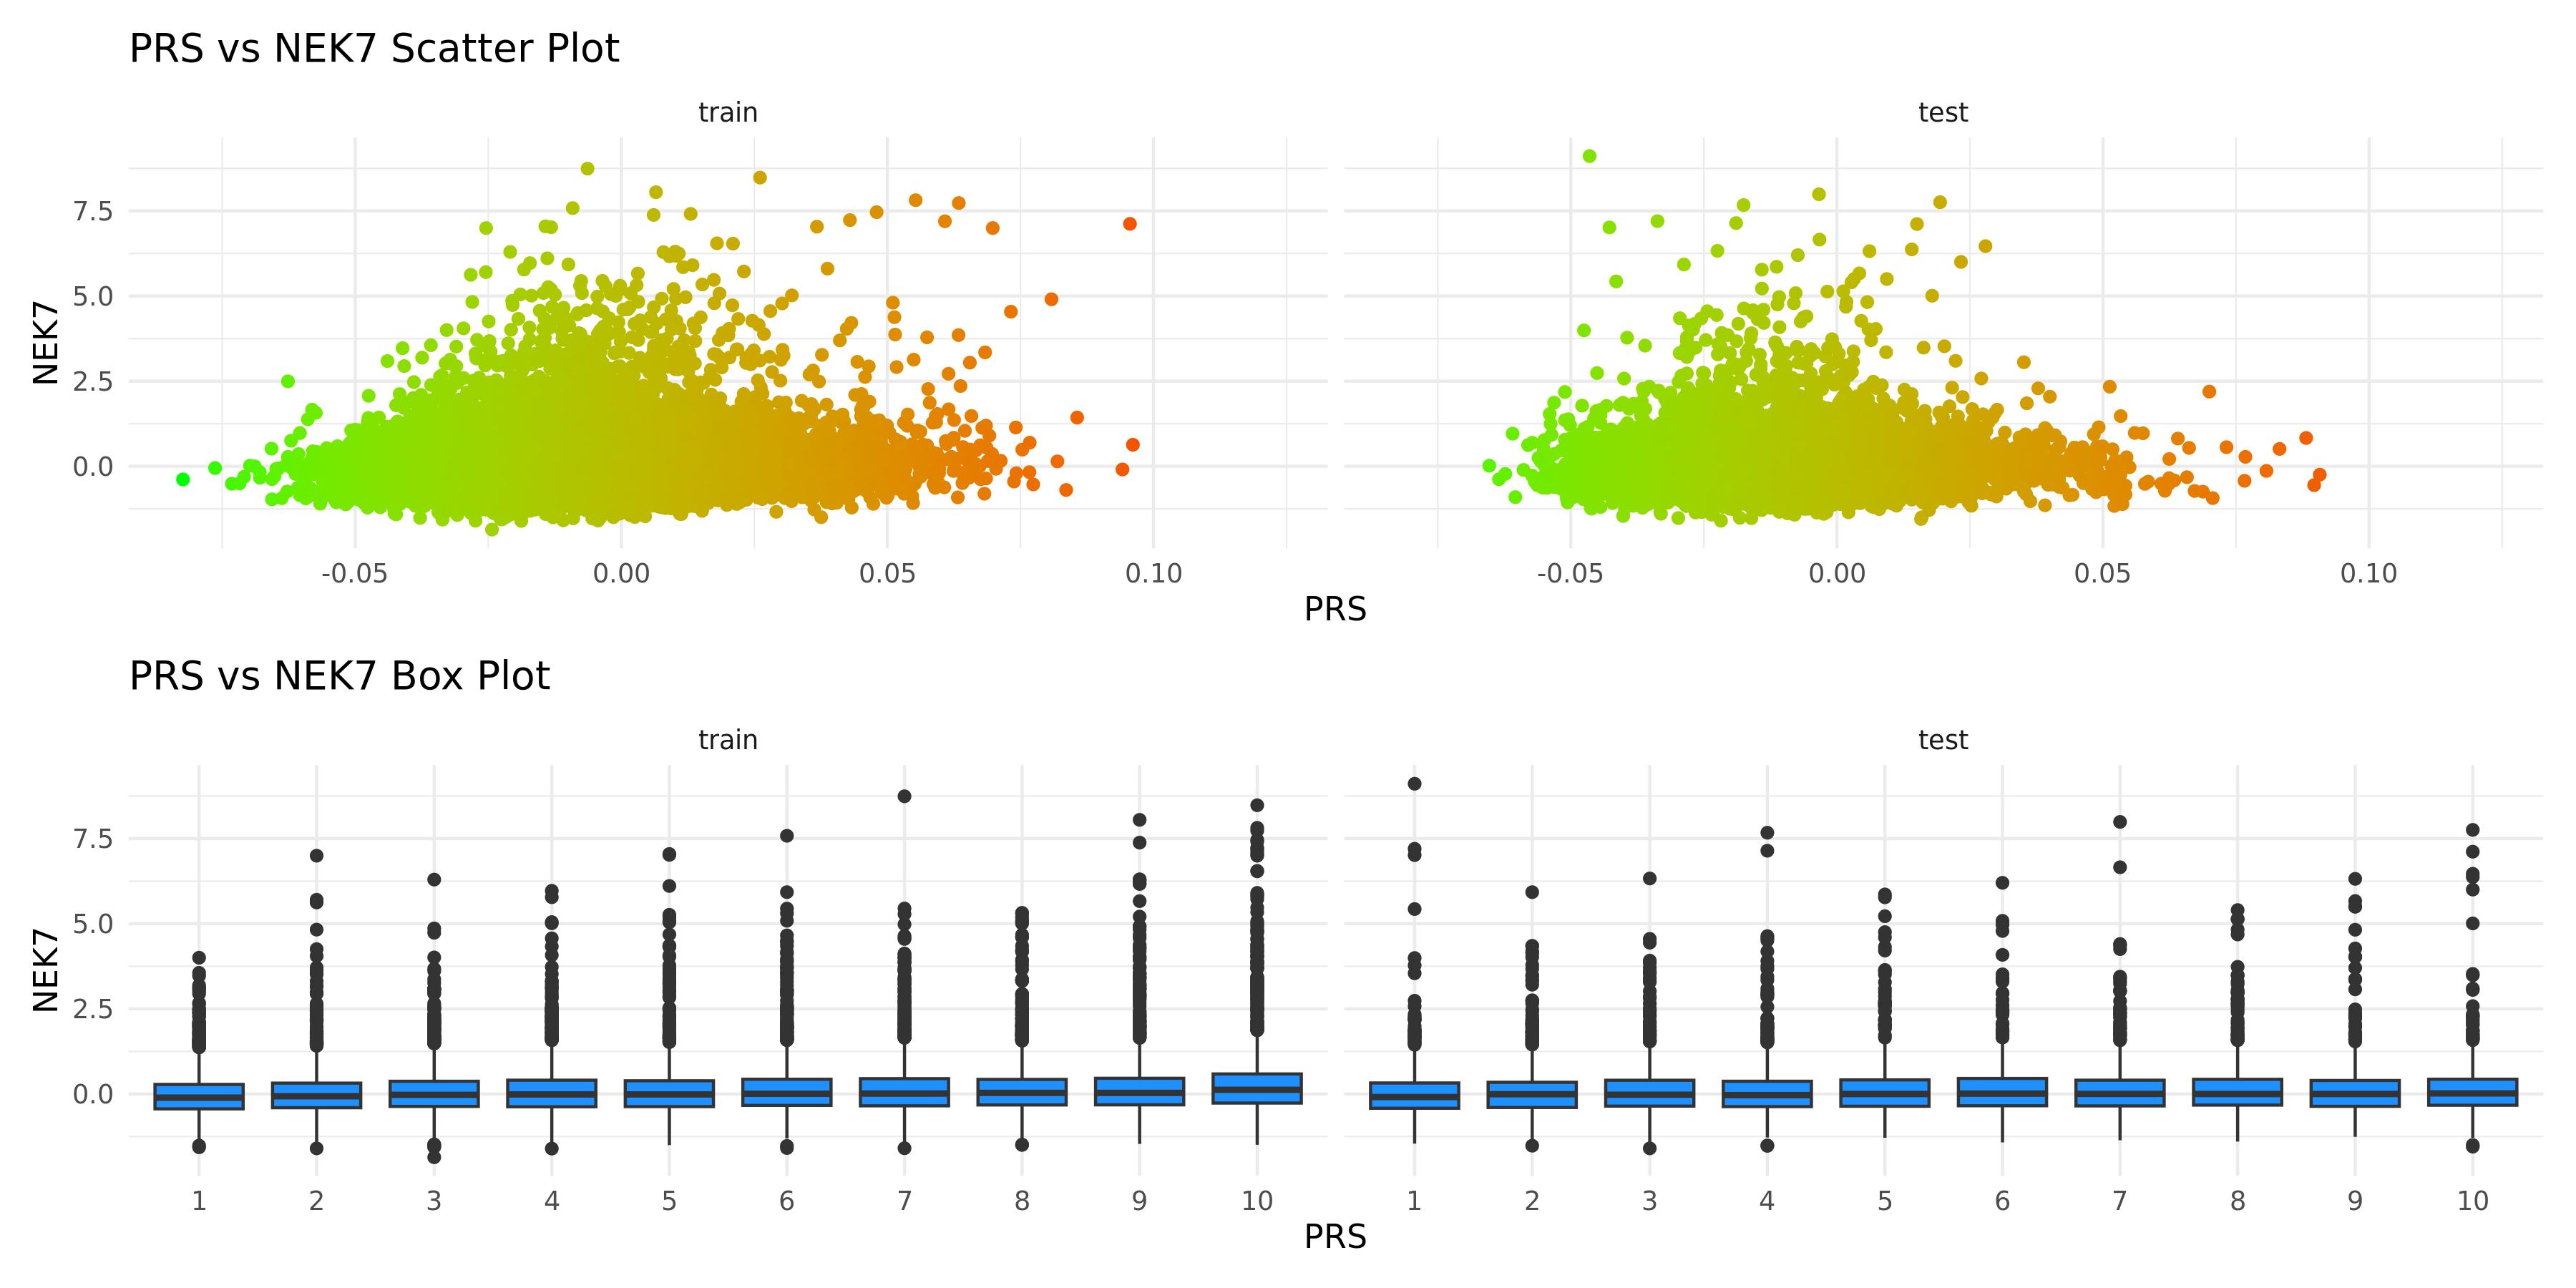
PRS scatter and box plotsenlarge ⤢
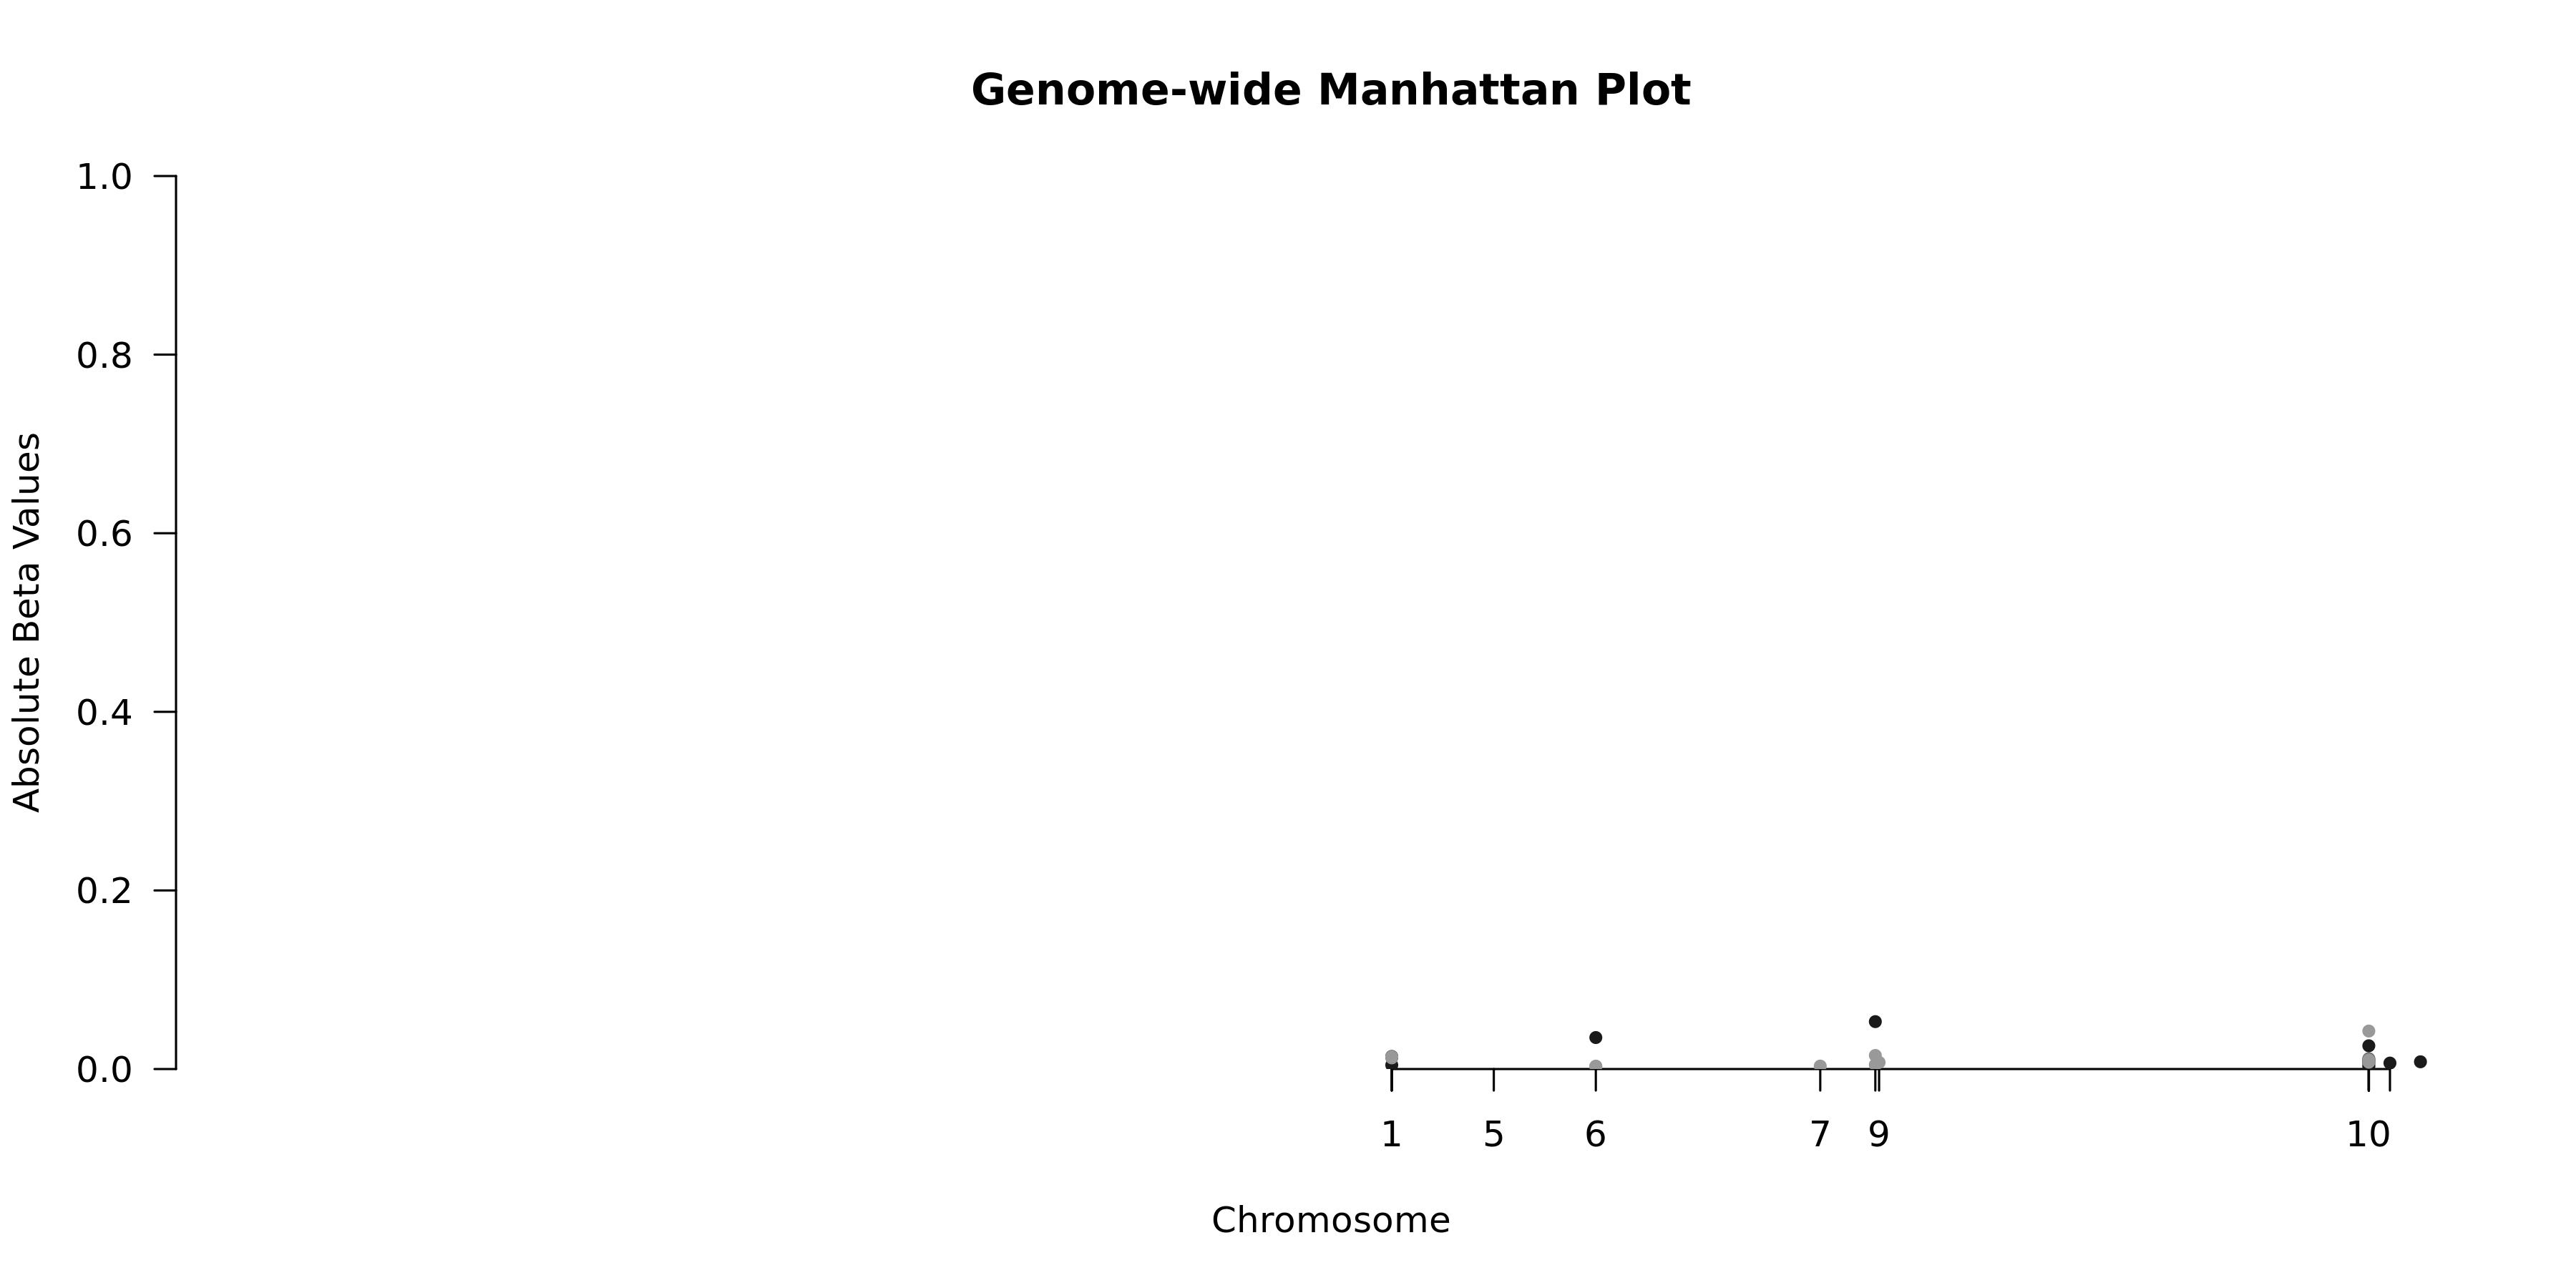
Genome-wide Manhattan Plotenlarge ⤢
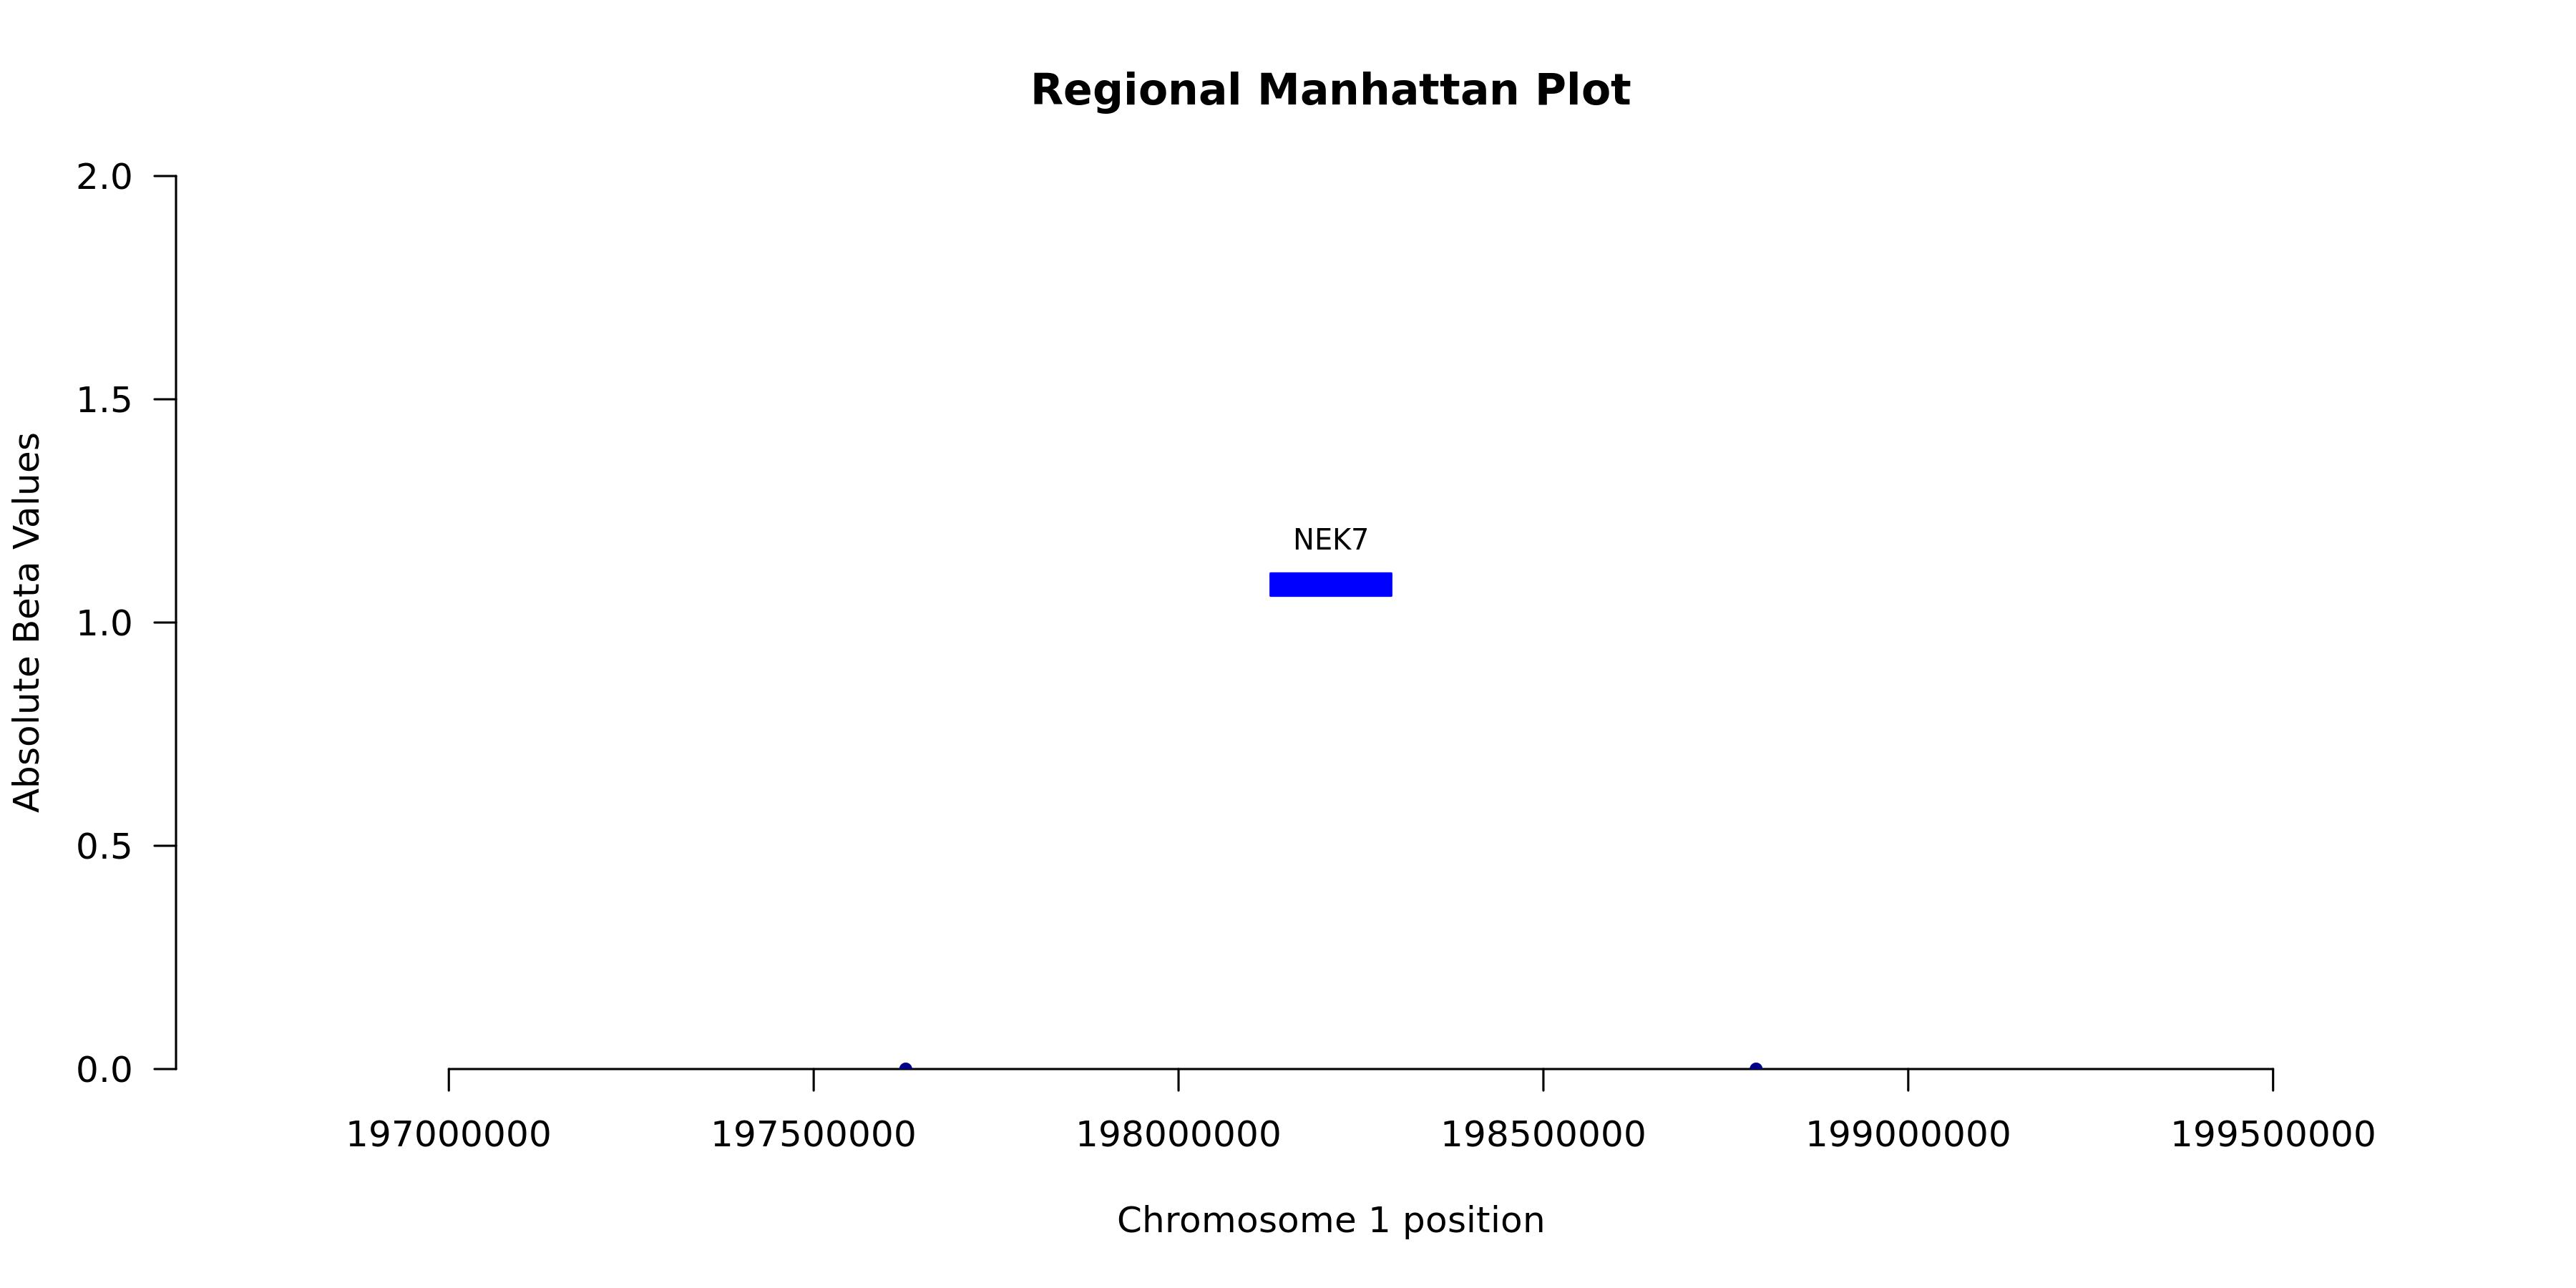
Regional Manhattan Plotenlarge ⤢
Model record
Field
Value
Gene
NEK7
test_n
10538
sparsity
24
pearson_coefficent
0.0630631664318549
SE
0.0108128550845365
P_corr
5.66833270179344e-09
R2 Covariate Model
0.001
R2 Full Model
0.0041
P
9.56306375364161e-11
P_full
4.34330417963283e-42
n_cis_pqtl
1
max_cis_pqtl
rs2786563
rank_max_cis_pqtl
19
mean_pqtl_beta
0.00444182829091769
mean_nopqtl_beta
0.0134963494293791
percentage_pqtl
0.0416666666666667
percentage_nopqtl
0.958333333333333
cis and genome-wide metrics
Field
Value
Gene
NEK7
test_n_genomewide
10538
sparsity_genomewide
24
pearson_coefficent_genomewide
0.0630631664318549
SE_genomewide
0.0108128550845365
P_corr_genomewide
5.66833270179344e-09
R2_covariate_model_genomewide
0.00096930737623413
R2_full_model_genomewide
0.00412657132733696
P_genomewide
9.56306375364161e-11
P_full_genomewide
4.34330417963283e-42
n_cis_pqtl
1
max_cis_pqtl
rs2786563
rank_max_cis_pqtl
19
mean_pqtl_beta
0.00444182829091769
mean_nopqtl_beta
0.0134963494293791
percentage_pqtl
0.0416666666666667
percentage_nopqtl
0.958333333333333
test_n_cis
10538
sparsity_cis
1
pearson_coefficent_cis
0.00542637298598931
SE_cis
0.0108342610781297
P_corr_cis
0.616487468547912
R2_covariate_model_cis
0.00096930737623413
R2_full_model_cis
0.000794561208812494
P_cis
0.001758513295891
P_full_cis
0.000337776052316627