MTUS1
Olink Explore plasma protein · SNPBoost PRS model
R2 Full Model
0.0458
pearson_coefficent
0.1618
sparsity
93
n_cis_pqtl
13
max_cis_pqtl
rs61733705
Diagnostics
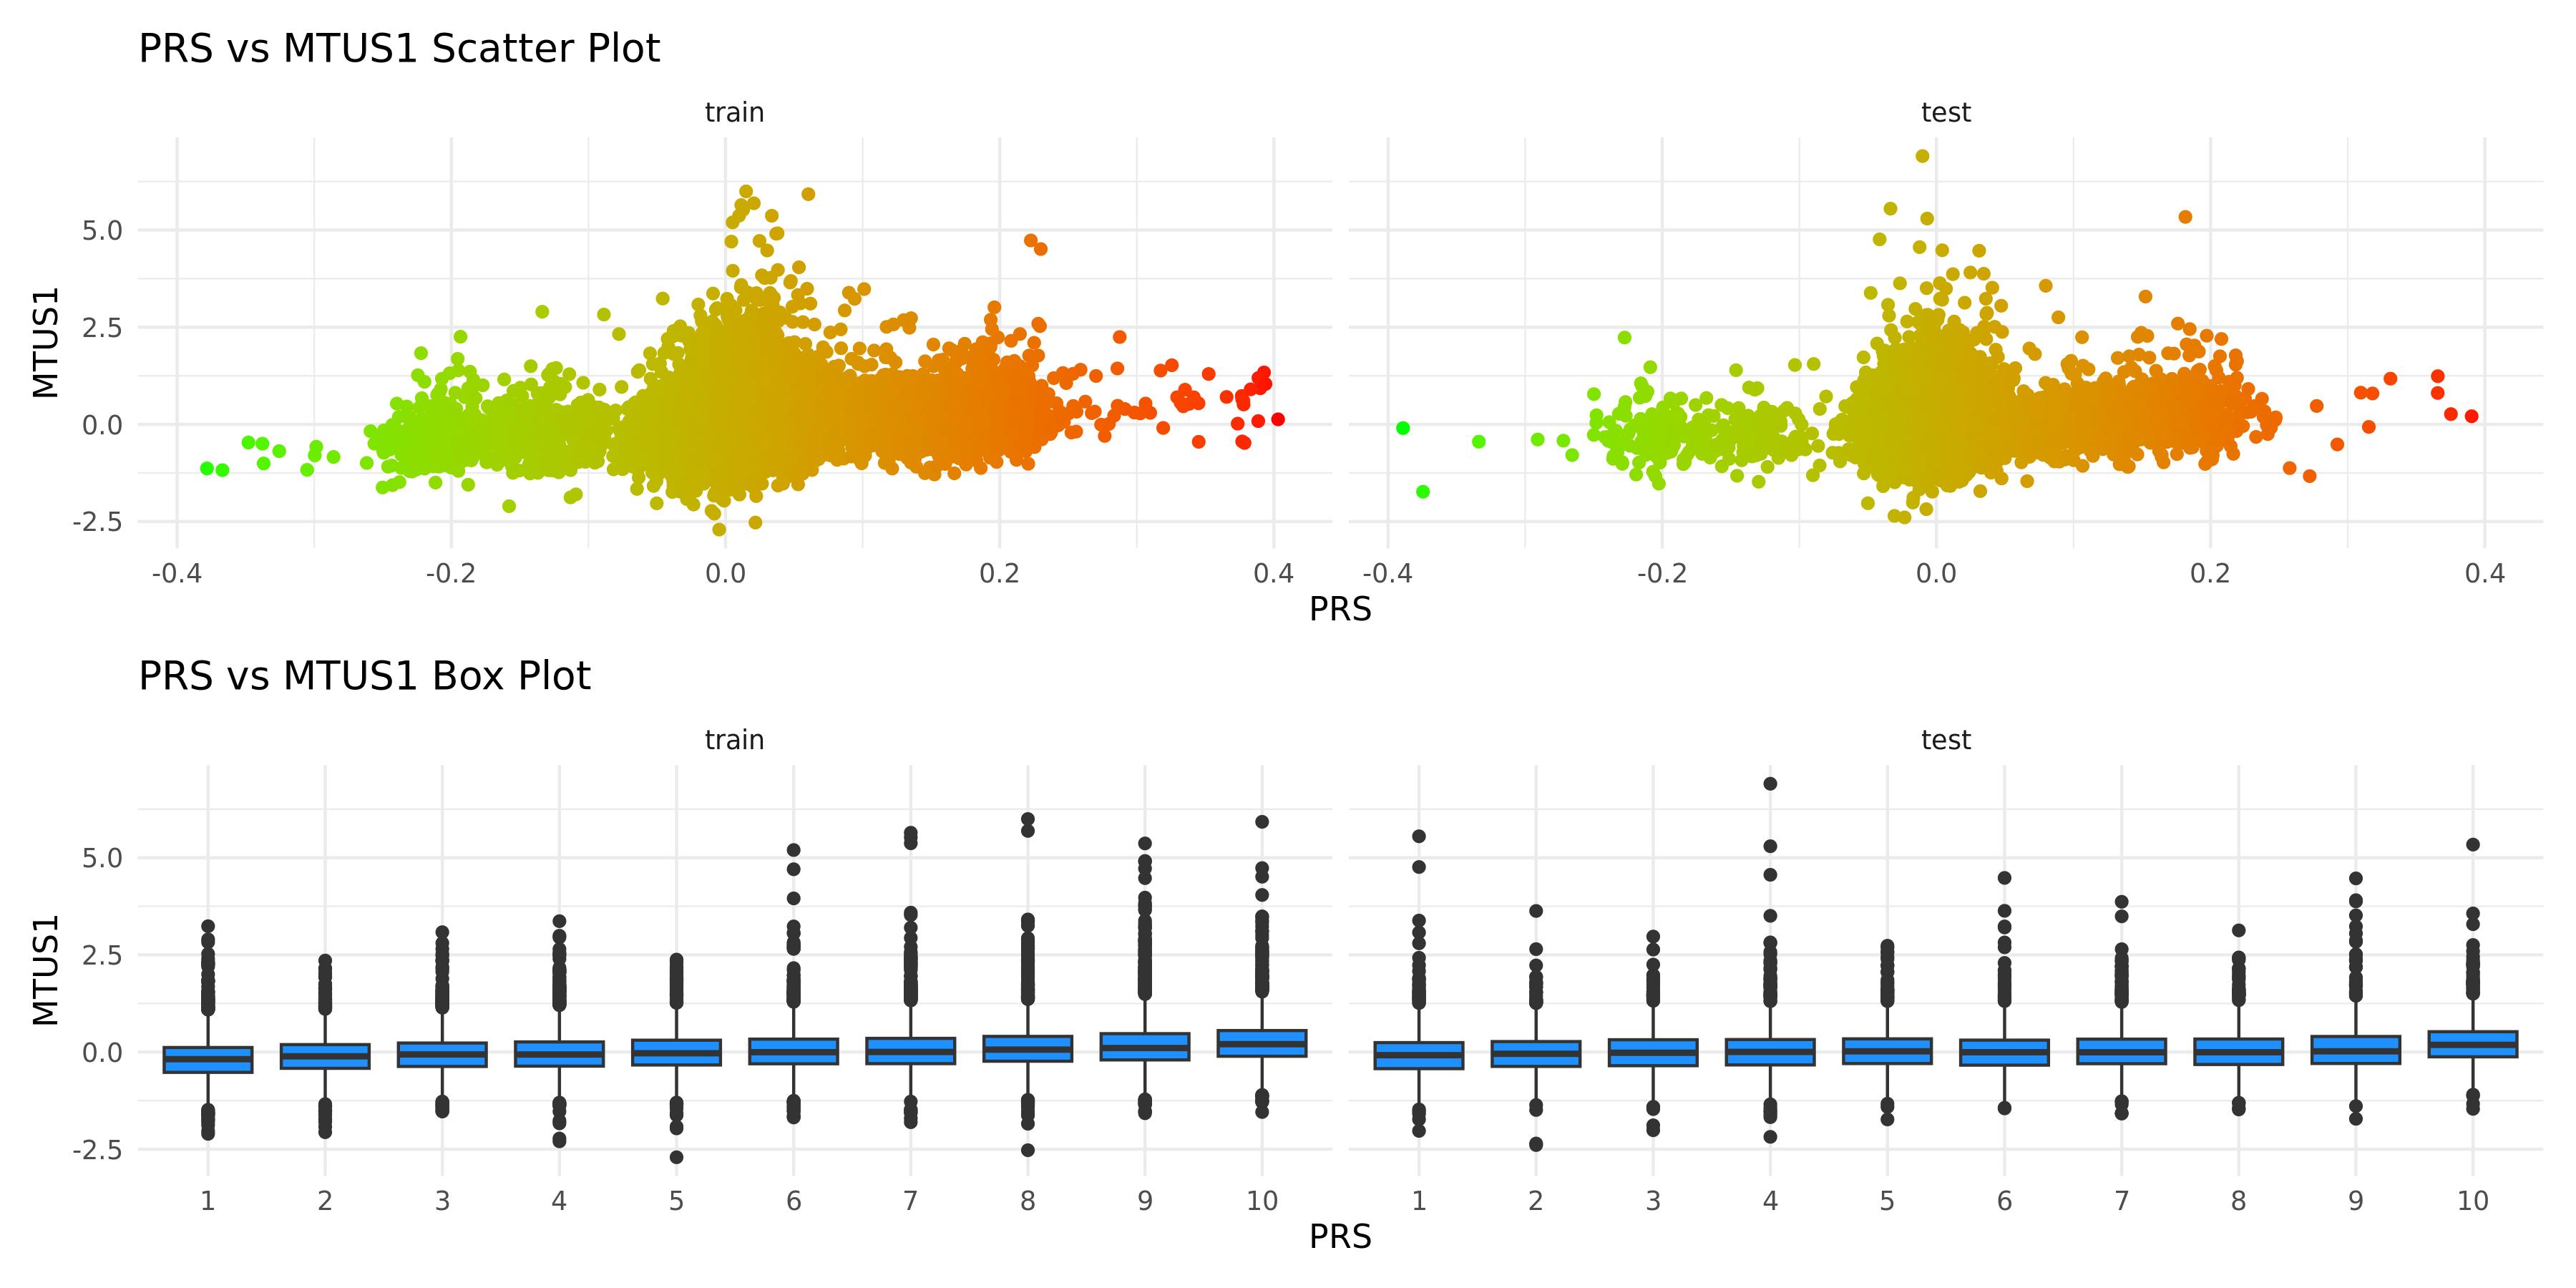
PRS scatter and box plotsenlarge ⤢
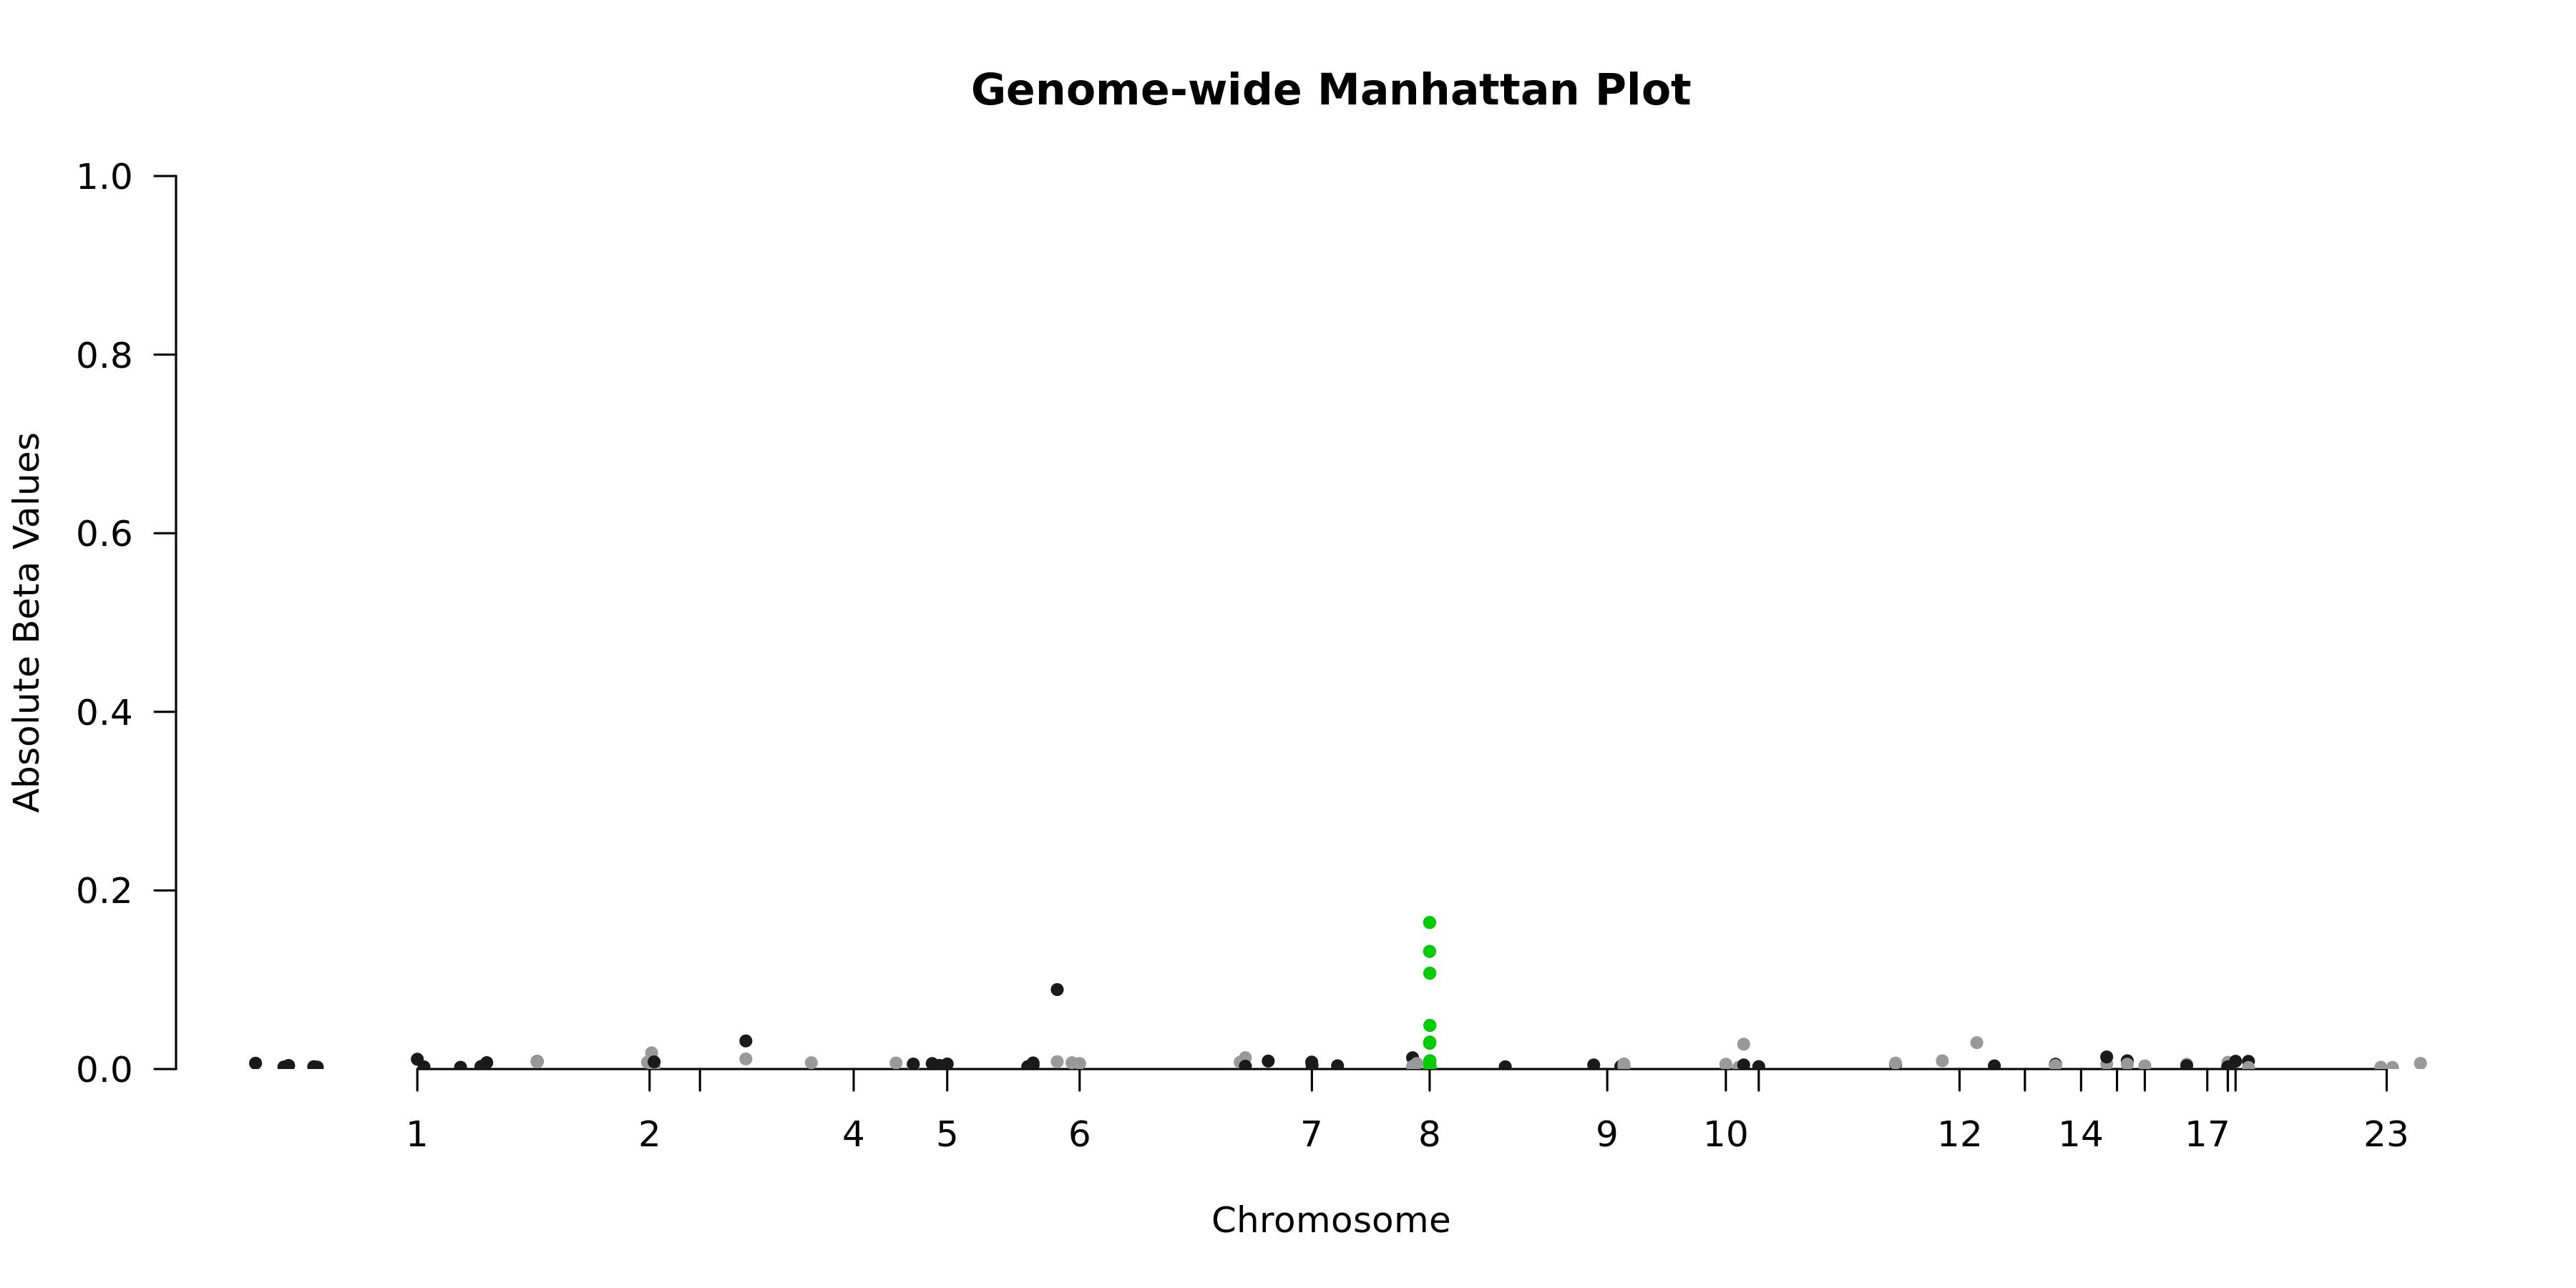
Genome-wide Manhattan Plotenlarge ⤢
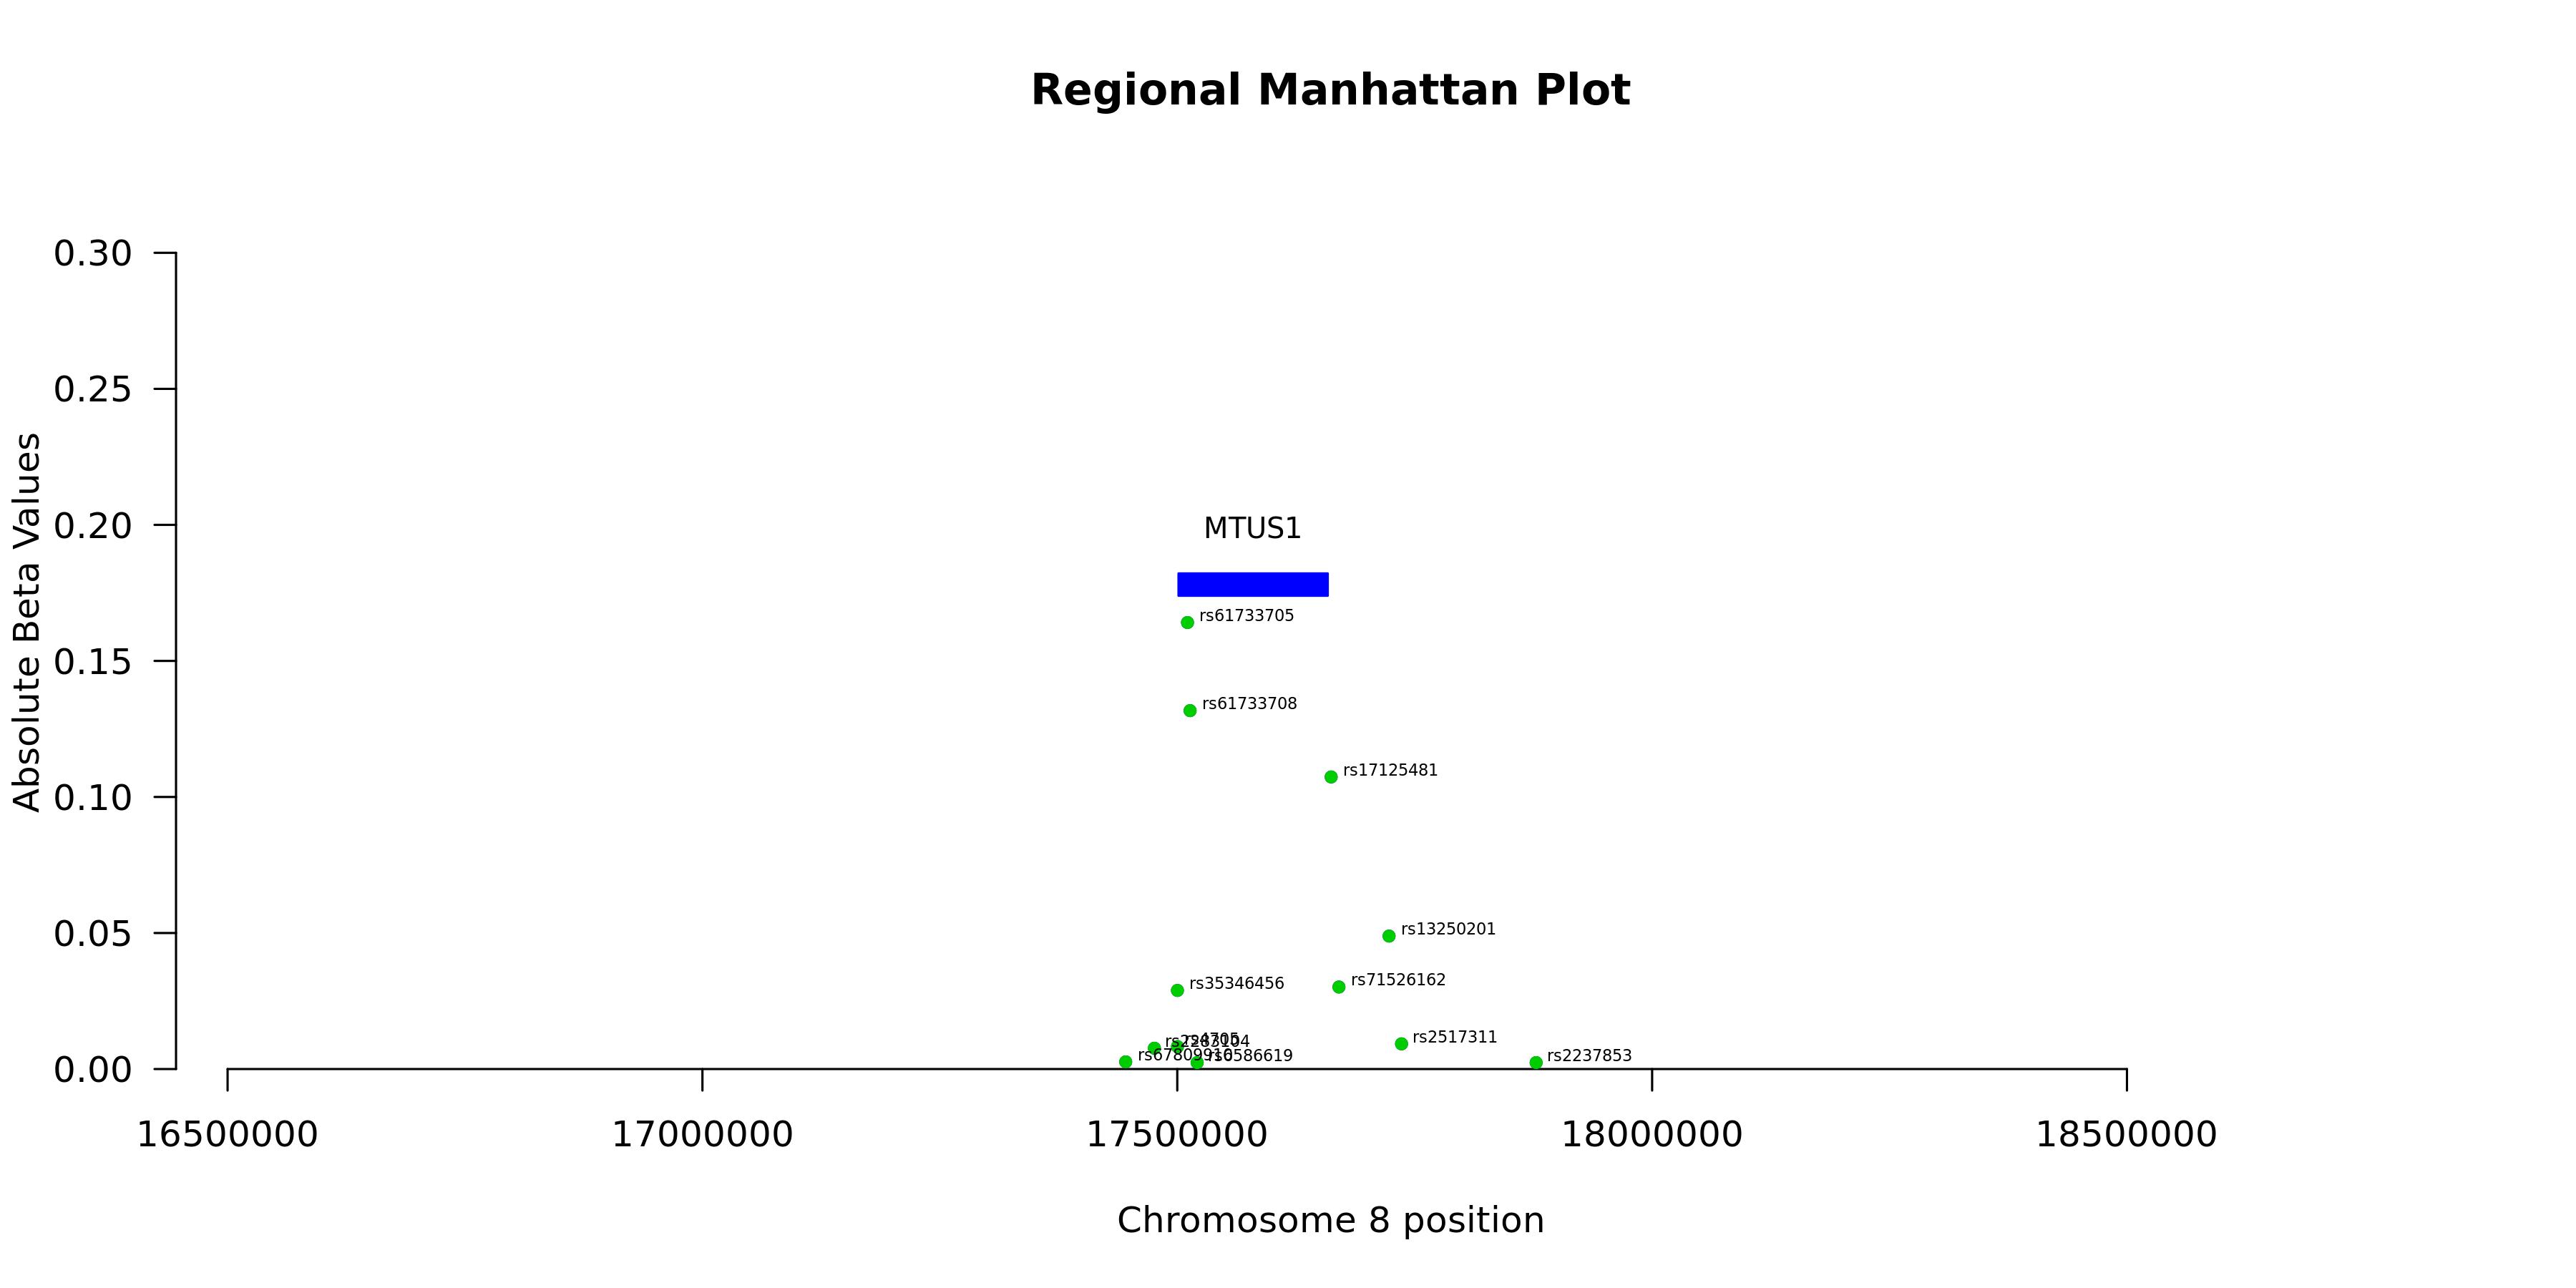
Regional Manhattan Plotenlarge ⤢
Model record
Field
Value
Gene
MTUS1
test_n
10538
sparsity
93
pearson_coefficent
0.16183471895245
SE
0.0106915999345694
P_corr
4.27429367131927e-51
R2 Covariate Model
0.0201
R2 Full Model
0.0458
P
2.55318895908558e-89
P_full
2.95656547198742e-189
n_cis_pqtl
13
max_cis_pqtl
rs61733705
rank_max_cis_pqtl
1
mean_pqtl_beta
0.0419908815995774
mean_nopqtl_beta
0.00747893547670558
percentage_pqtl
0.139784946236559
percentage_nopqtl
0.860215053763441
cis and genome-wide metrics
Field
Value
Gene
MTUS1
test_n_genomewide
10538
sparsity_genomewide
93
pearson_coefficent_genomewide
0.16183471895245
SE_genomewide
0.0106915999345694
P_corr_genomewide
4.27429367131927e-51
R2_covariate_model_genomewide
0.0201306148478178
R2_full_model_genomewide
0.0457506879336544
P_genomewide
2.55318895908558e-89
P_full_genomewide
2.95656547198742e-189
n_cis_pqtl
13
max_cis_pqtl
rs61733705
rank_max_cis_pqtl
1
mean_pqtl_beta
0.0419908815995774
mean_nopqtl_beta
0.00747893547670558
percentage_pqtl
0.139784946236559
percentage_nopqtl
0.860215053763441
test_n_cis
10538
sparsity_cis
13
pearson_coefficent_cis
0.130720119003158
SE_cis
0.0107414537997473
P_corr_cis
8.59162819290557e-34
R2_covariate_model_cis
0.0201306148478178
R2_full_model_cis
0.0367724959920983
P_cis
3.95911875460608e-72
P_full_cis
8.10275359163559e-136