MSLN
Olink Explore plasma protein · SNPBoost PRS model
R2 Full Model
0.2744
pearson_coefficent
0.4732
sparsity
482
n_cis_pqtl
38
max_cis_pqtl
rs145273478
Diagnostics
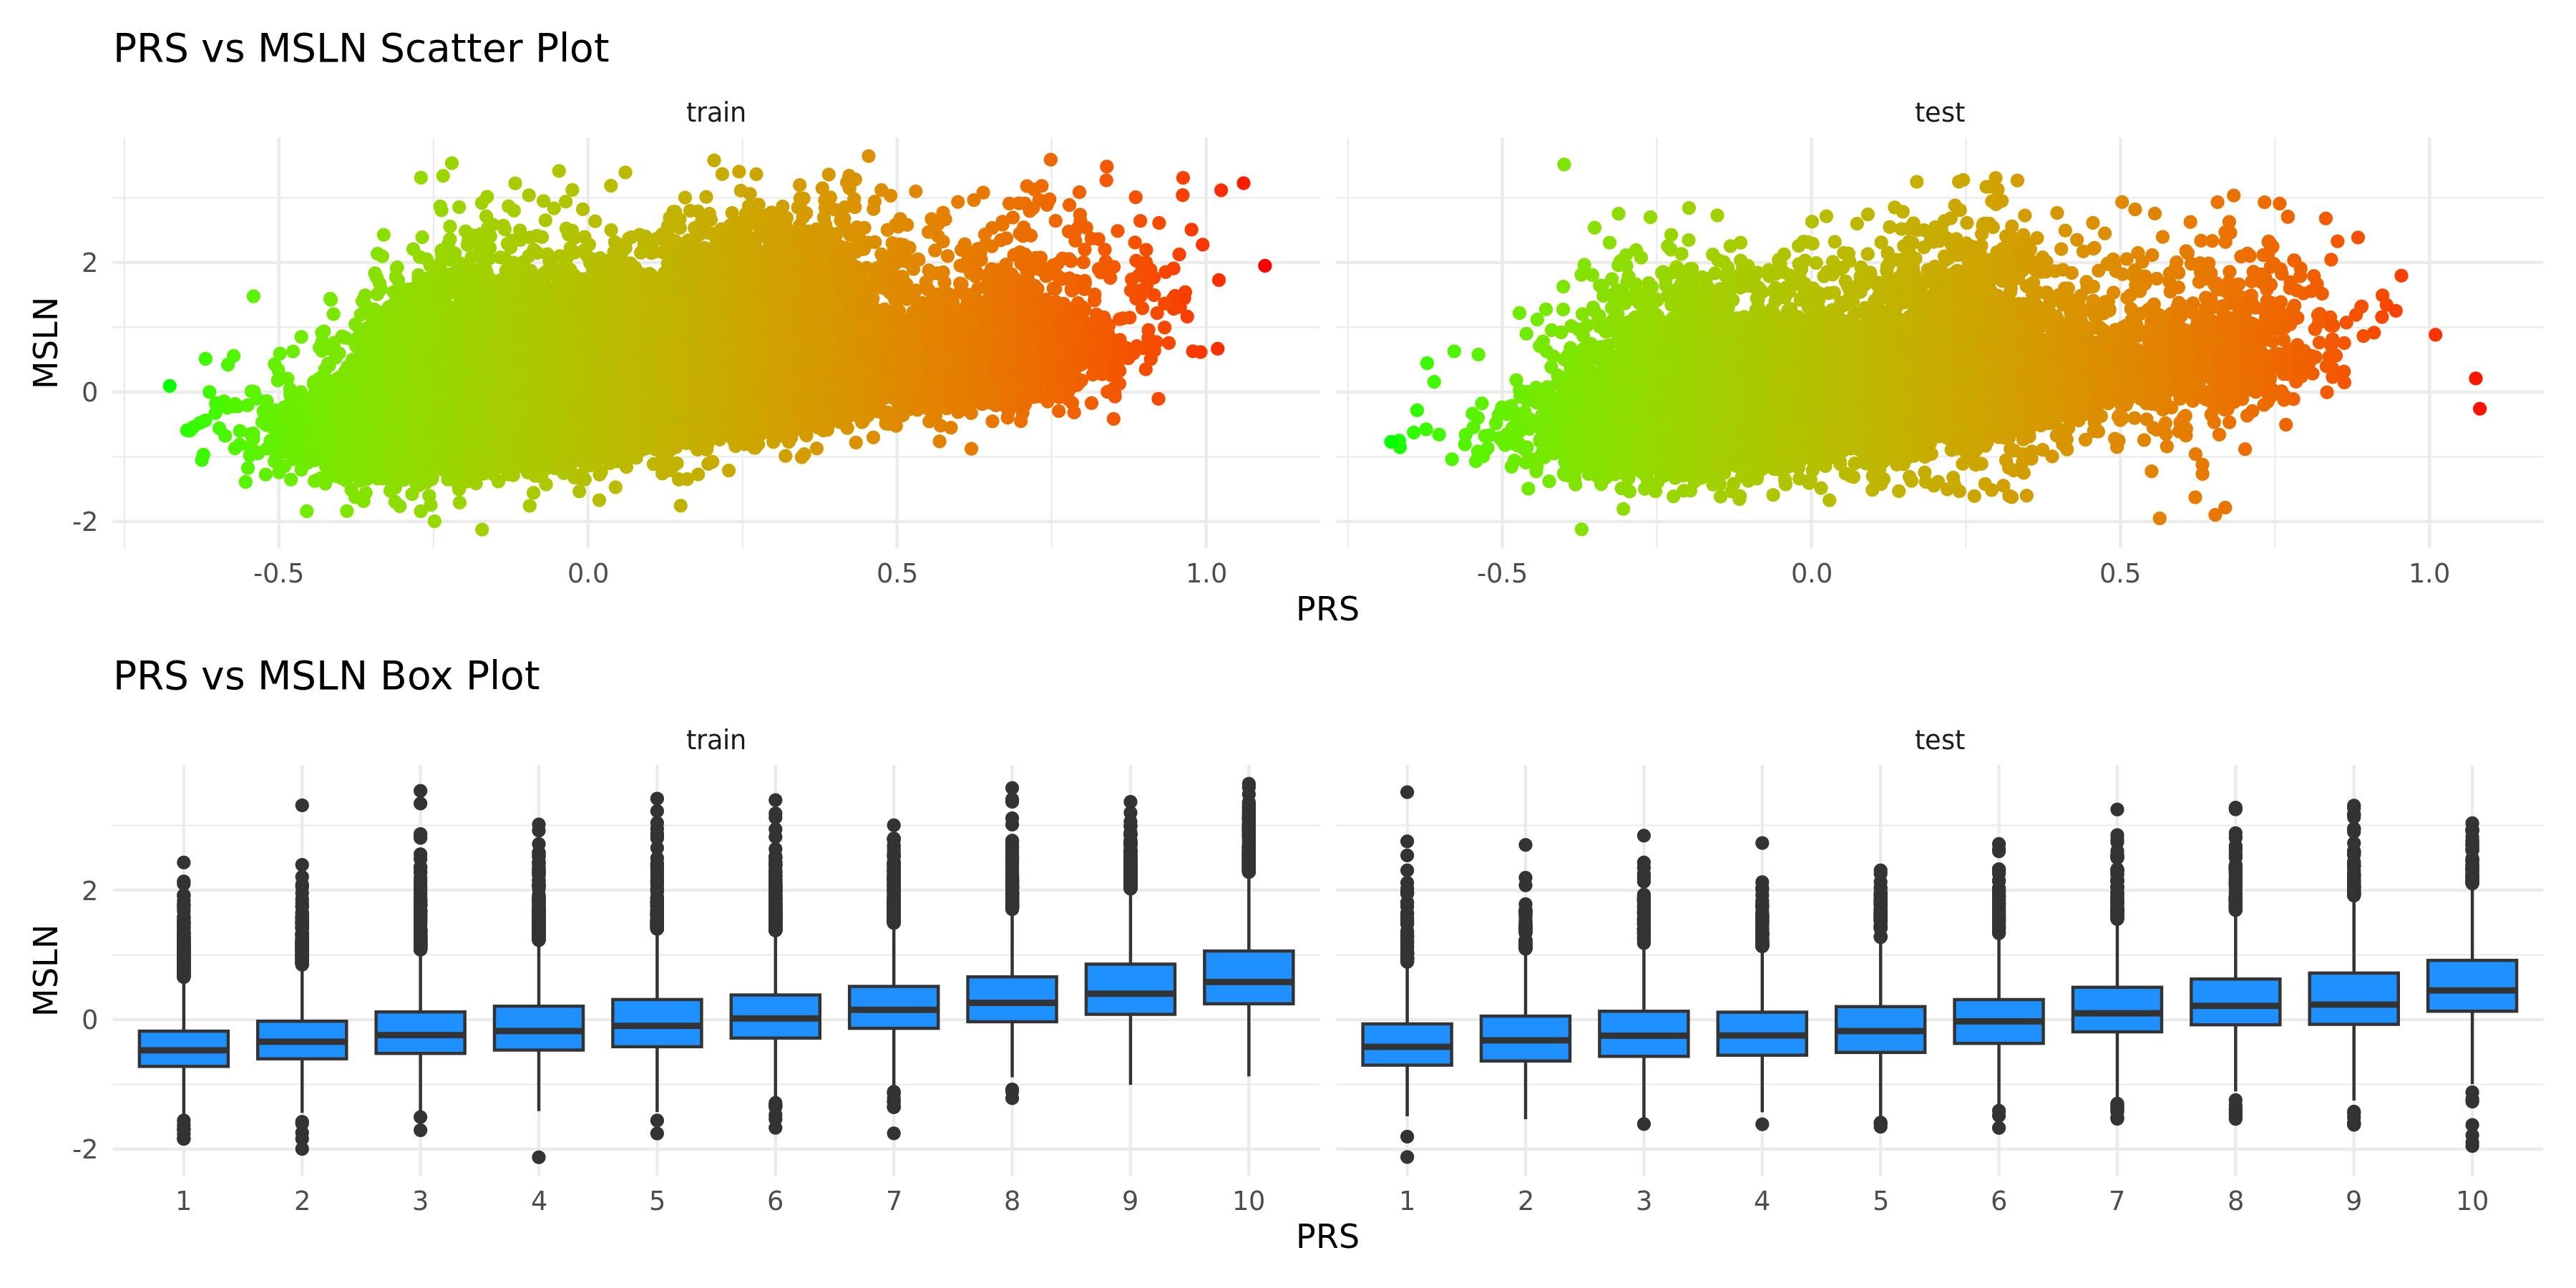
PRS scatter and box plotsenlarge ⤢
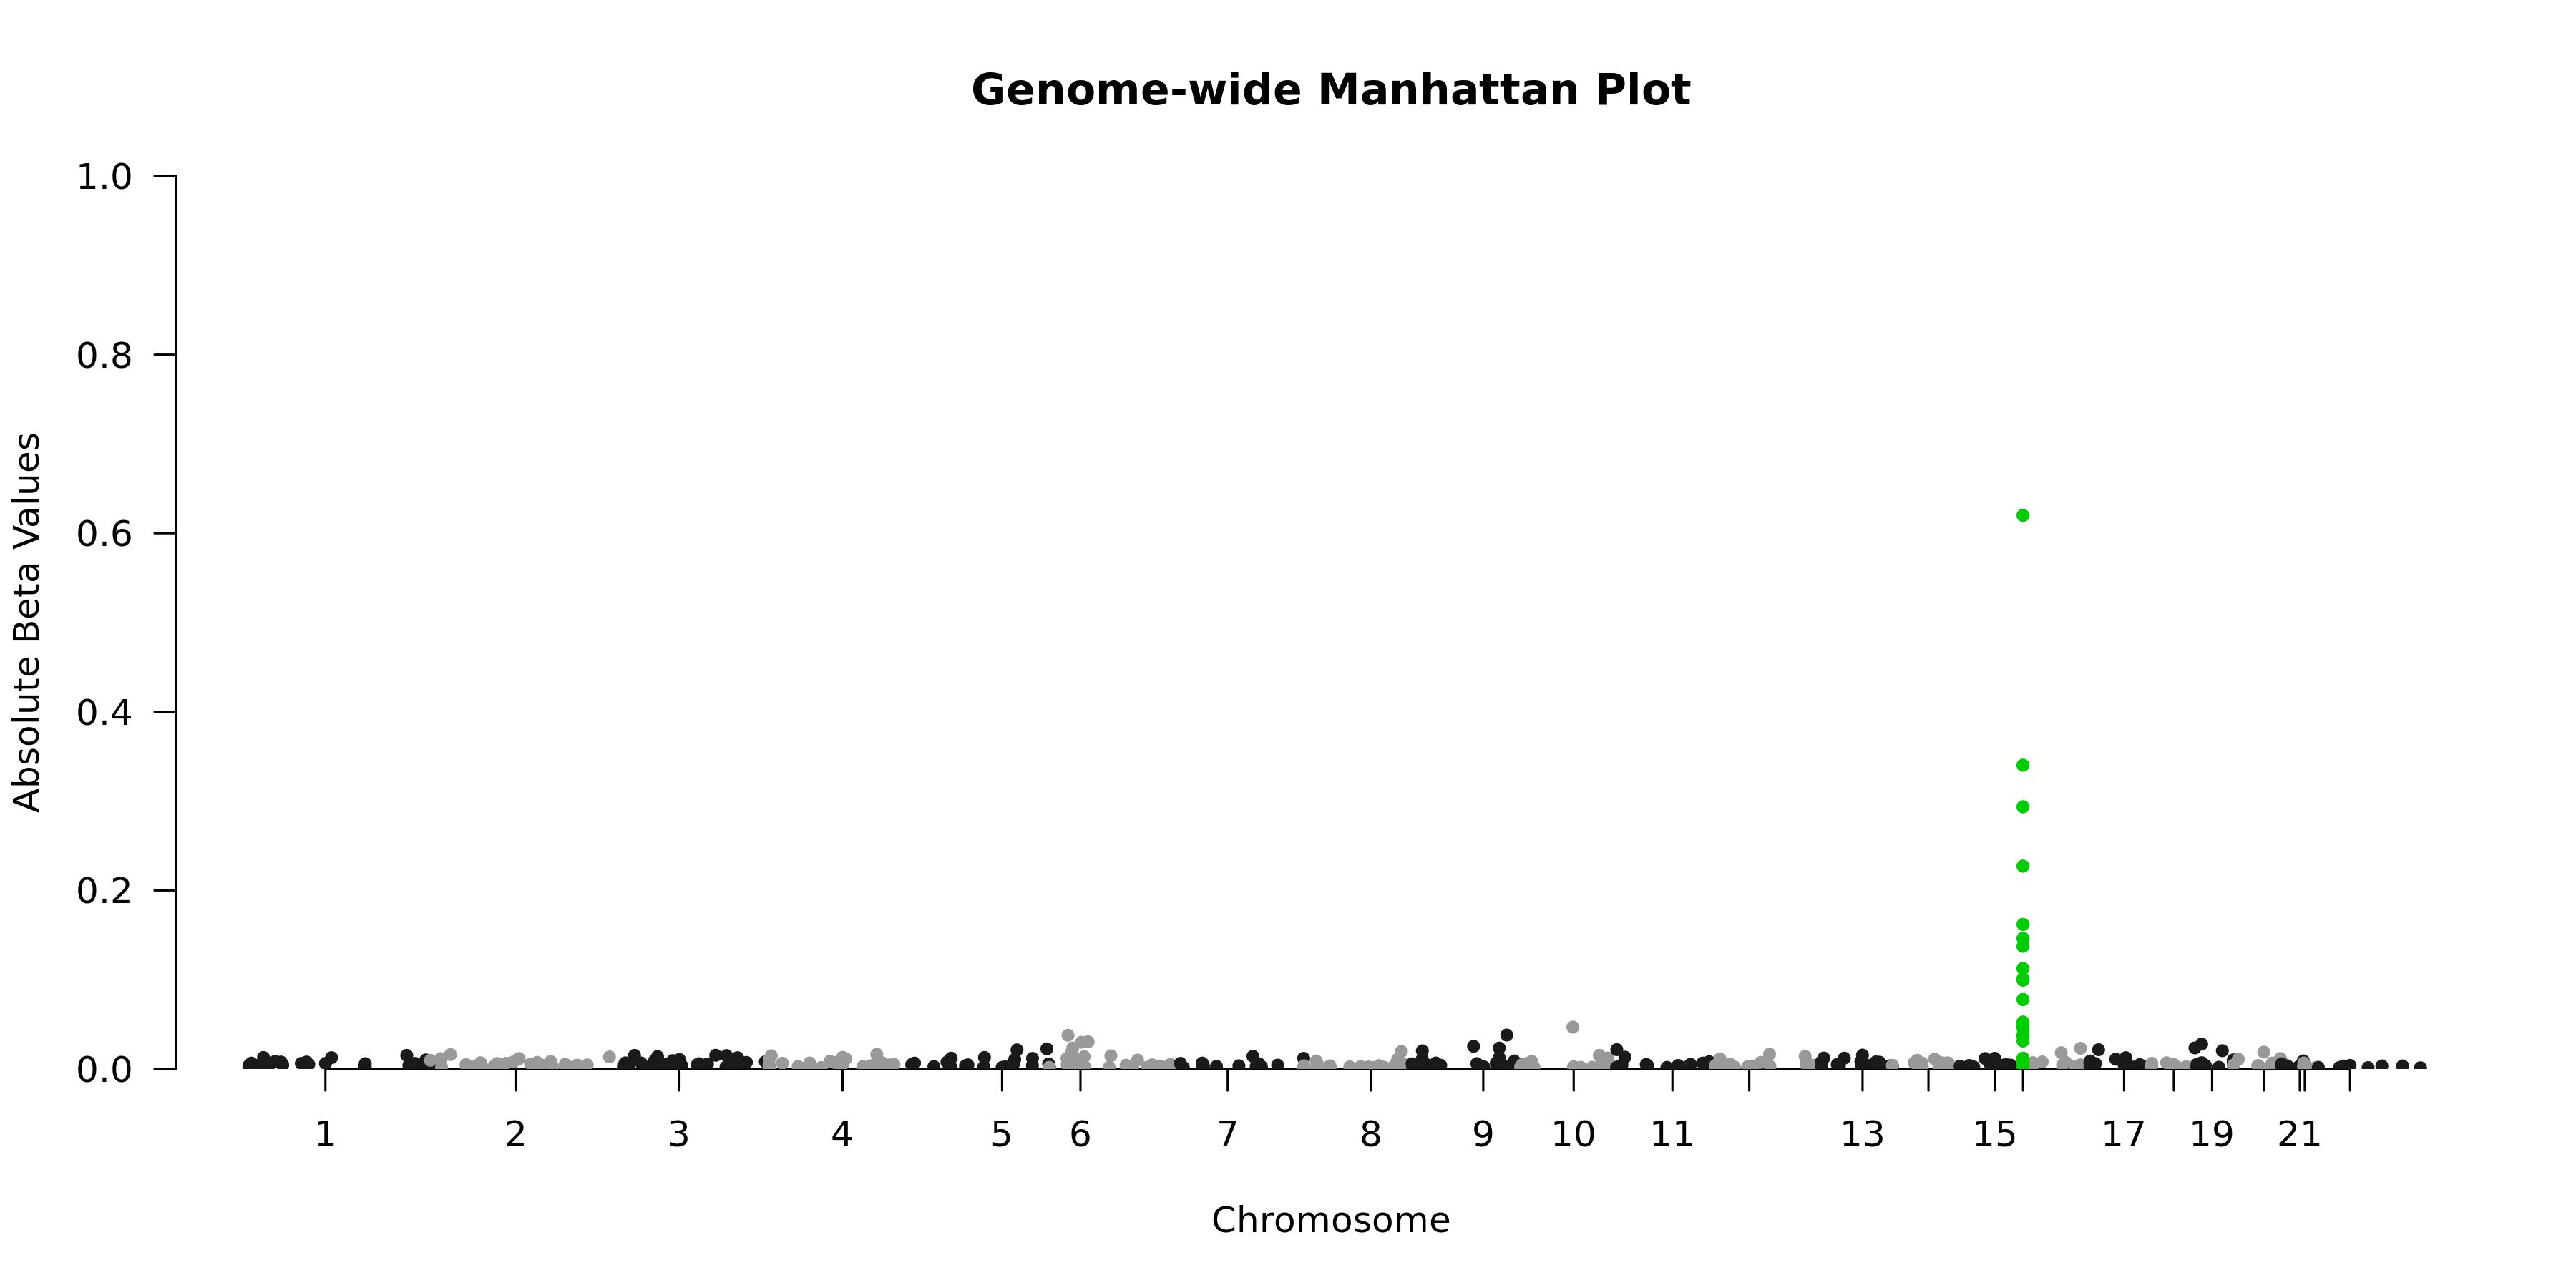
Genome-wide Manhattan Plotenlarge ⤢
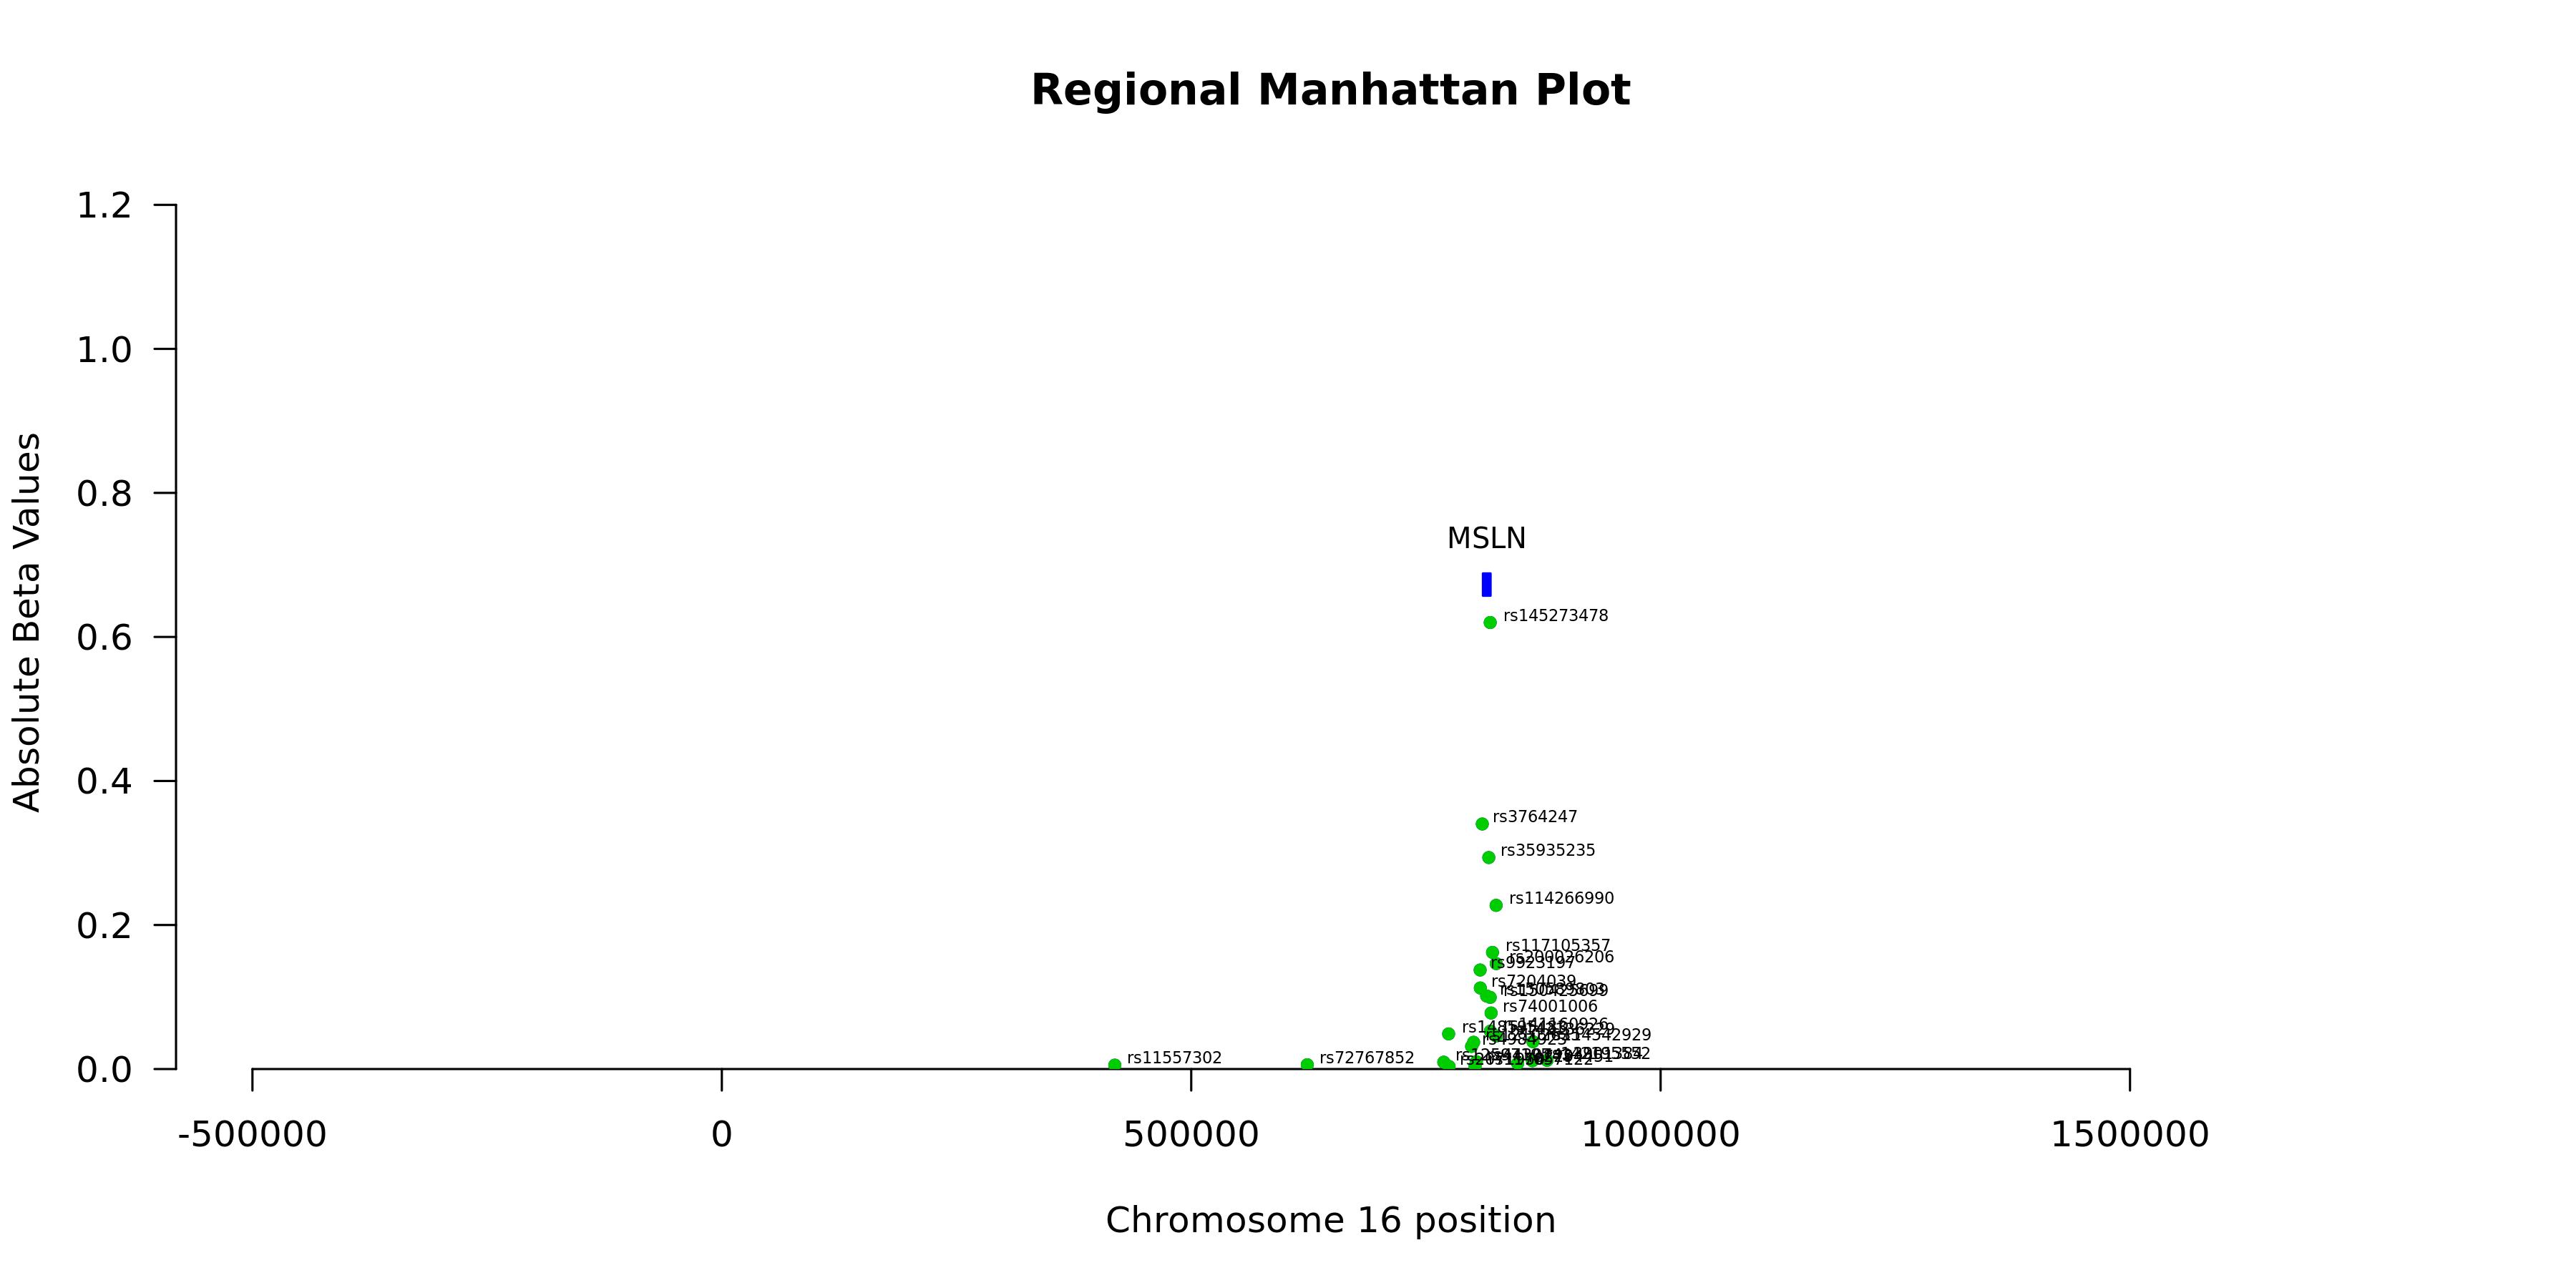
Regional Manhattan Plotenlarge ⤢
Model record
Field
Value
Gene
MSLN
test_n
10538
sparsity
482
pearson_coefficent
0.473179836164988
SE
0.00873357126784925
P_corr
0
R2 Covariate Model
0.0477
R2 Full Model
0.2744
P
0
P_full
0
n_cis_pqtl
38
max_cis_pqtl
rs145273478
rank_max_cis_pqtl
1
mean_pqtl_beta
0.0719613245115551
mean_nopqtl_beta
0.00607620774453293
percentage_pqtl
0.0788381742738589
percentage_nopqtl
0.921161825726141
cis and genome-wide metrics
Field
Value
Gene
MSLN
test_n_genomewide
10538
sparsity_genomewide
482
pearson_coefficent_genomewide
0.473179836164988
SE_genomewide
0.00873357126784925
P_corr_genomewide
0
R2_covariate_model_genomewide
0.0476656443375935
R2_full_model_genomewide
0.274443128083981
P_genomewide
0
P_full_genomewide
0
n_cis_pqtl
38
max_cis_pqtl
rs145273478
rank_max_cis_pqtl
1
mean_pqtl_beta
0.0719613245115551
mean_nopqtl_beta
0.00607620774453293
percentage_pqtl
0.0788381742738589
percentage_nopqtl
0.921161825726141
test_n_cis
10538
sparsity_cis
38
pearson_coefficent_cis
0.42437171467841
SE_cis
0.0089766754694937
P_corr_cis
0
R2_covariate_model_cis
0.0476656443375935
R2_full_model_cis
0.23524588756178
P_cis
0
P_full_cis
0