LTBR
Olink Explore plasma protein · SNPBoost PRS model
R2 Full Model
0.2072
pearson_coefficent
0.3945
sparsity
593
n_cis_pqtl
31
max_cis_pqtl
rs41332645
Diagnostics
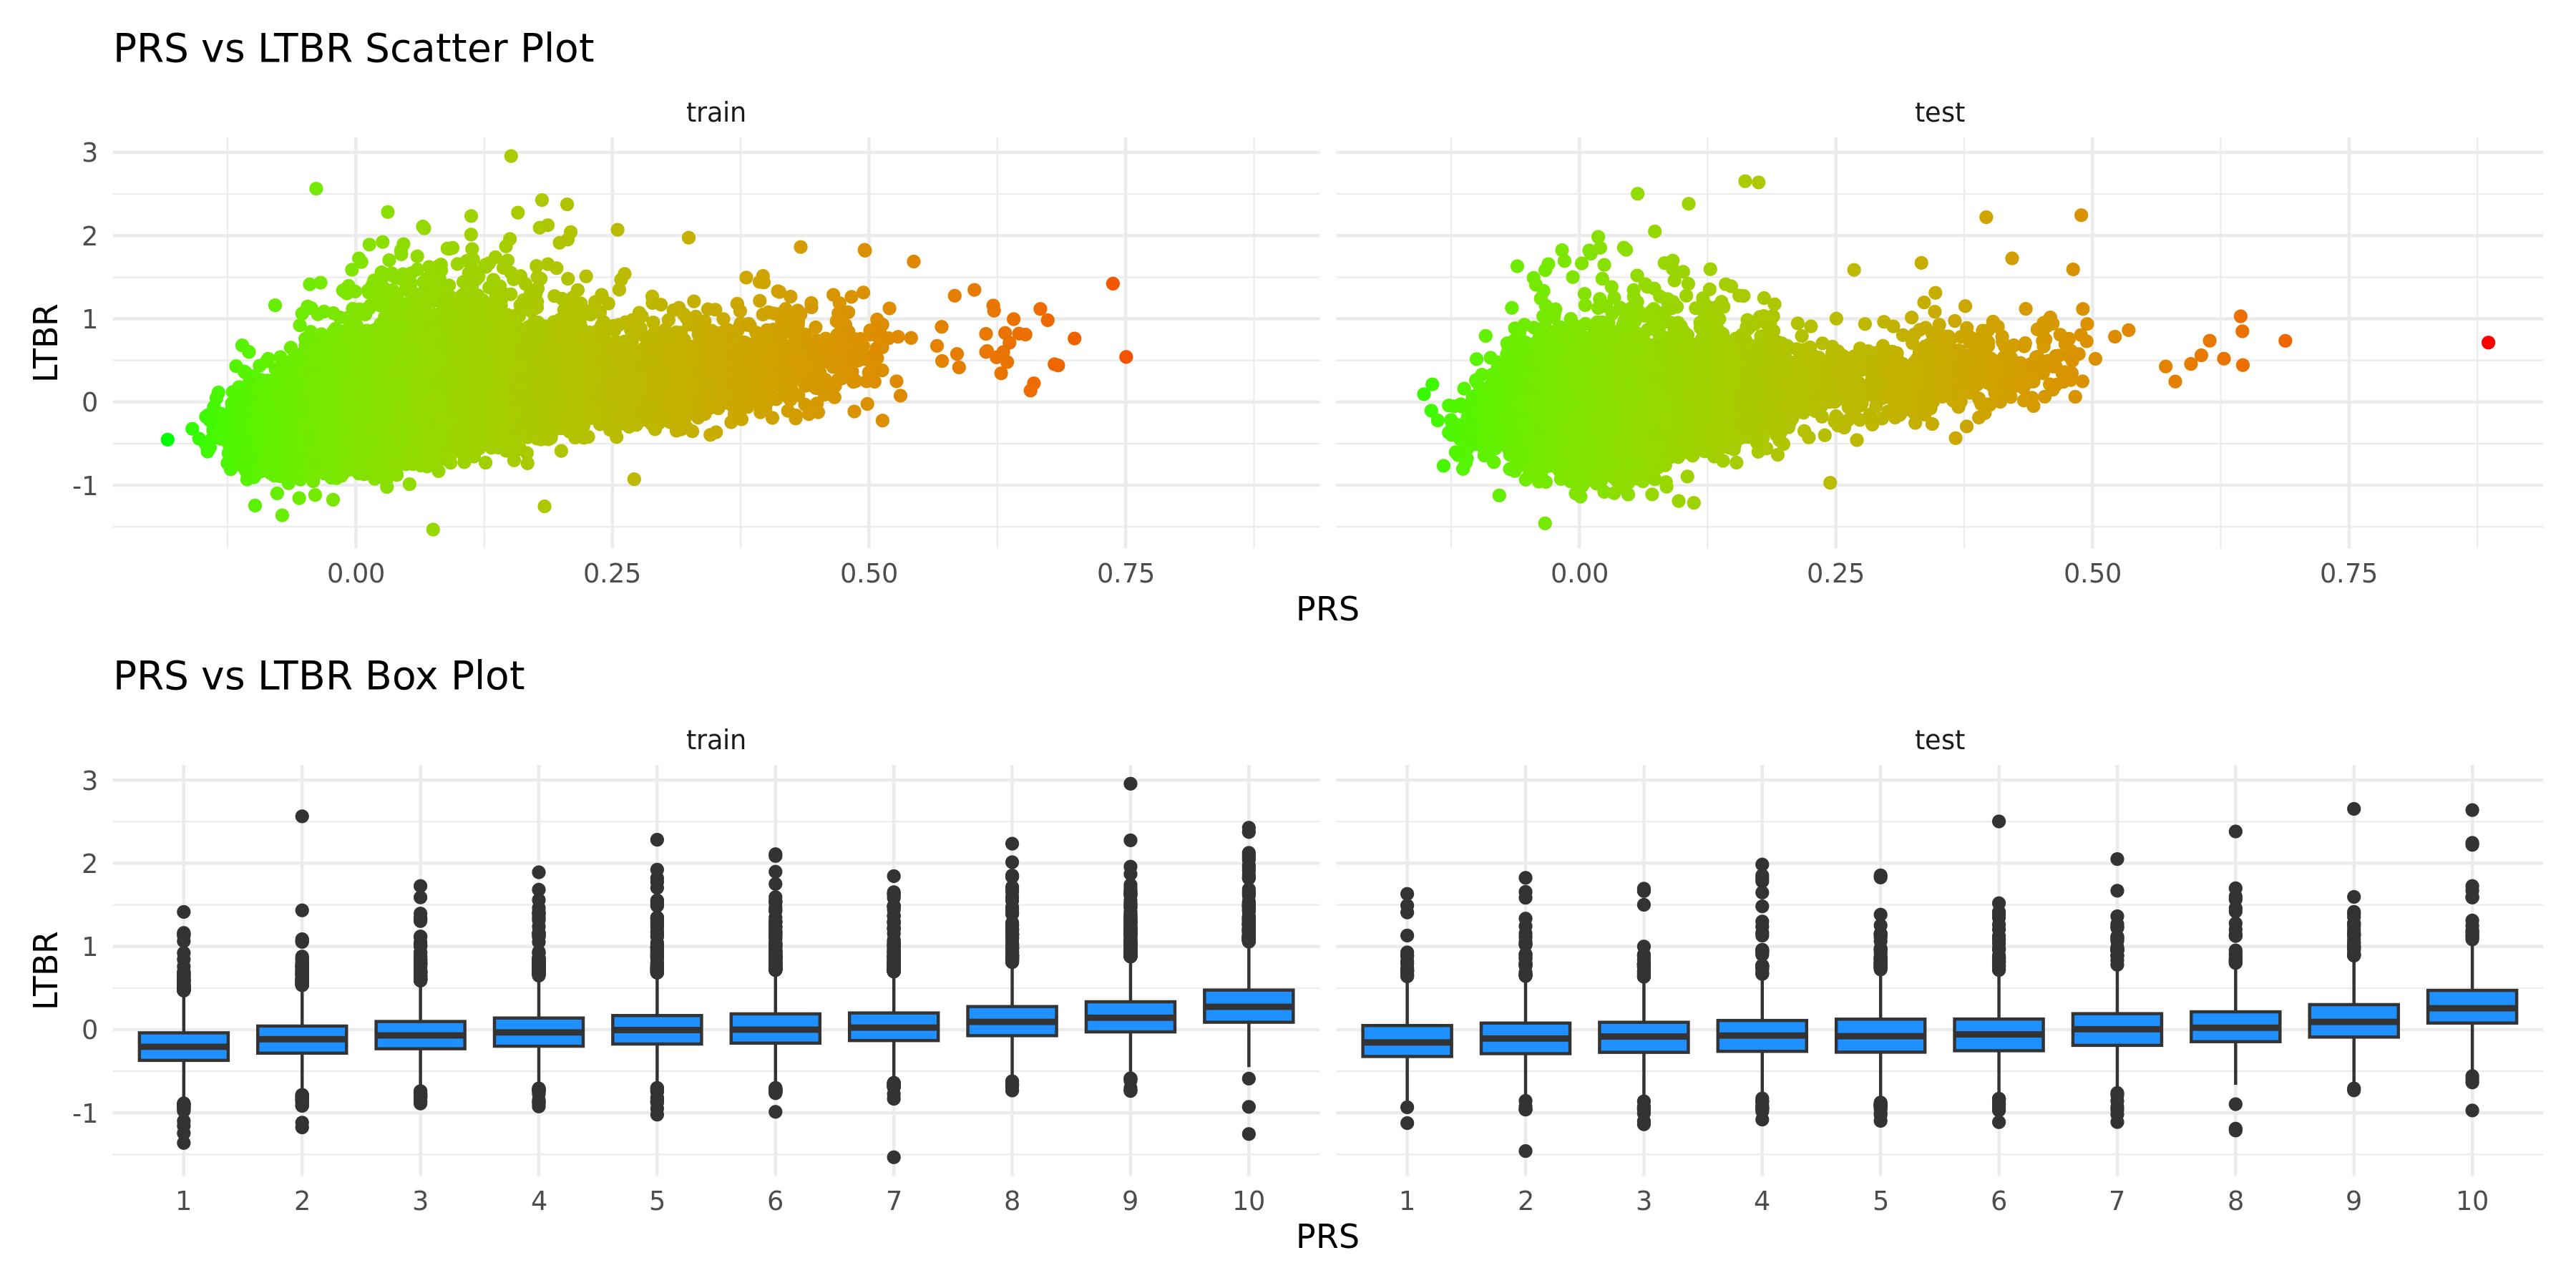
PRS scatter and box plotsenlarge ⤢
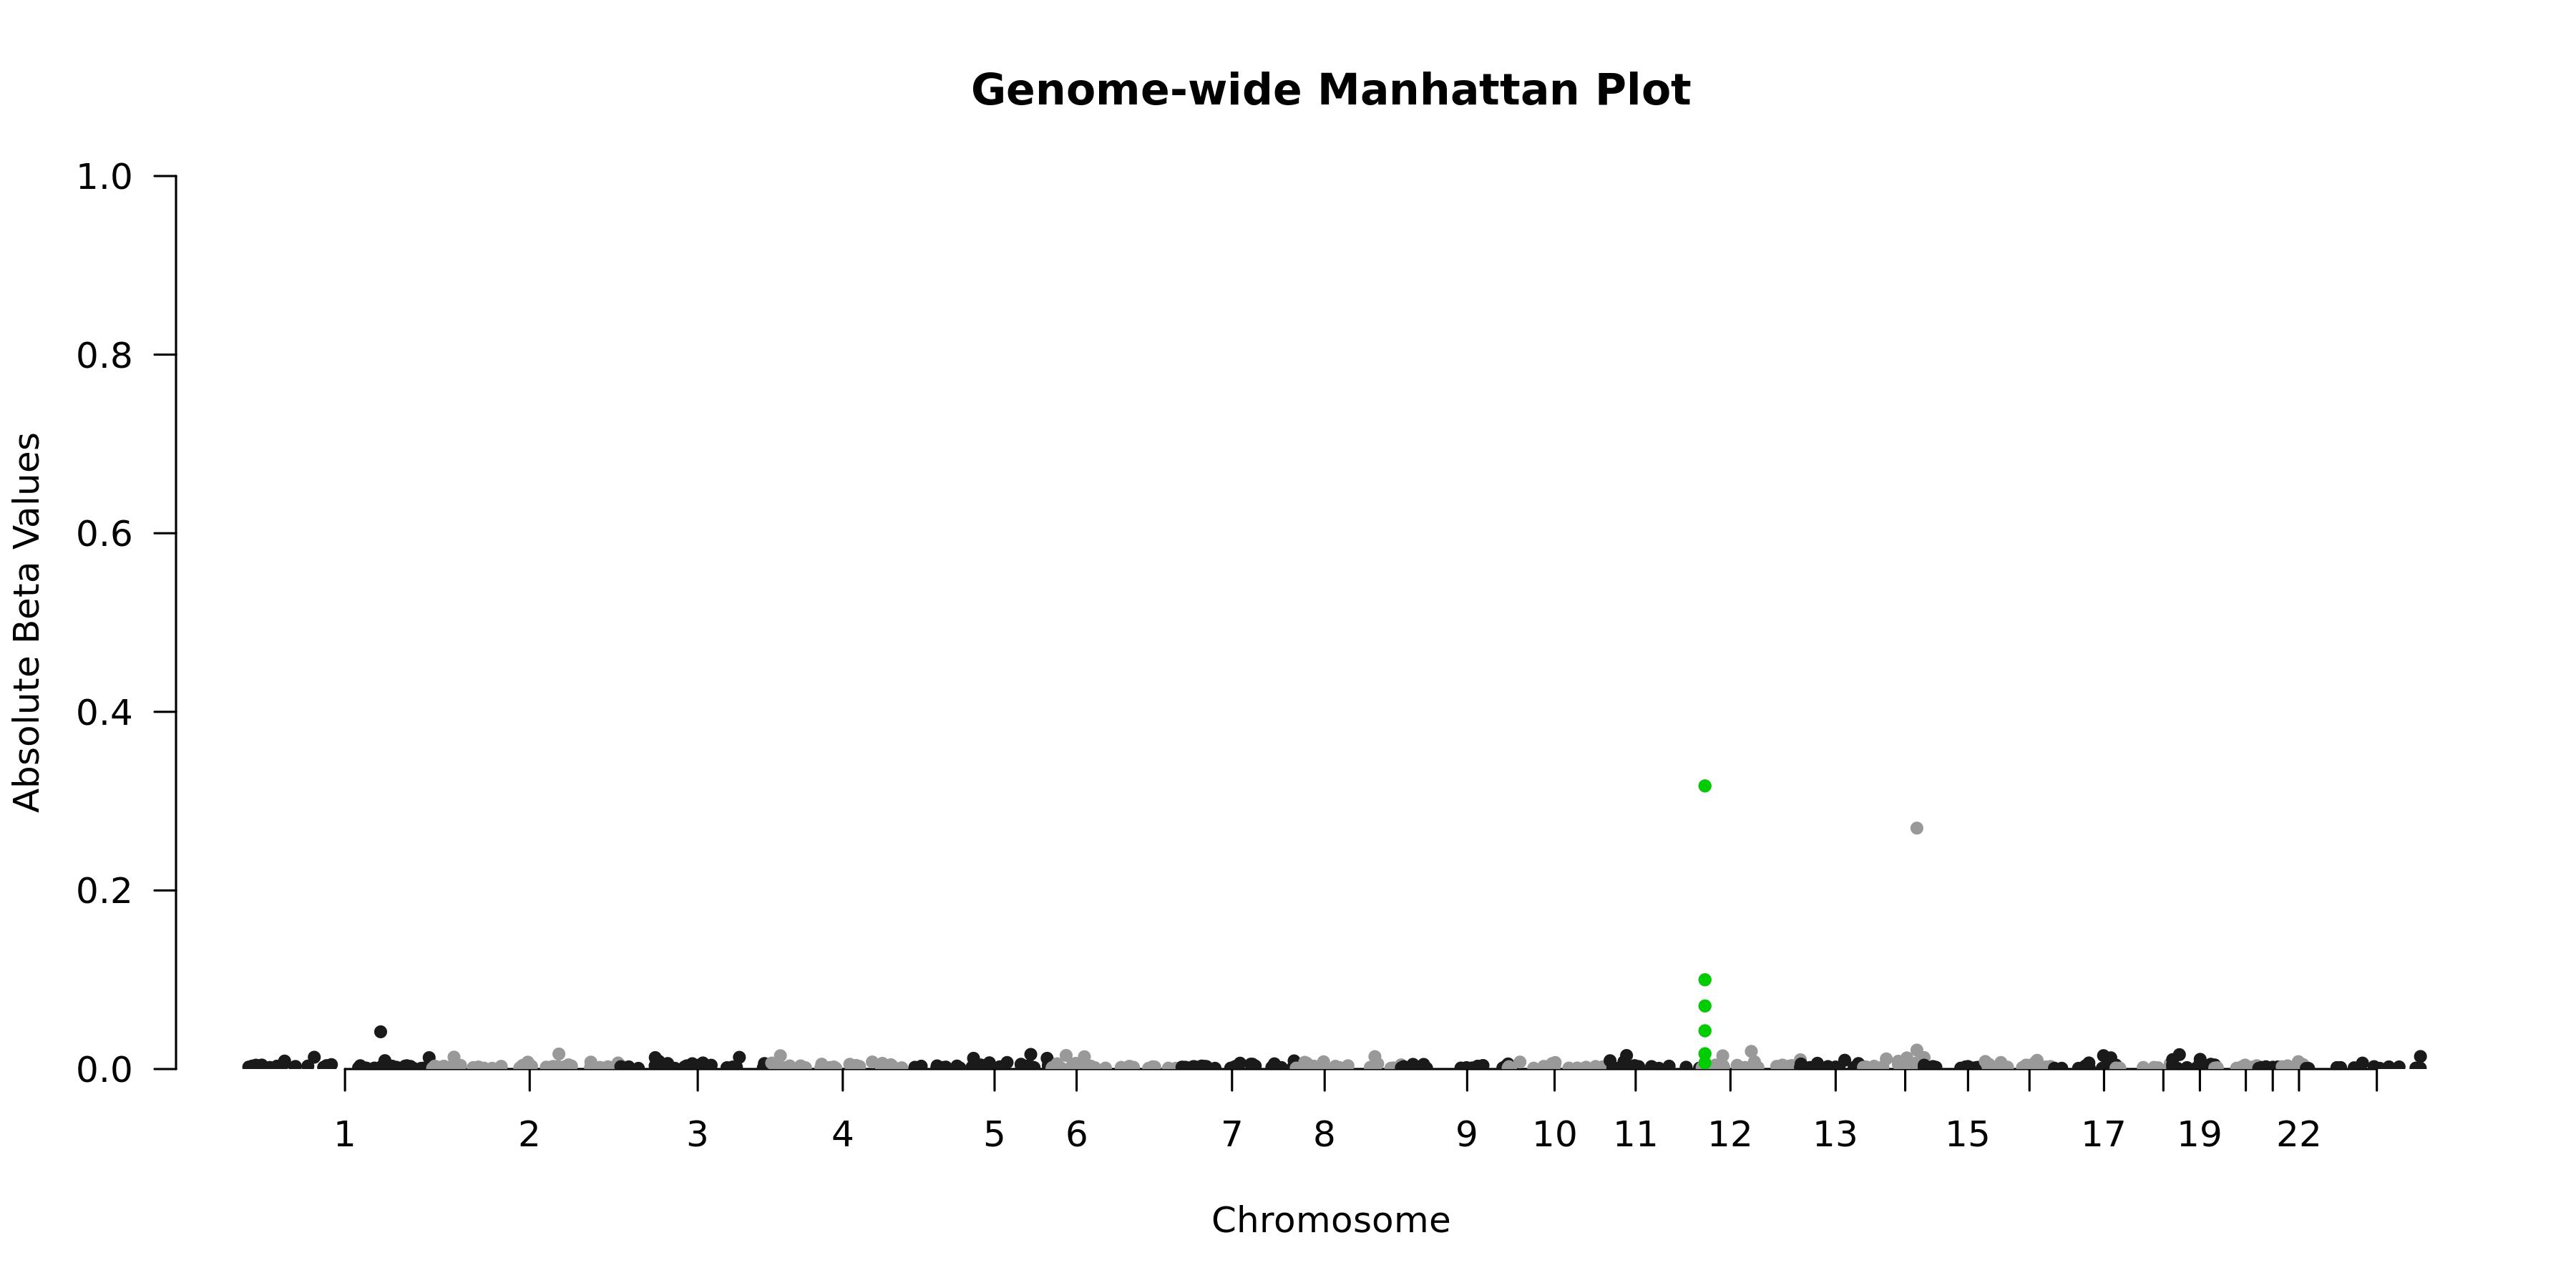
Genome-wide Manhattan Plotenlarge ⤢
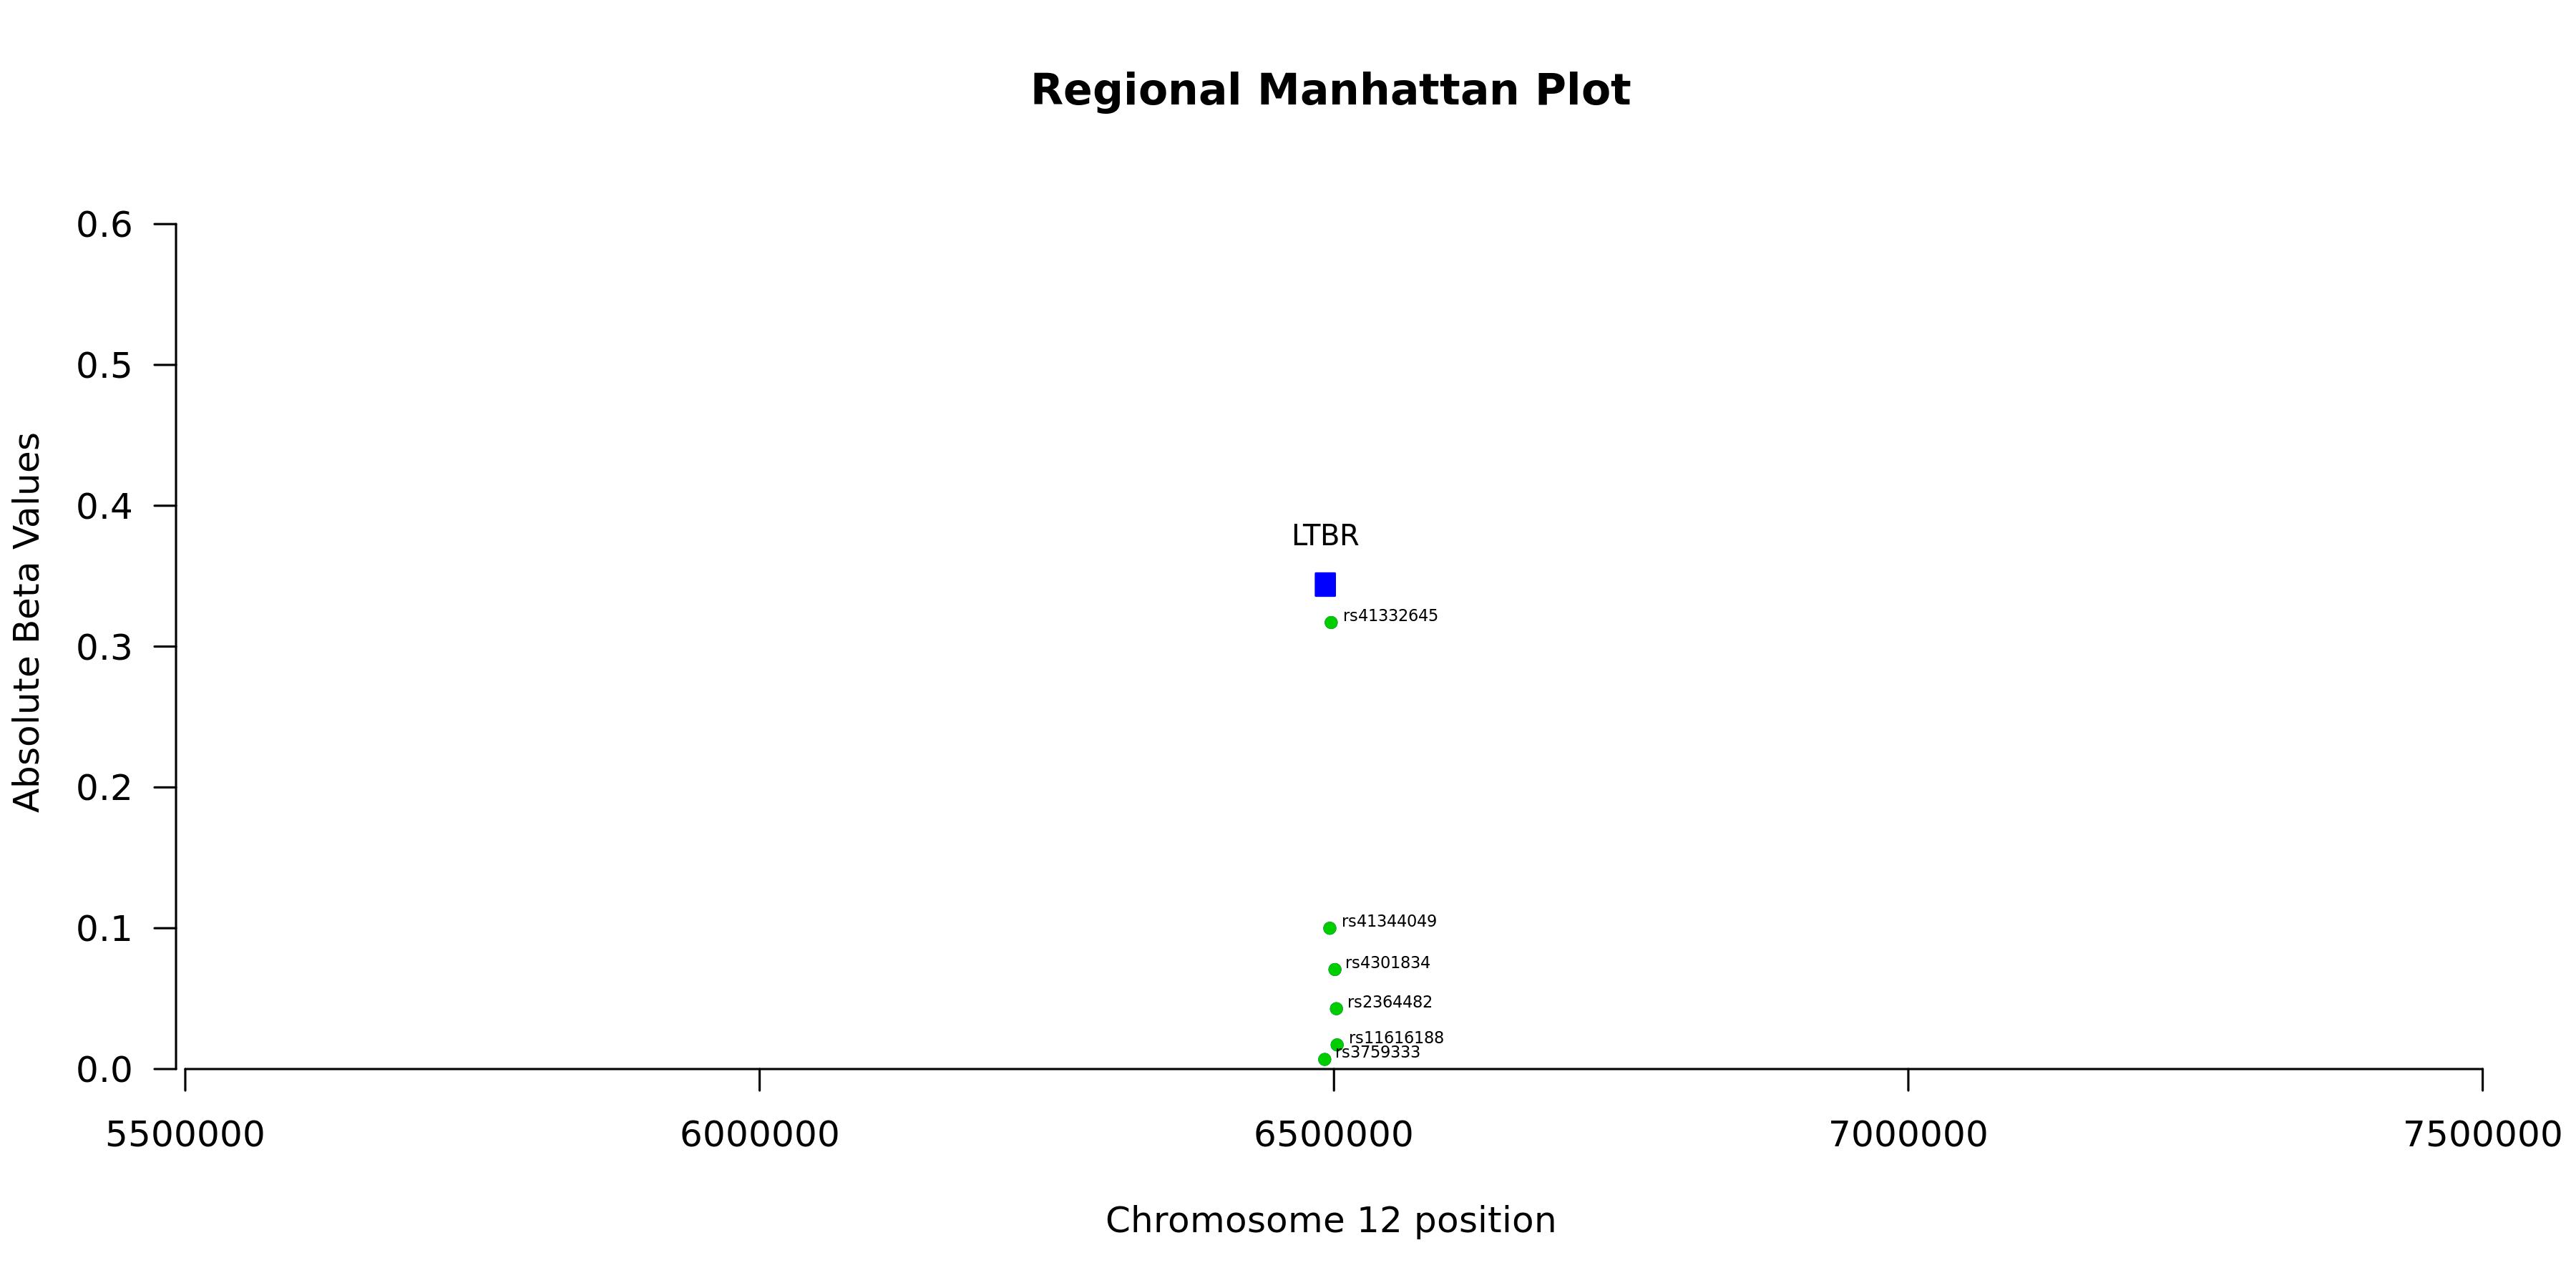
Regional Manhattan Plotenlarge ⤢
Model record
Field
Value
Gene
LTBR
test_n
10538
sparsity
593
pearson_coefficent
0.394474518035041
SE
0.00910210405004554
P_corr
0
R2 Covariate Model
0.0555
R2 Full Model
0.2072
P
0
P_full
0
n_cis_pqtl
31
max_cis_pqtl
rs41332645
rank_max_cis_pqtl
1
mean_pqtl_beta
0.0211733930613542
mean_nopqtl_beta
0.00364410711041533
percentage_pqtl
0.0522765598650928
percentage_nopqtl
0.947723440134907
cis and genome-wide metrics
Field
Value
Gene
LTBR
test_n_genomewide
10538
sparsity_genomewide
593
pearson_coefficent_genomewide
0.394474518035041
SE_genomewide
0.00910210405004554
P_corr_genomewide
0
R2_covariate_model_genomewide
0.0555198140444877
R2_full_model_genomewide
0.207175015250942
P_genomewide
0
P_full_genomewide
0
n_cis_pqtl
31
max_cis_pqtl
rs41332645
rank_max_cis_pqtl
1
mean_pqtl_beta
0.0211733930613542
mean_nopqtl_beta
0.00364410711041533
percentage_pqtl
0.0522765598650928
percentage_nopqtl
0.947723440134907
test_n_cis
10538
sparsity_cis
31
pearson_coefficent_cis
0.255335661704047
SE_cis
0.00957702241339794
P_corr_cis
1.91140699536617e-151
R2_covariate_model_cis
0.0555198140444877
R2_full_model_cis
0.119614921031618
P_cis
9.99219239455229e-285
P_full_cis
0