LAIR2
Olink Explore plasma protein · SNPBoost PRS model
R2 Full Model
0.4752
pearson_coefficent
0.6829
sparsity
919
n_cis_pqtl
53
max_cis_pqtl
rs61737751
Diagnostics
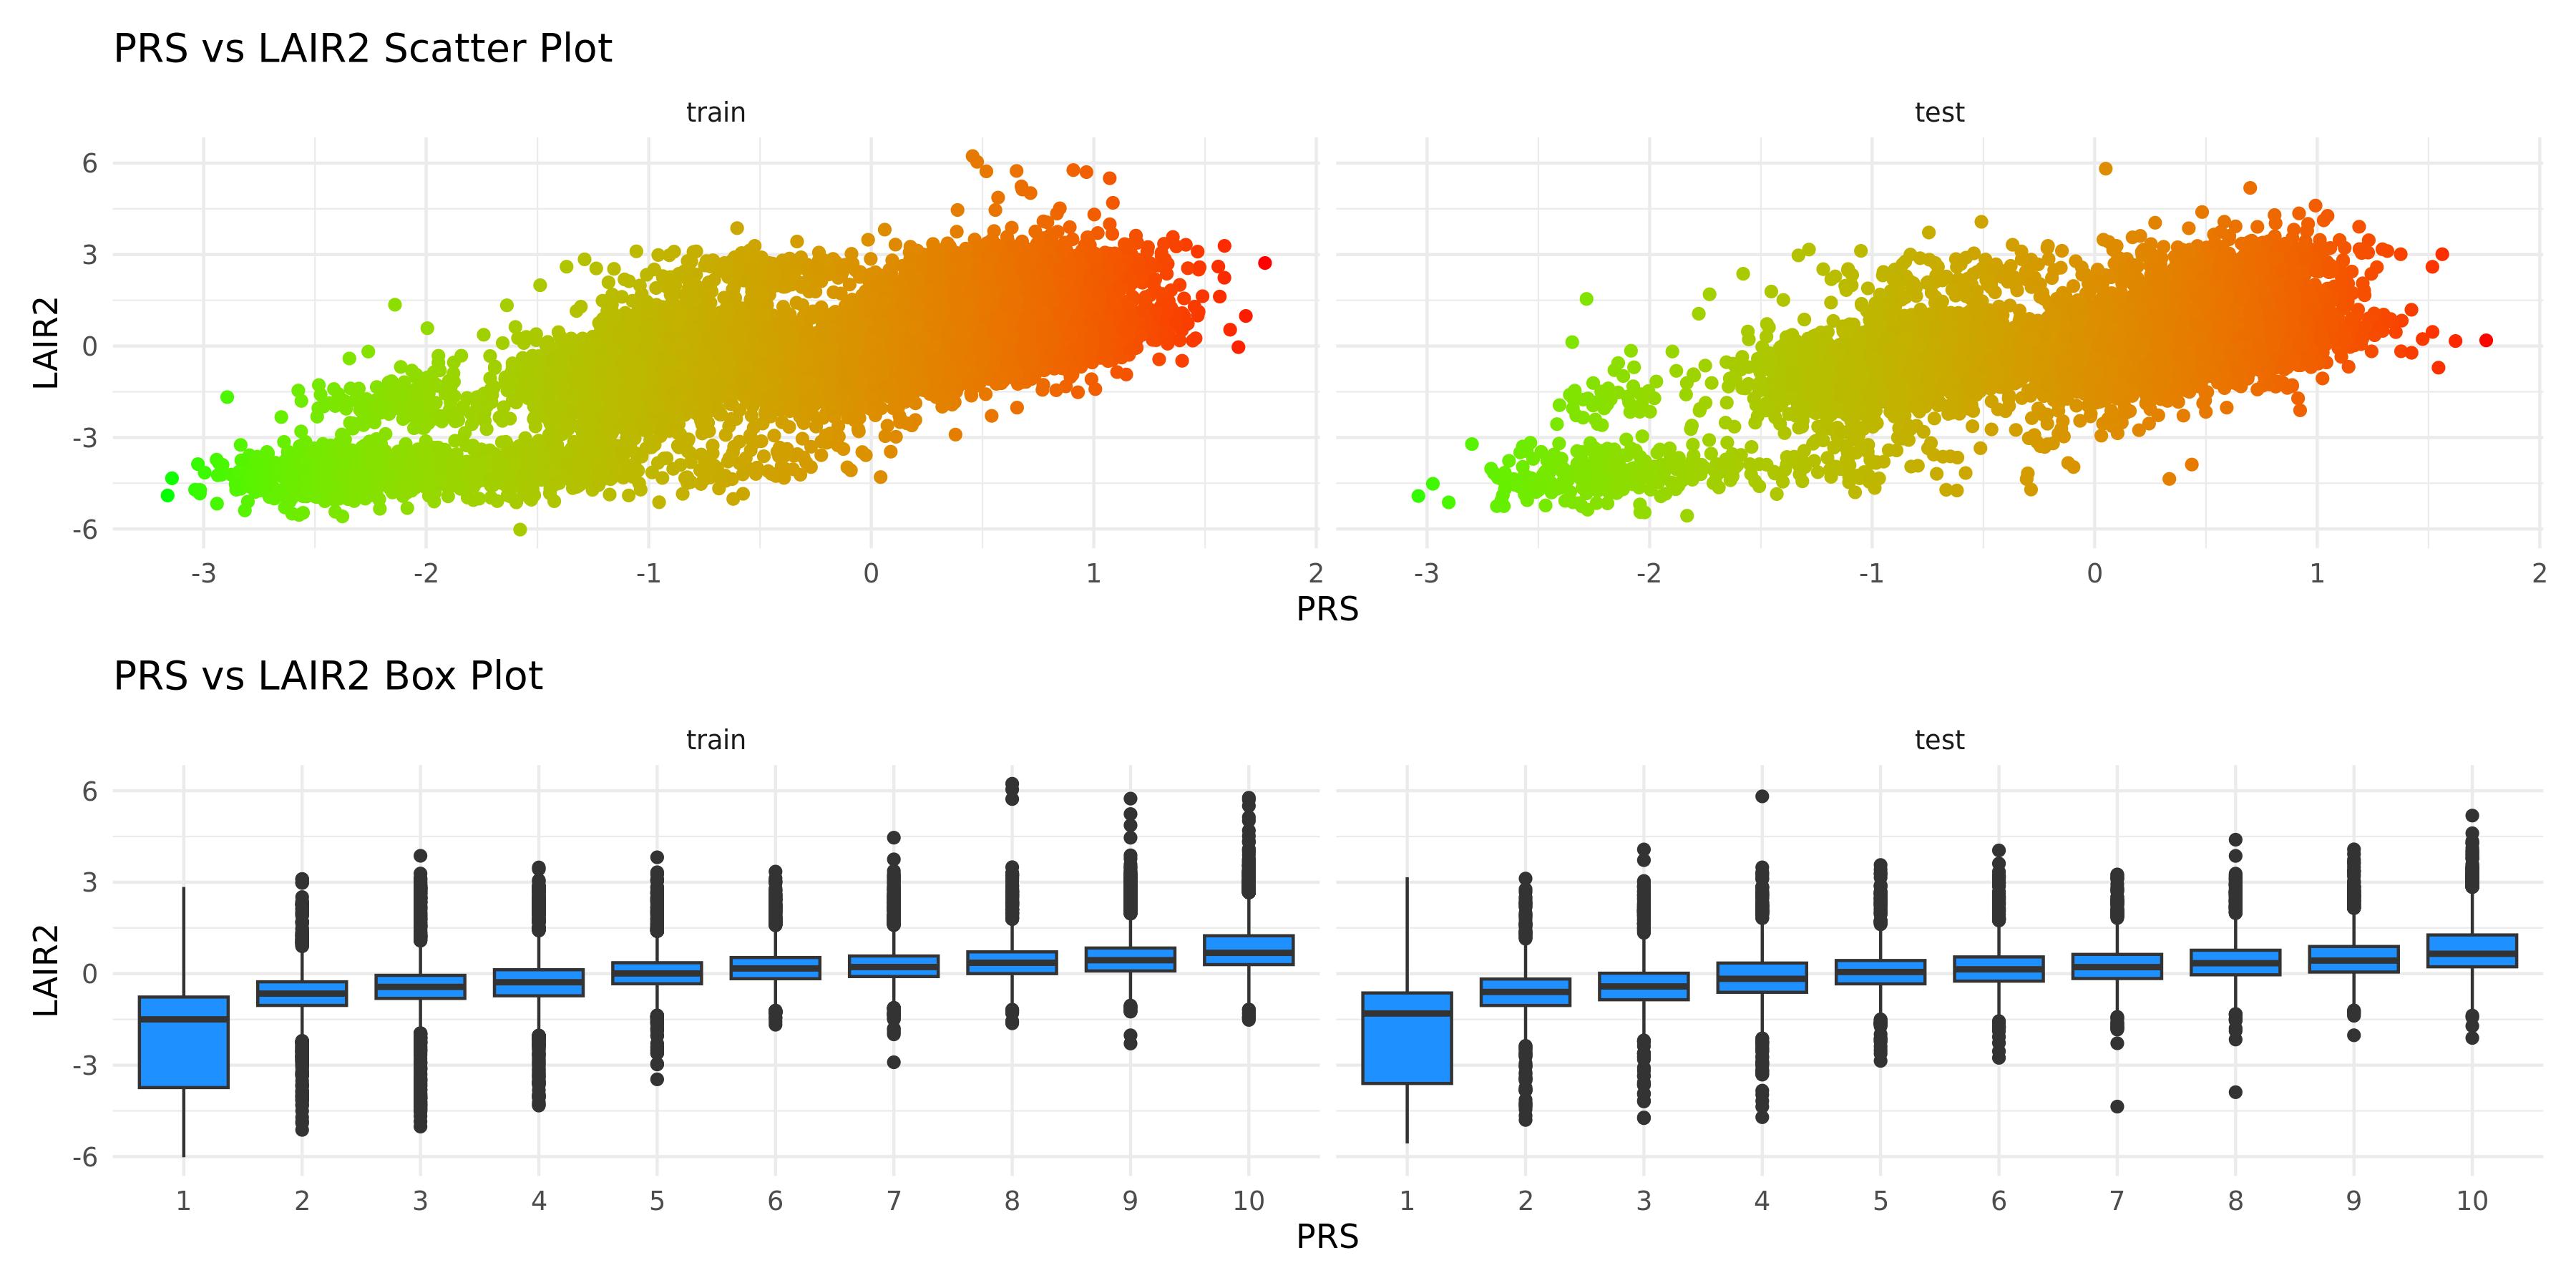
PRS scatter and box plotsenlarge ⤢
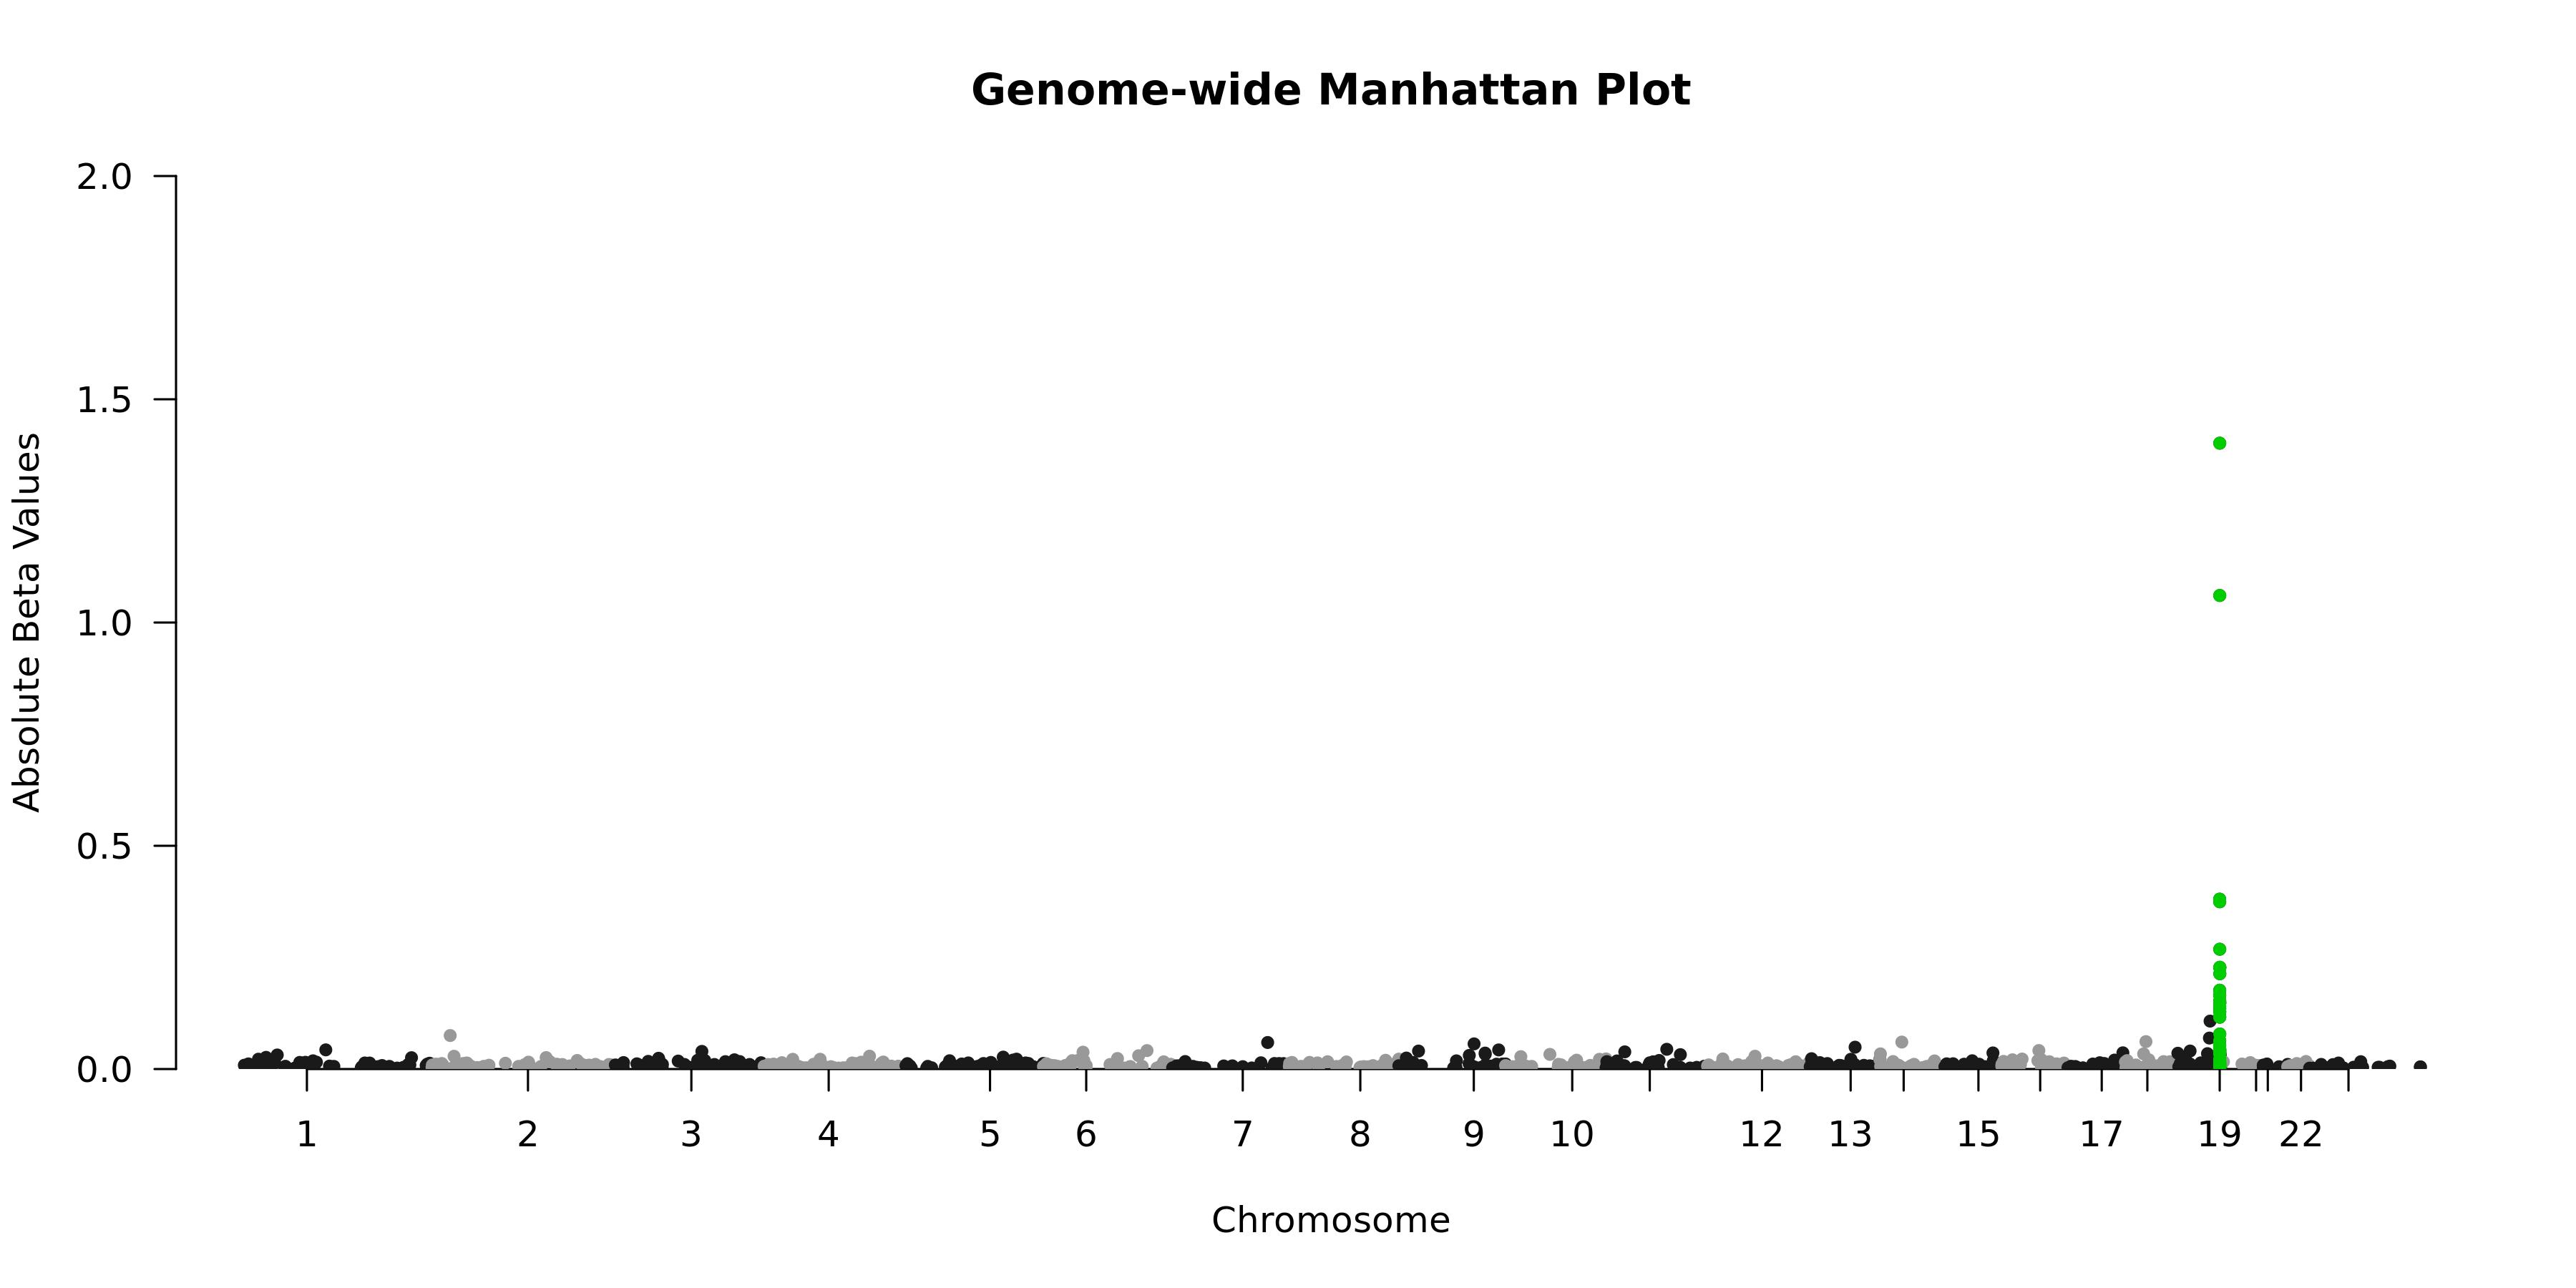
Genome-wide Manhattan Plotenlarge ⤢
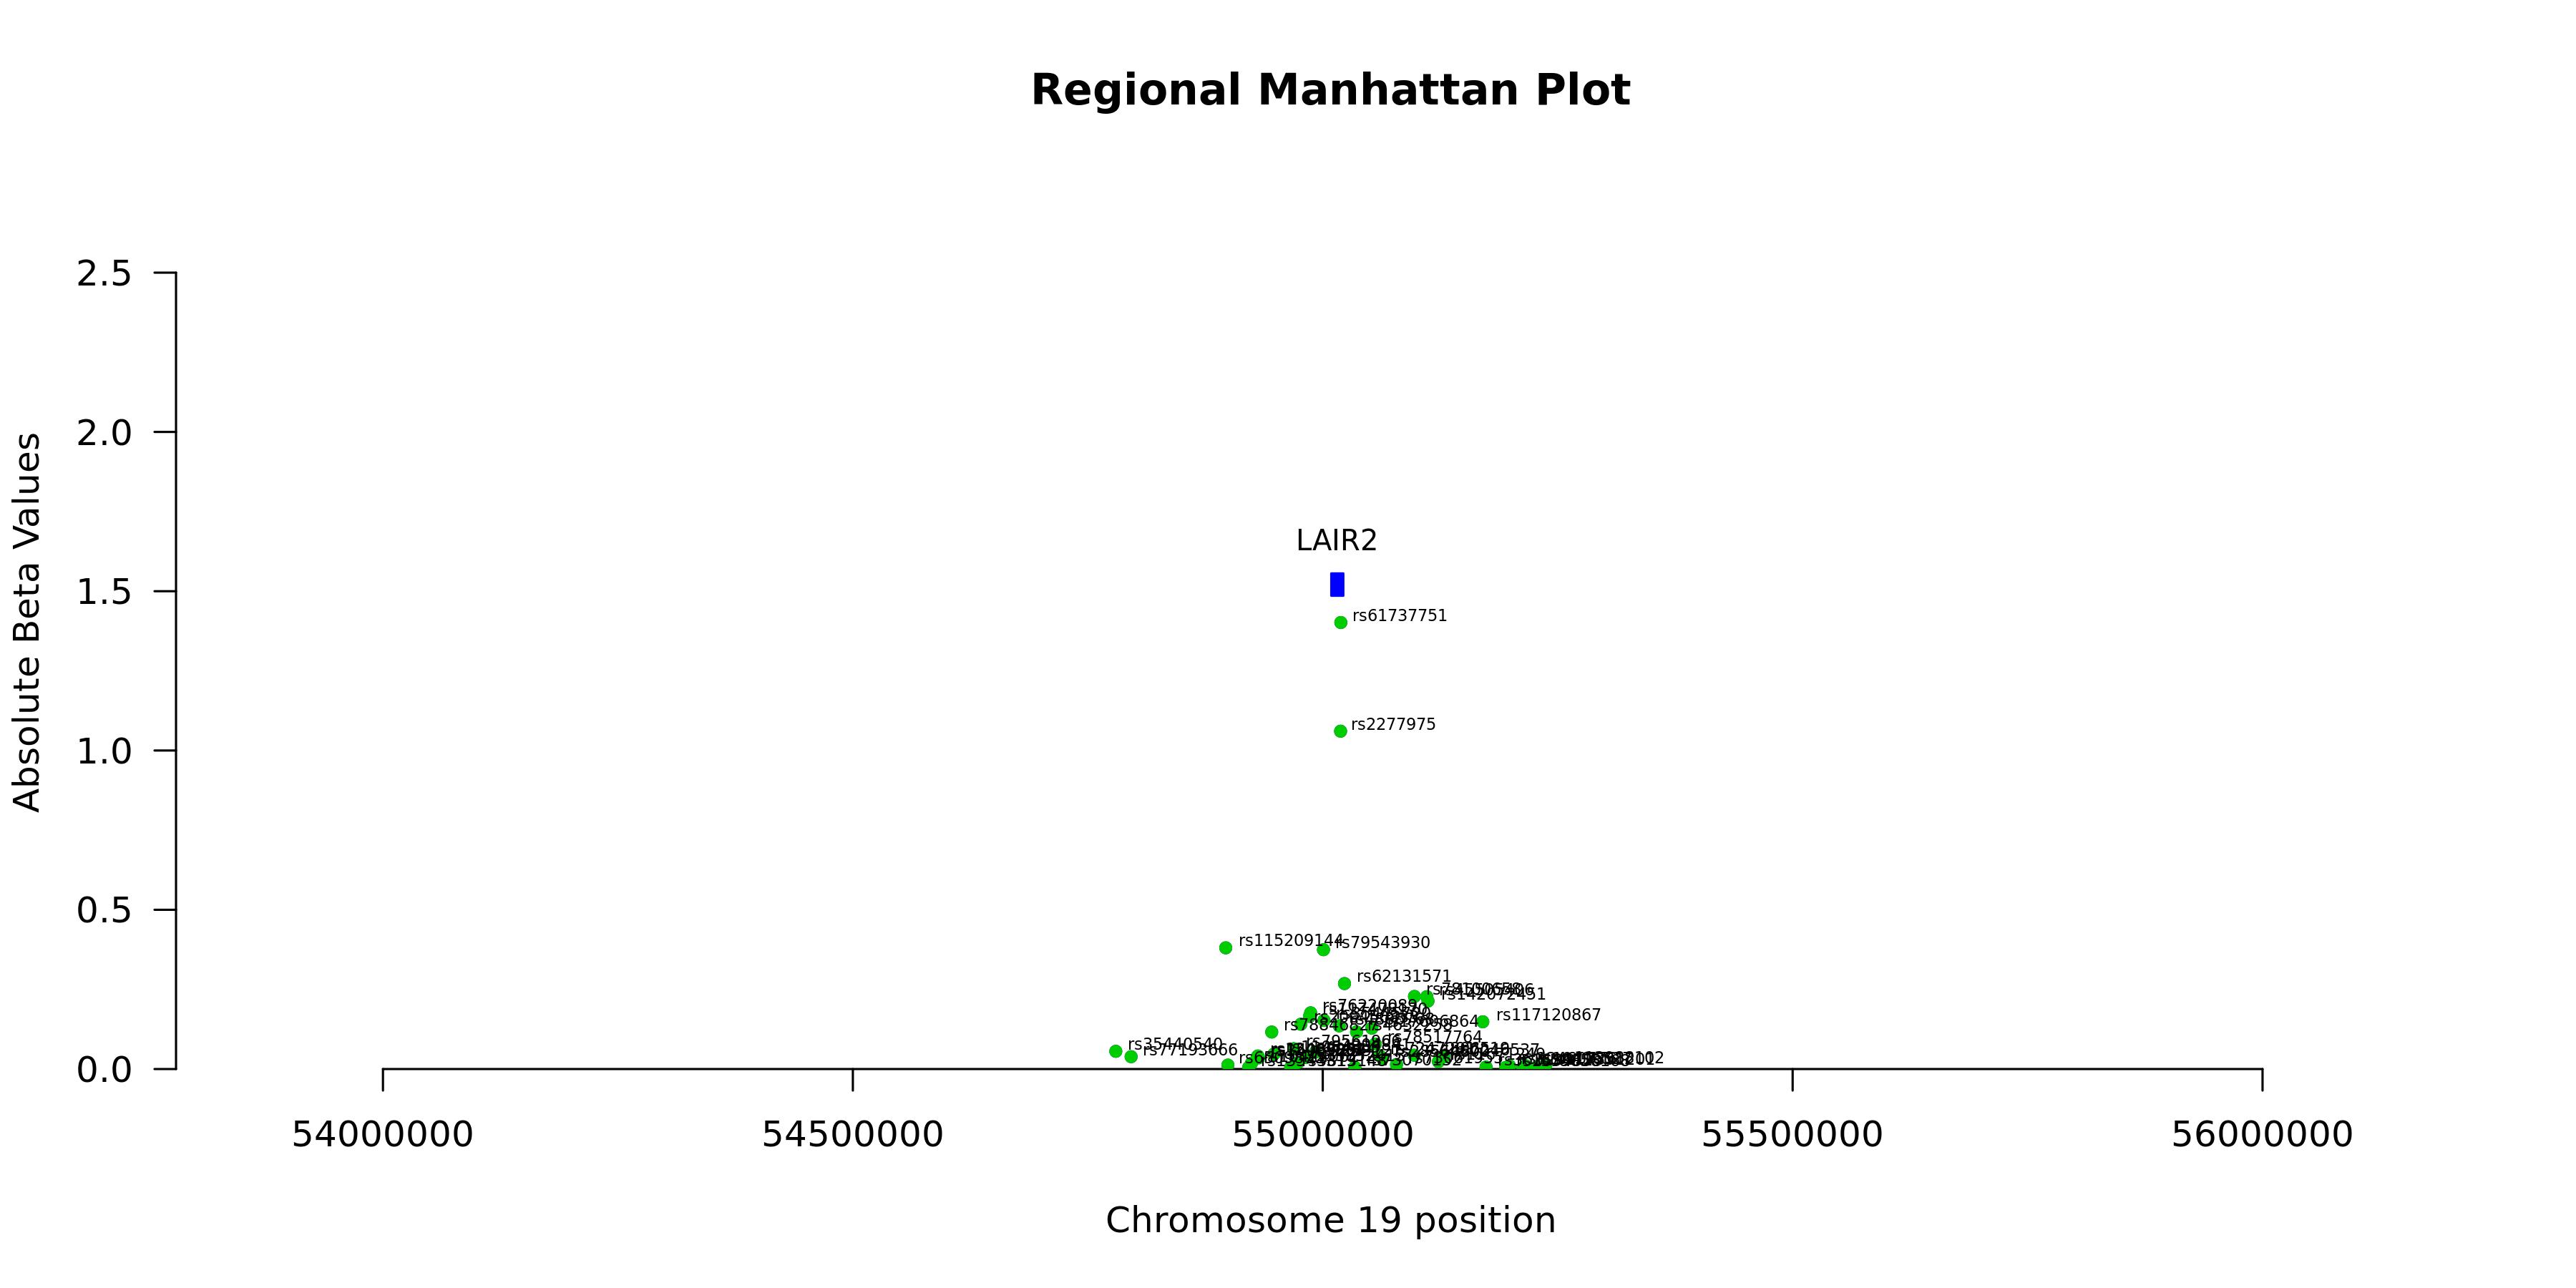
Regional Manhattan Plotenlarge ⤢
Model record
Field
Value
Gene
LAIR2
test_n
10538
sparsity
919
pearson_coefficent
0.682855836327322
SE
0.00724172337314527
P_corr
0
R2 Covariate Model
0.0144
R2 Full Model
0.4752
P
0
P_full
0
n_cis_pqtl
53
max_cis_pqtl
rs61737751
rank_max_cis_pqtl
1
mean_pqtl_beta
0.119136132846791
mean_nopqtl_beta
0.00882457793693777
percentage_pqtl
0.0576713819368879
percentage_nopqtl
0.942328618063112
cis and genome-wide metrics
Field
Value
Gene
LAIR2
test_n_genomewide
10538
sparsity_genomewide
919
pearson_coefficent_genomewide
0.682855836327322
SE_genomewide
0.00724172337314527
P_corr_genomewide
0
R2_covariate_model_genomewide
0.0144276174073544
R2_full_model_genomewide
0.475237174610379
P_genomewide
0
P_full_genomewide
0
n_cis_pqtl
53
max_cis_pqtl
rs61737751
rank_max_cis_pqtl
1
mean_pqtl_beta
0.119136132846791
mean_nopqtl_beta
0.00882457793693777
percentage_pqtl
0.0576713819368879
percentage_nopqtl
0.942328618063112
test_n_cis
10538
sparsity_cis
53
pearson_coefficent_cis
0.659196317622013
SE_cis
0.00745403005754665
P_corr_cis
0
R2_covariate_model_cis
0.0144276174073544
R2_full_model_cis
0.444587993226782
P_cis
0
P_full_cis
0