KIT
Olink Explore plasma protein · SNPBoost PRS model
R2 Full Model
0.277
pearson_coefficent
0.4715
sparsity
1672
n_cis_pqtl
58
max_cis_pqtl
rs172629
Diagnostics
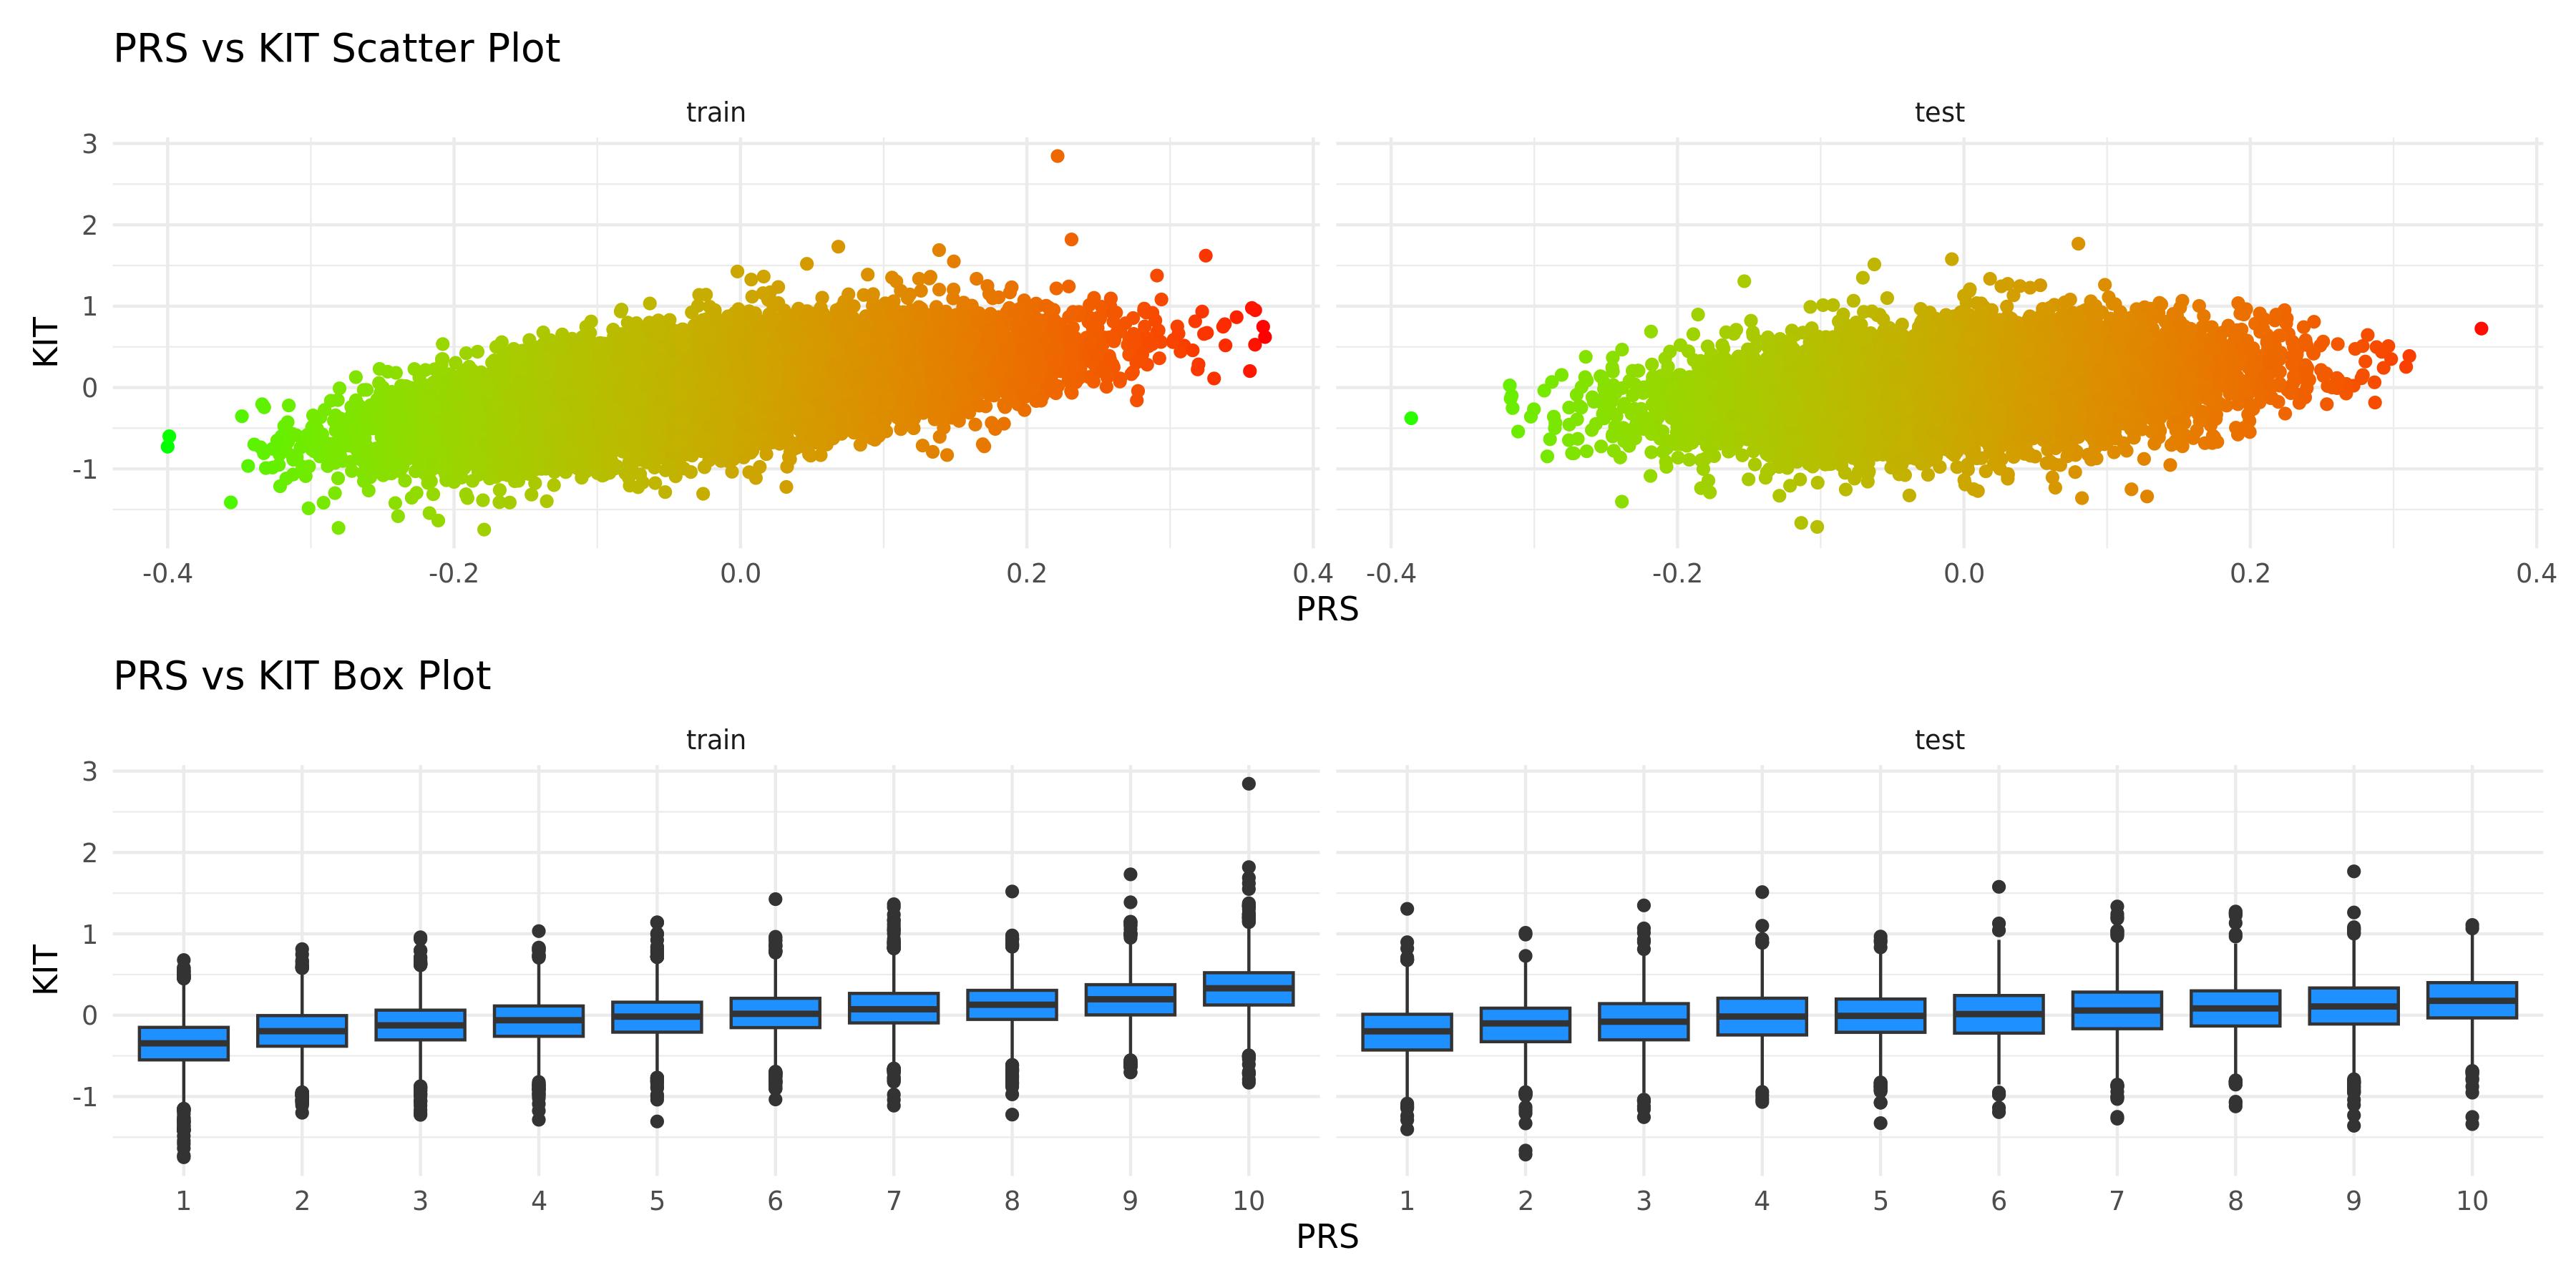
PRS scatter and box plotsenlarge ⤢
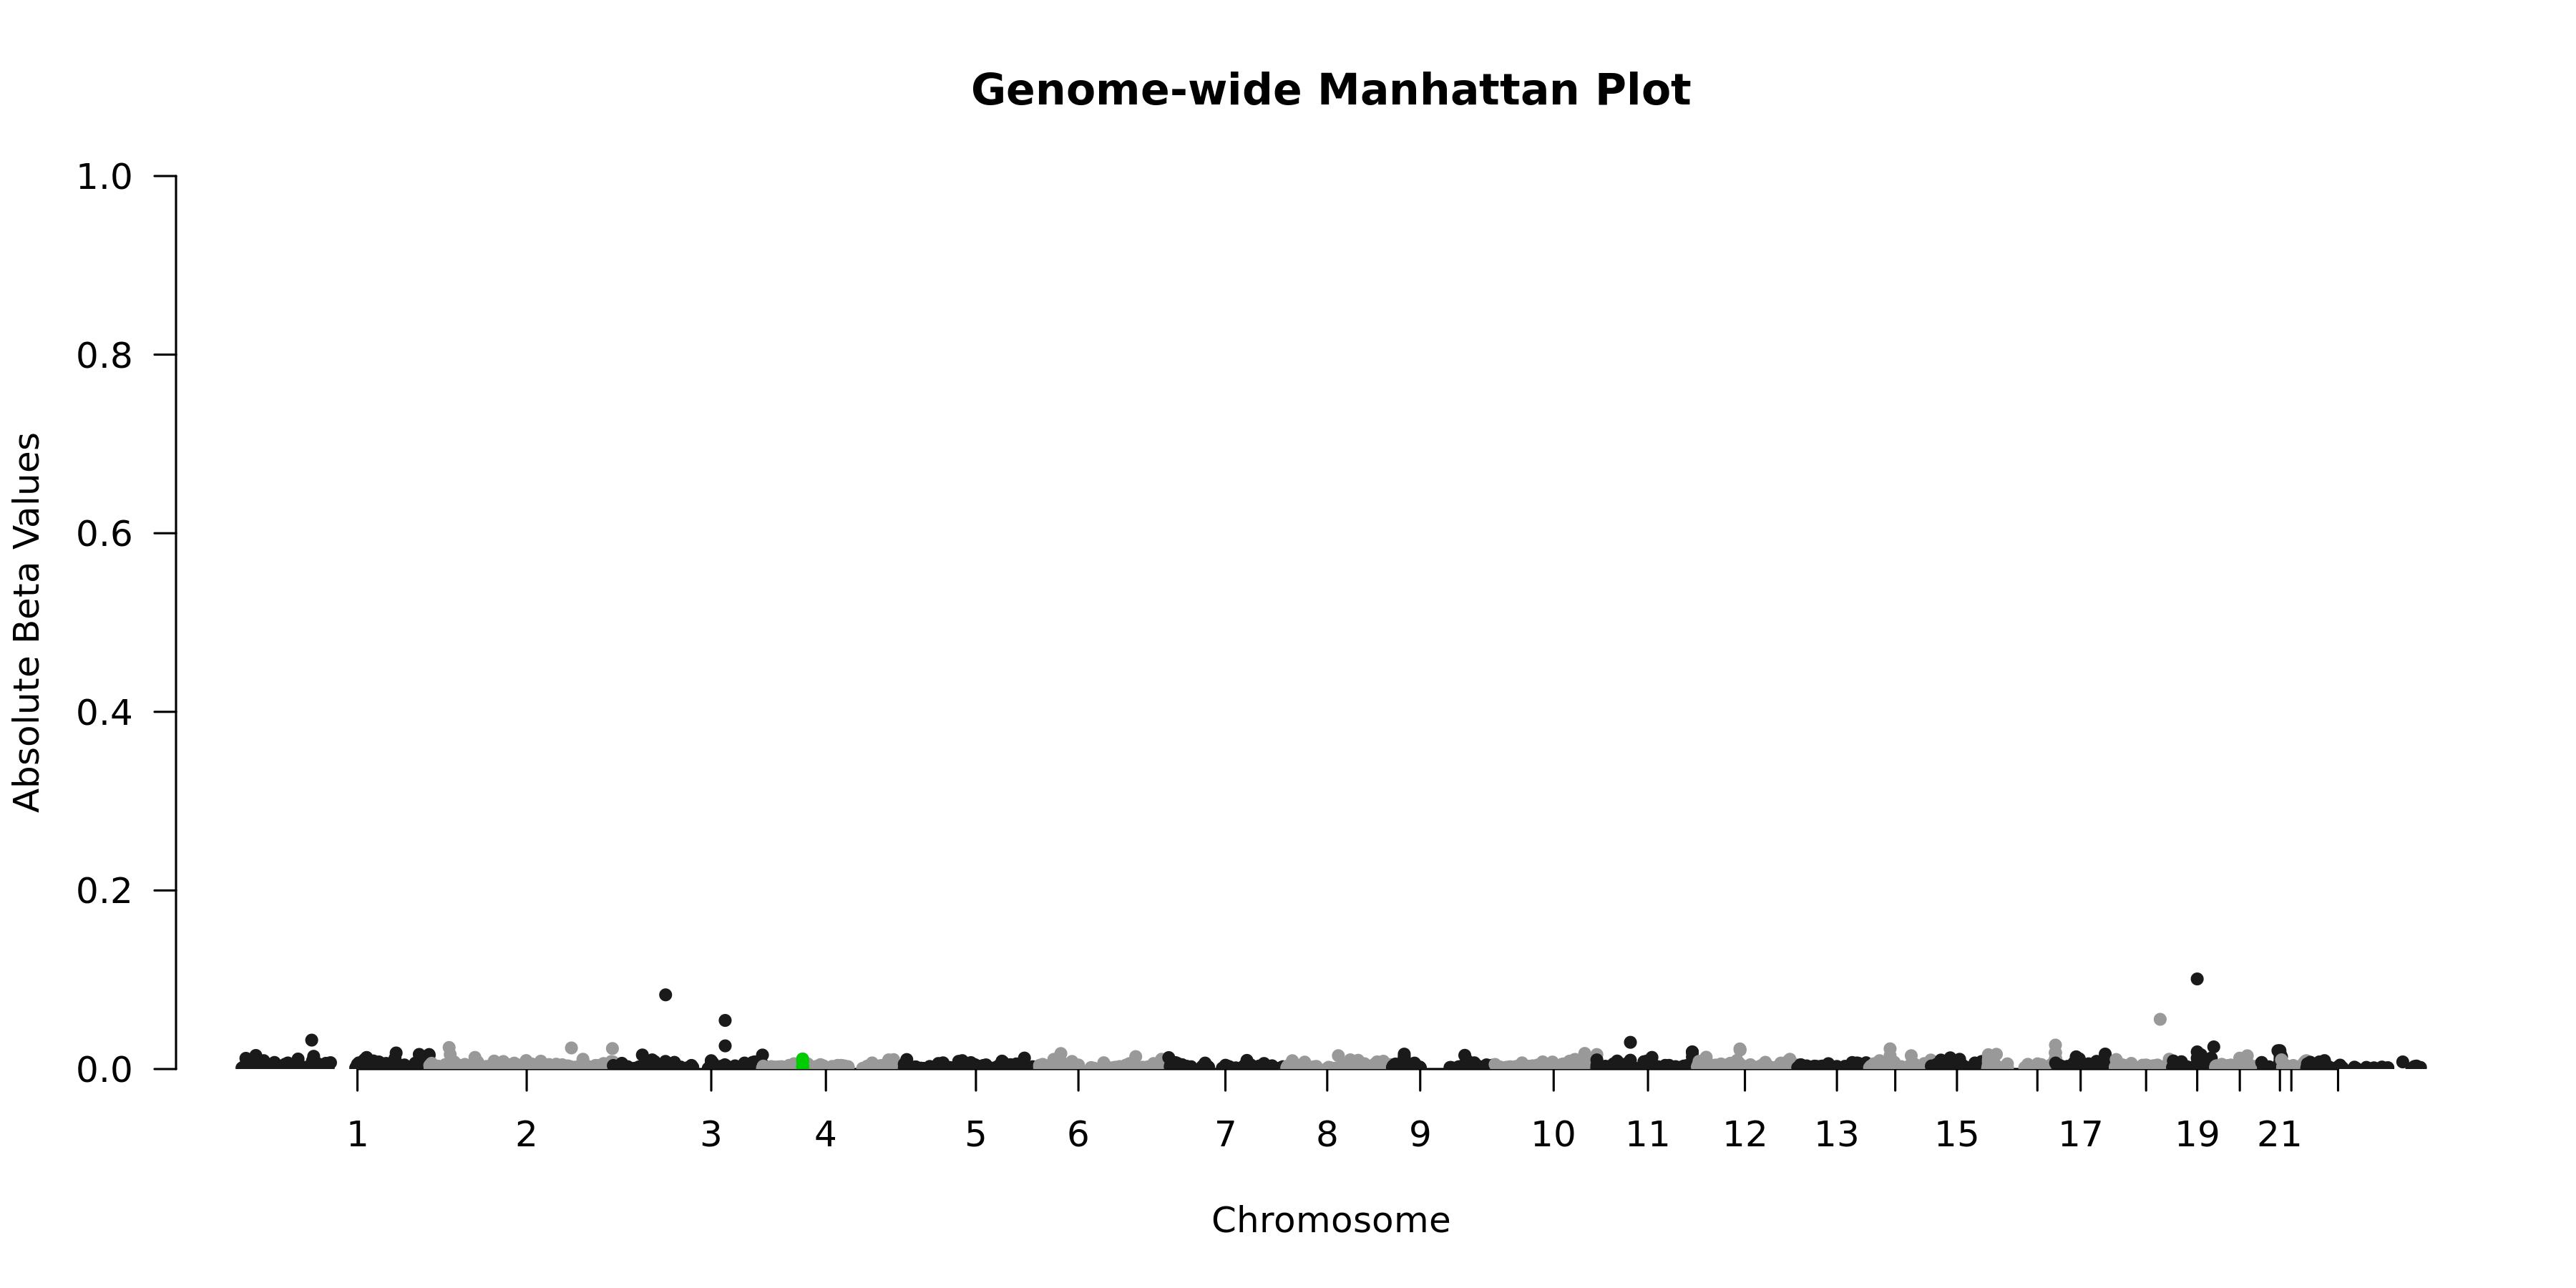
Genome-wide Manhattan Plotenlarge ⤢
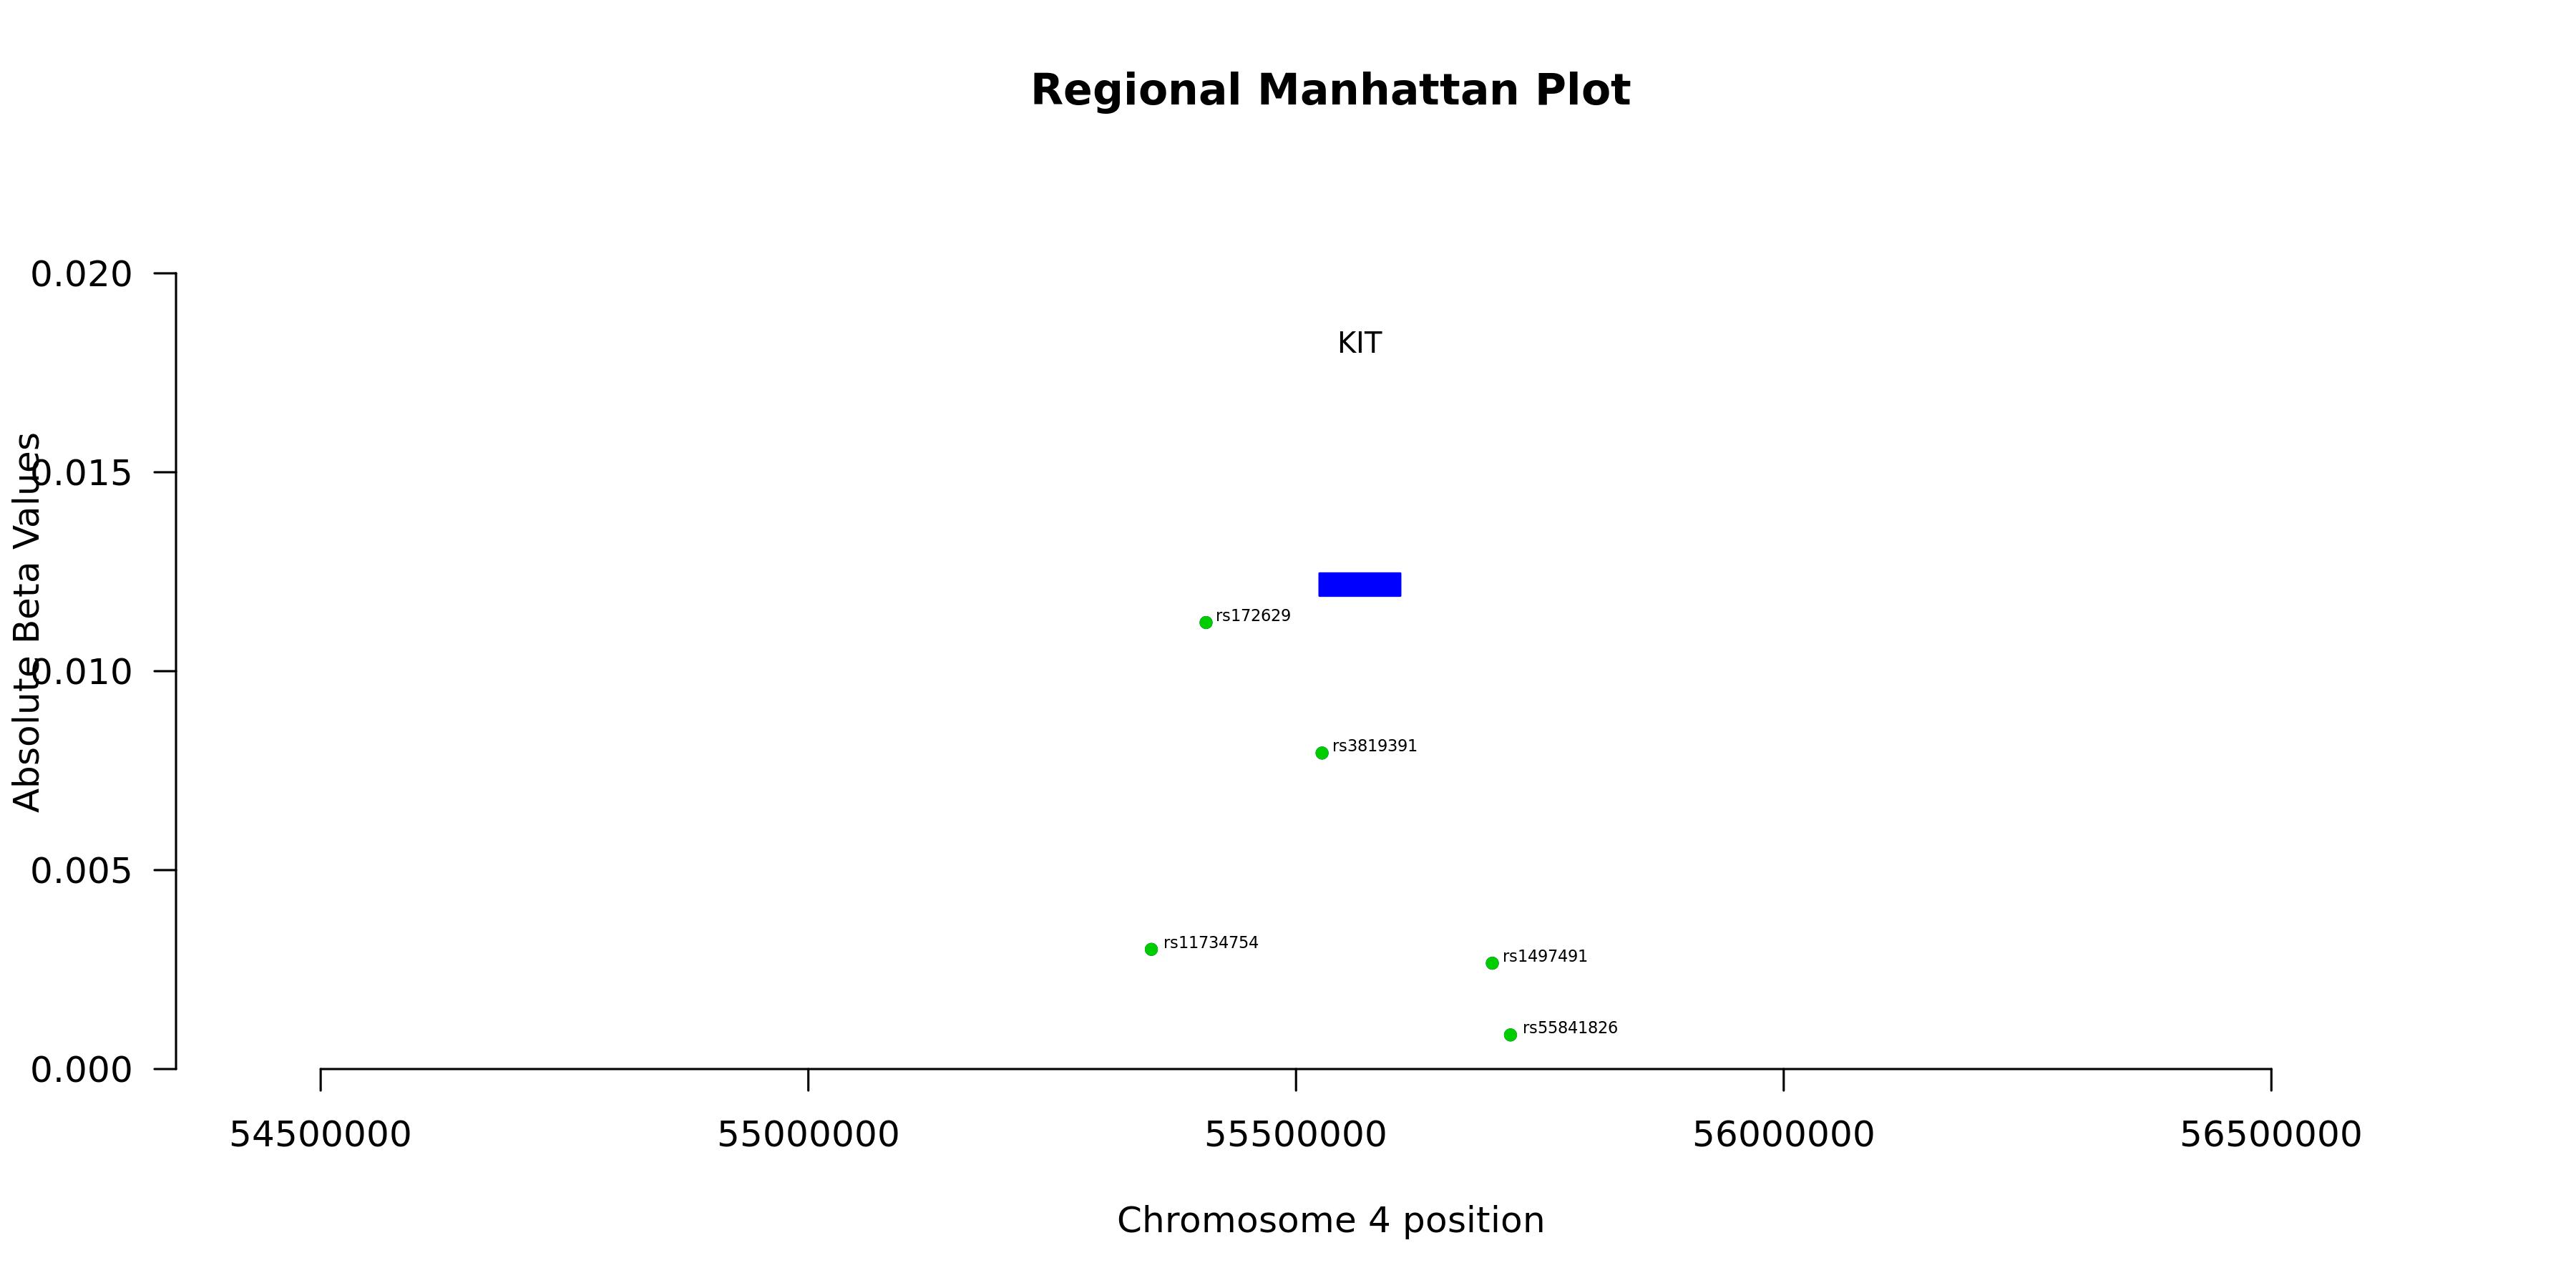
Regional Manhattan Plotenlarge ⤢
Model record
Field
Value
Gene
KIT
test_n
10538
sparsity
1672
pearson_coefficent
0.471505100210847
SE
0.00869897550320761
P_corr
0
R2 Covariate Model
0.0662
R2 Full Model
0.277
P
0
P_full
0
n_cis_pqtl
58
max_cis_pqtl
rs172629
rank_max_cis_pqtl
70
mean_pqtl_beta
0.00294889236779485
mean_nopqtl_beta
0.00359208504029901
percentage_pqtl
0.034688995215311
percentage_nopqtl
0.965311004784689
cis and genome-wide metrics
Field
Value
Gene
KIT
test_n_genomewide
10538
sparsity_genomewide
1672
pearson_coefficent_genomewide
0.471505100210847
SE_genomewide
0.00869897550320761
P_corr_genomewide
0
R2_covariate_model_genomewide
0.0661714873686231
R2_full_model_genomewide
0.277042811163166
P_genomewide
0
P_full_genomewide
0
n_cis_pqtl
58
max_cis_pqtl
rs172629
rank_max_cis_pqtl
70
mean_pqtl_beta
0.00294889236779485
mean_nopqtl_beta
0.00359208504029901
percentage_pqtl
0.034688995215311
percentage_nopqtl
0.965311004784689
test_n_cis
10538
sparsity_cis
58
pearson_coefficent_cis
0.0982174823345952
SE_cis
0.00981661828568691
P_corr_cis
1.85068992044483e-23
R2_covariate_model_cis
0.0661714873686231
R2_full_model_cis
0.0737038556102739
P_cis
2.00315253159221e-175
P_full_cis
7.73651107553747e-68