IL15RA
Olink Explore plasma protein · SNPBoost PRS model
R2 Full Model
0.1439
pearson_coefficent
0.3087
sparsity
149
n_cis_pqtl
17
max_cis_pqtl
rs3181147
Diagnostics
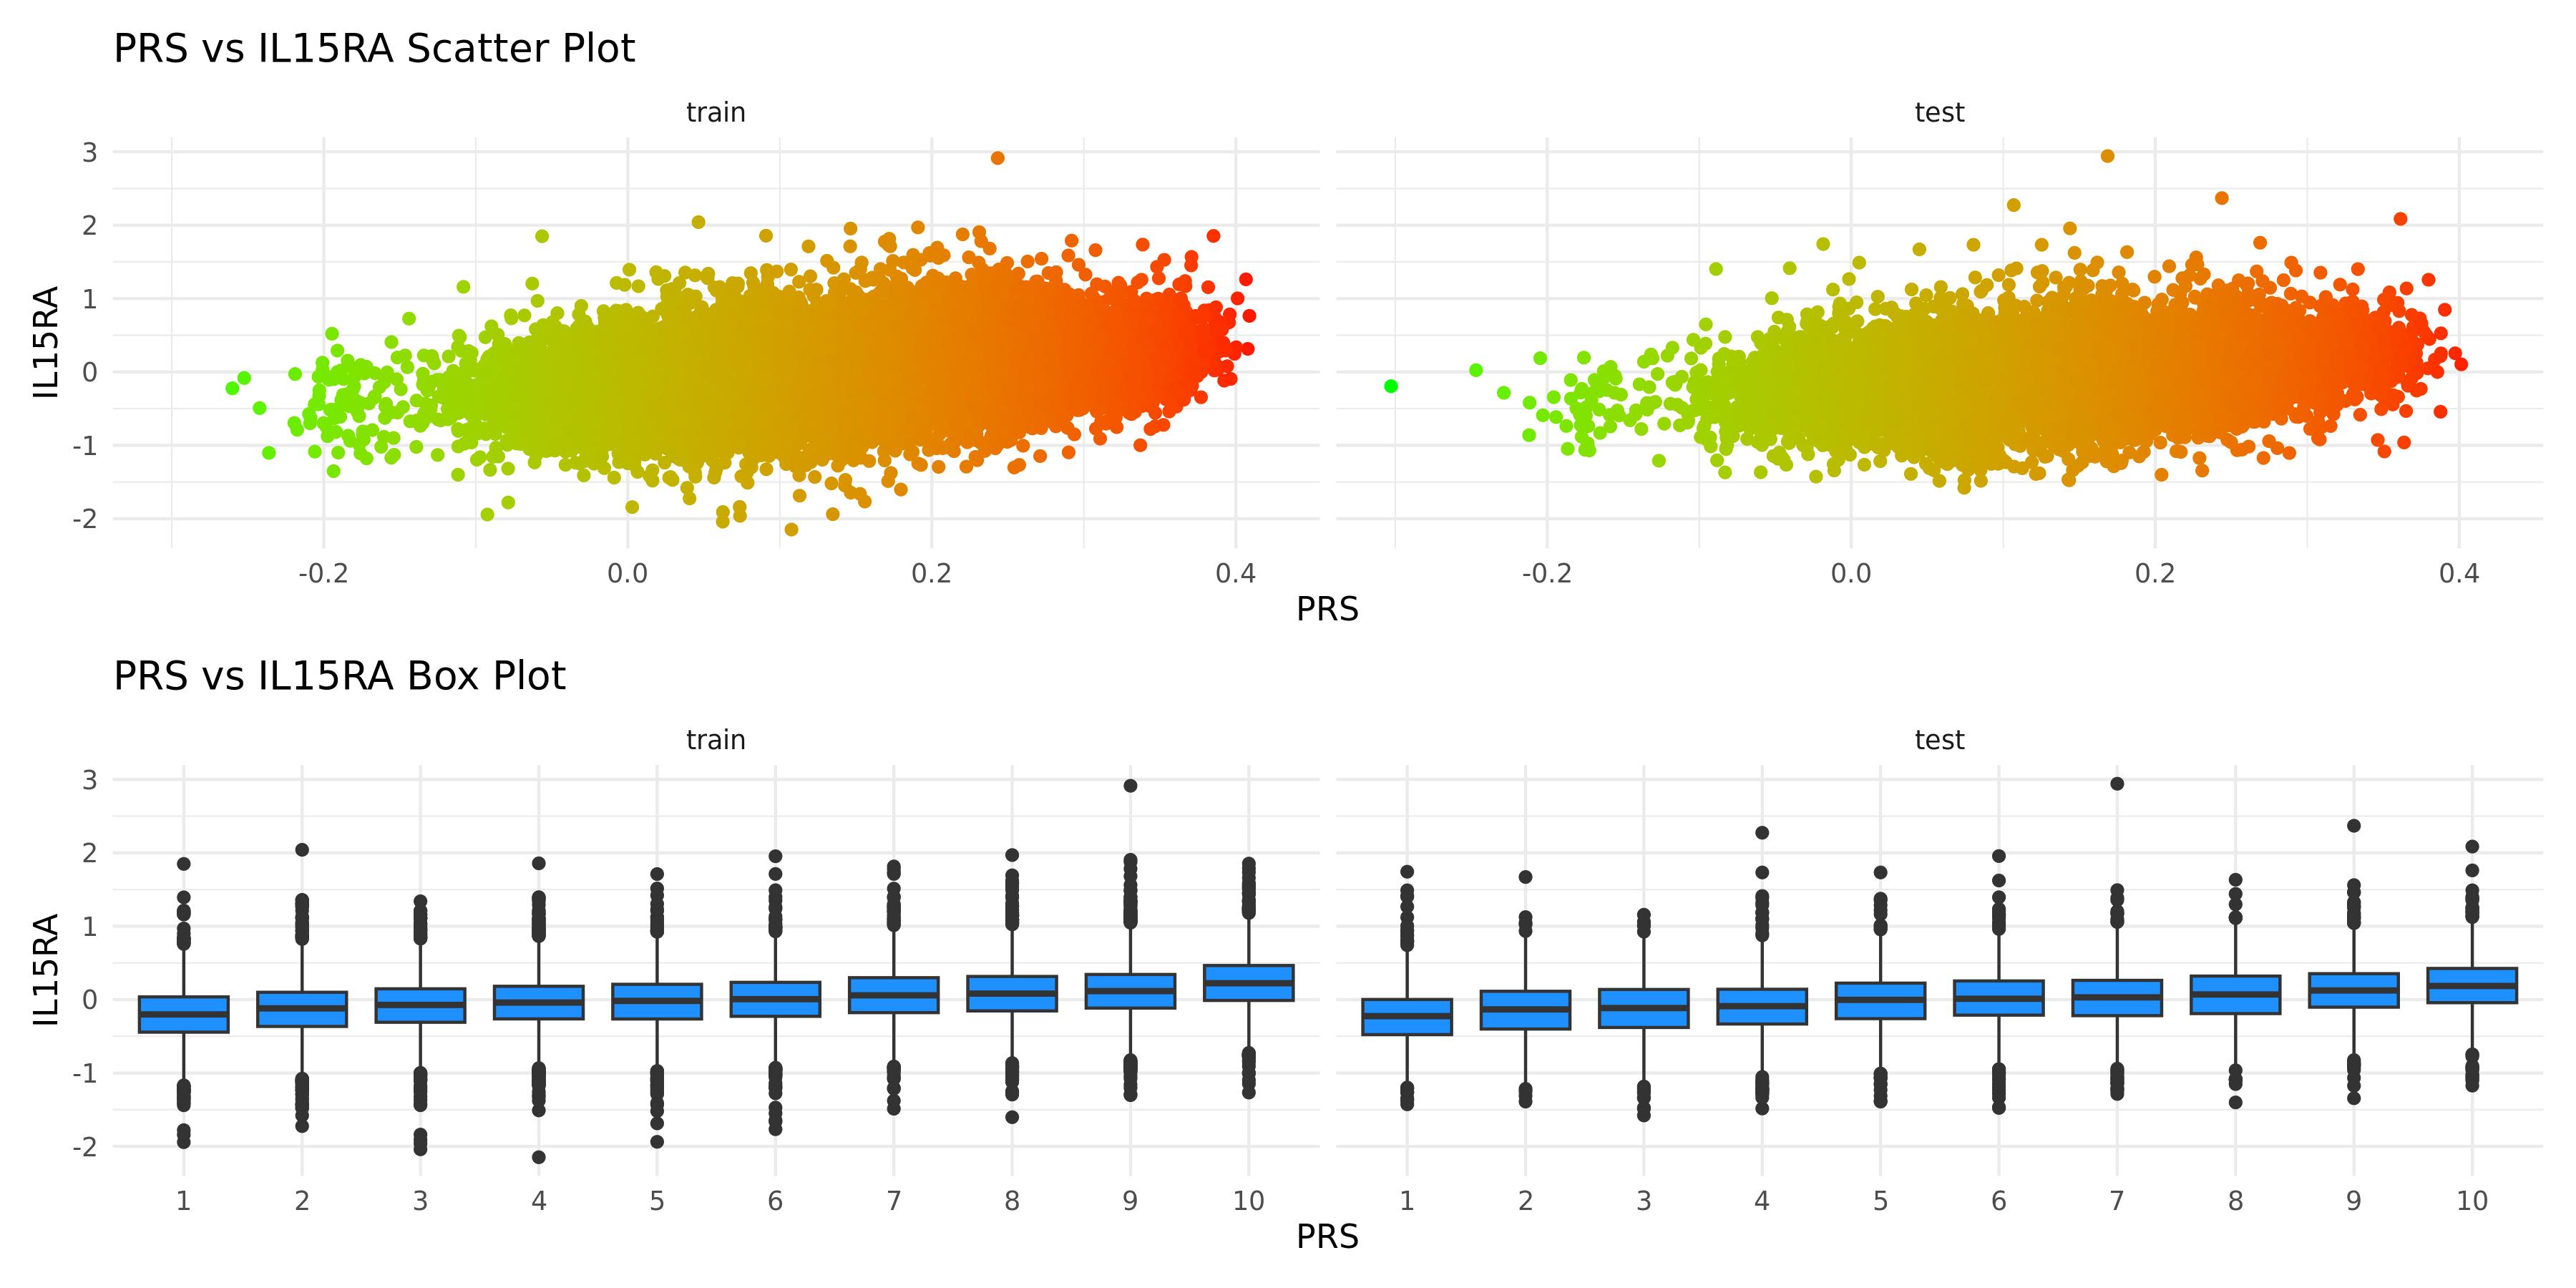
PRS scatter and box plotsenlarge ⤢
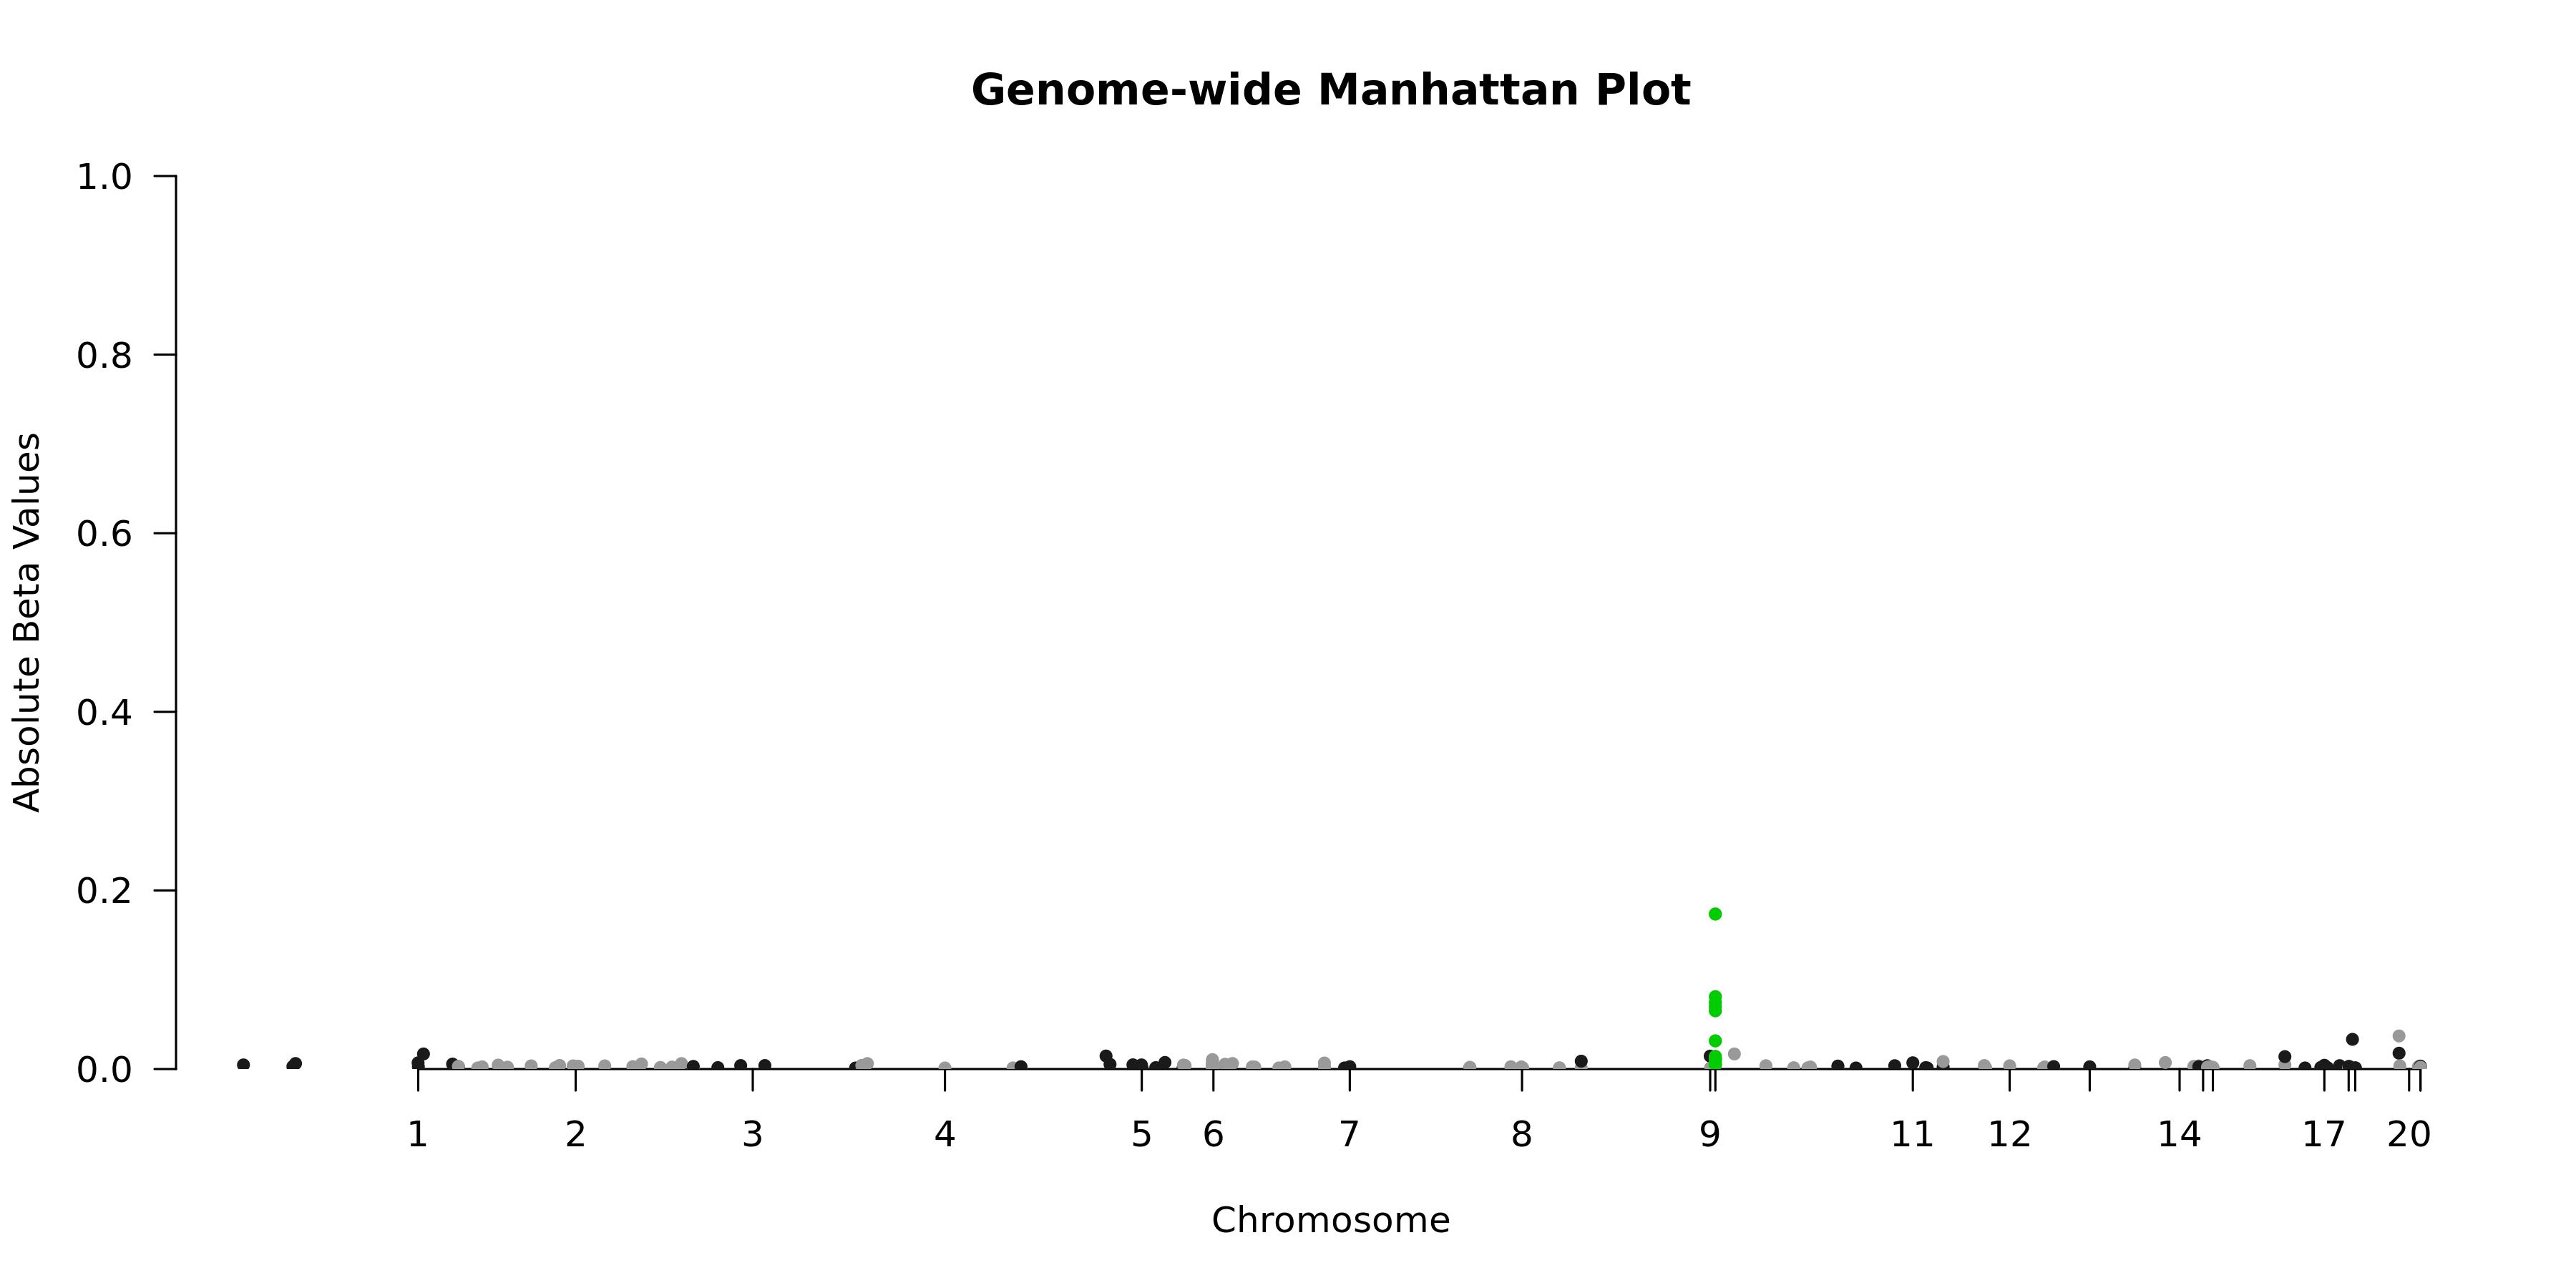
Genome-wide Manhattan Plotenlarge ⤢
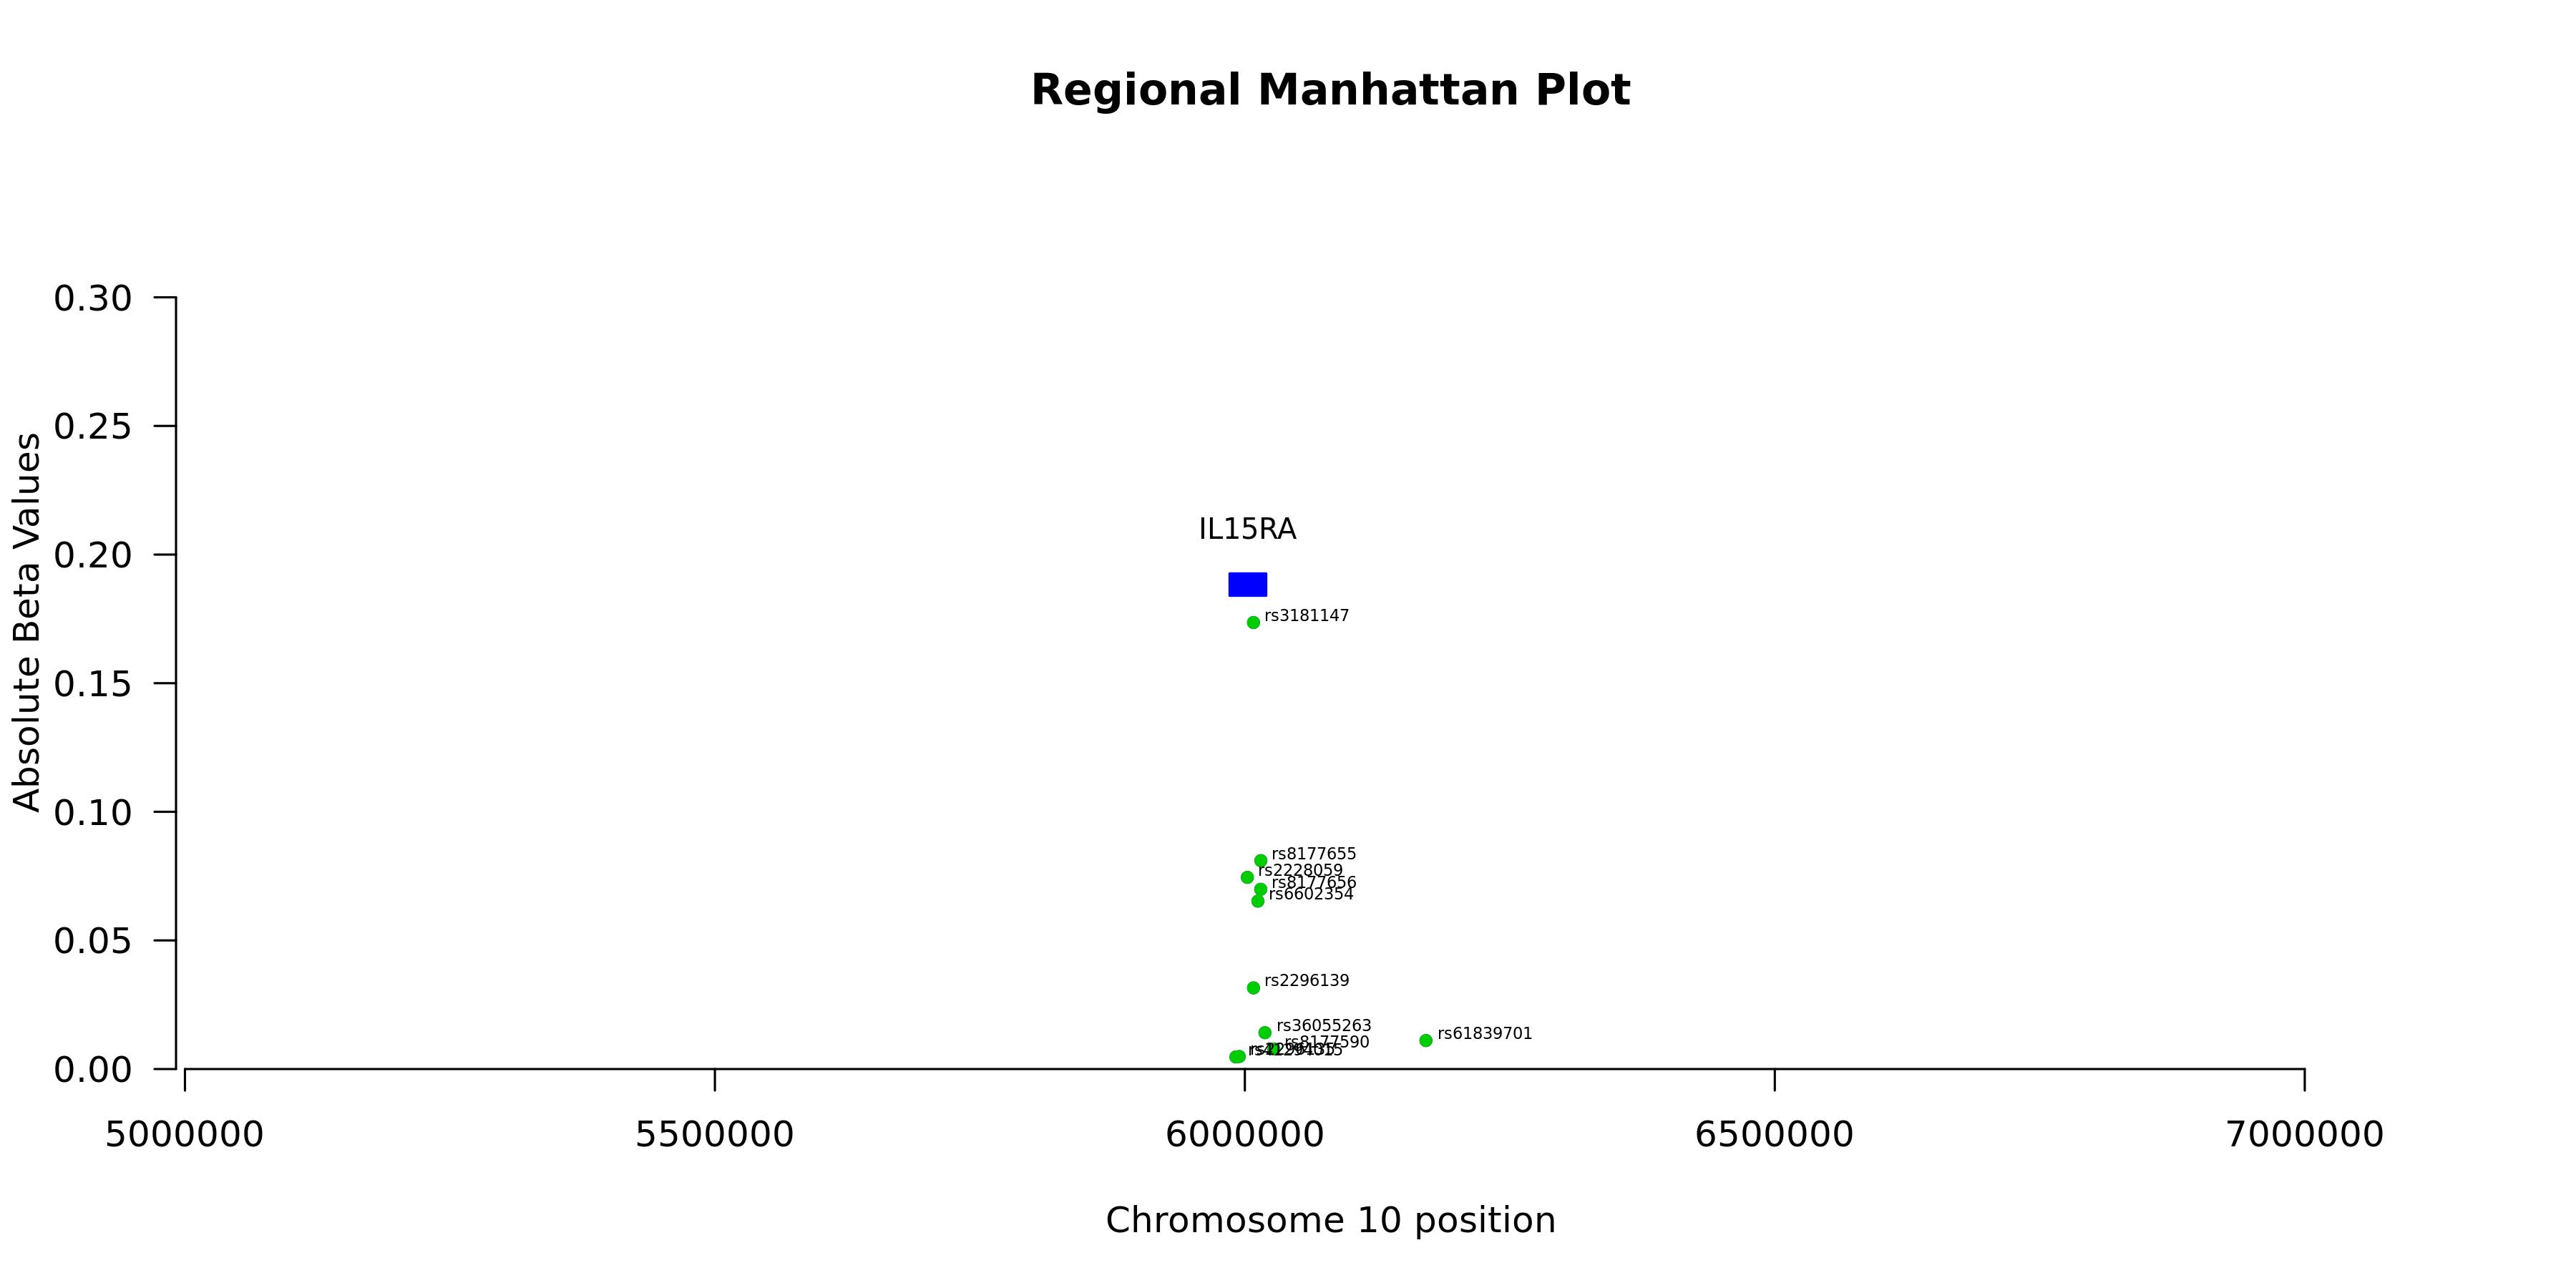
Regional Manhattan Plotenlarge ⤢
Model record
Field
Value
Gene
IL15RA
test_n
10538
sparsity
149
pearson_coefficent
0.308650912882207
SE
0.00947487362459898
P_corr
2.09278334450626e-221
R2 Covariate Model
0.0547
R2 Full Model
0.1439
P
0
P_full
0
n_cis_pqtl
17
max_cis_pqtl
rs3181147
rank_max_cis_pqtl
1
mean_pqtl_beta
0.0333368655731376
mean_nopqtl_beta
0.00402688299195198
percentage_pqtl
0.114093959731544
percentage_nopqtl
0.885906040268456
cis and genome-wide metrics
Field
Value
Gene
IL15RA
test_n_genomewide
10538
sparsity_genomewide
149
pearson_coefficent_genomewide
0.308650912882207
SE_genomewide
0.00947487362459898
P_corr_genomewide
2.09278334450626e-221
R2_covariate_model_genomewide
0.0547306051466786
R2_full_model_genomewide
0.143938640957275
P_genomewide
0
P_full_genomewide
0
n_cis_pqtl
17
max_cis_pqtl
rs3181147
rank_max_cis_pqtl
1
mean_pqtl_beta
0.0333368655731376
mean_nopqtl_beta
0.00402688299195198
percentage_pqtl
0.114093959731544
percentage_nopqtl
0.885906040268456
test_n_cis
10538
sparsity_cis
17
pearson_coefficent_cis
0.282726553715318
SE_cis
0.00955481411098101
P_corr_cis
1.35365656786246e-184
R2_covariate_model_cis
0.0547306051466785
R2_full_model_cis
0.130101740631922
P_cis
1.13880958650513e-307
P_full_cis
0