IL11
Olink Explore plasma protein · SNPBoost PRS model
R2 Full Model
0.0197
pearson_coefficent
0.1366
sparsity
95
n_cis_pqtl
0
max_cis_pqtl
—
Diagnostics
PRS scatter and box plotsenlarge ⤢

Genome-wide Manhattan Plotenlarge ⤢

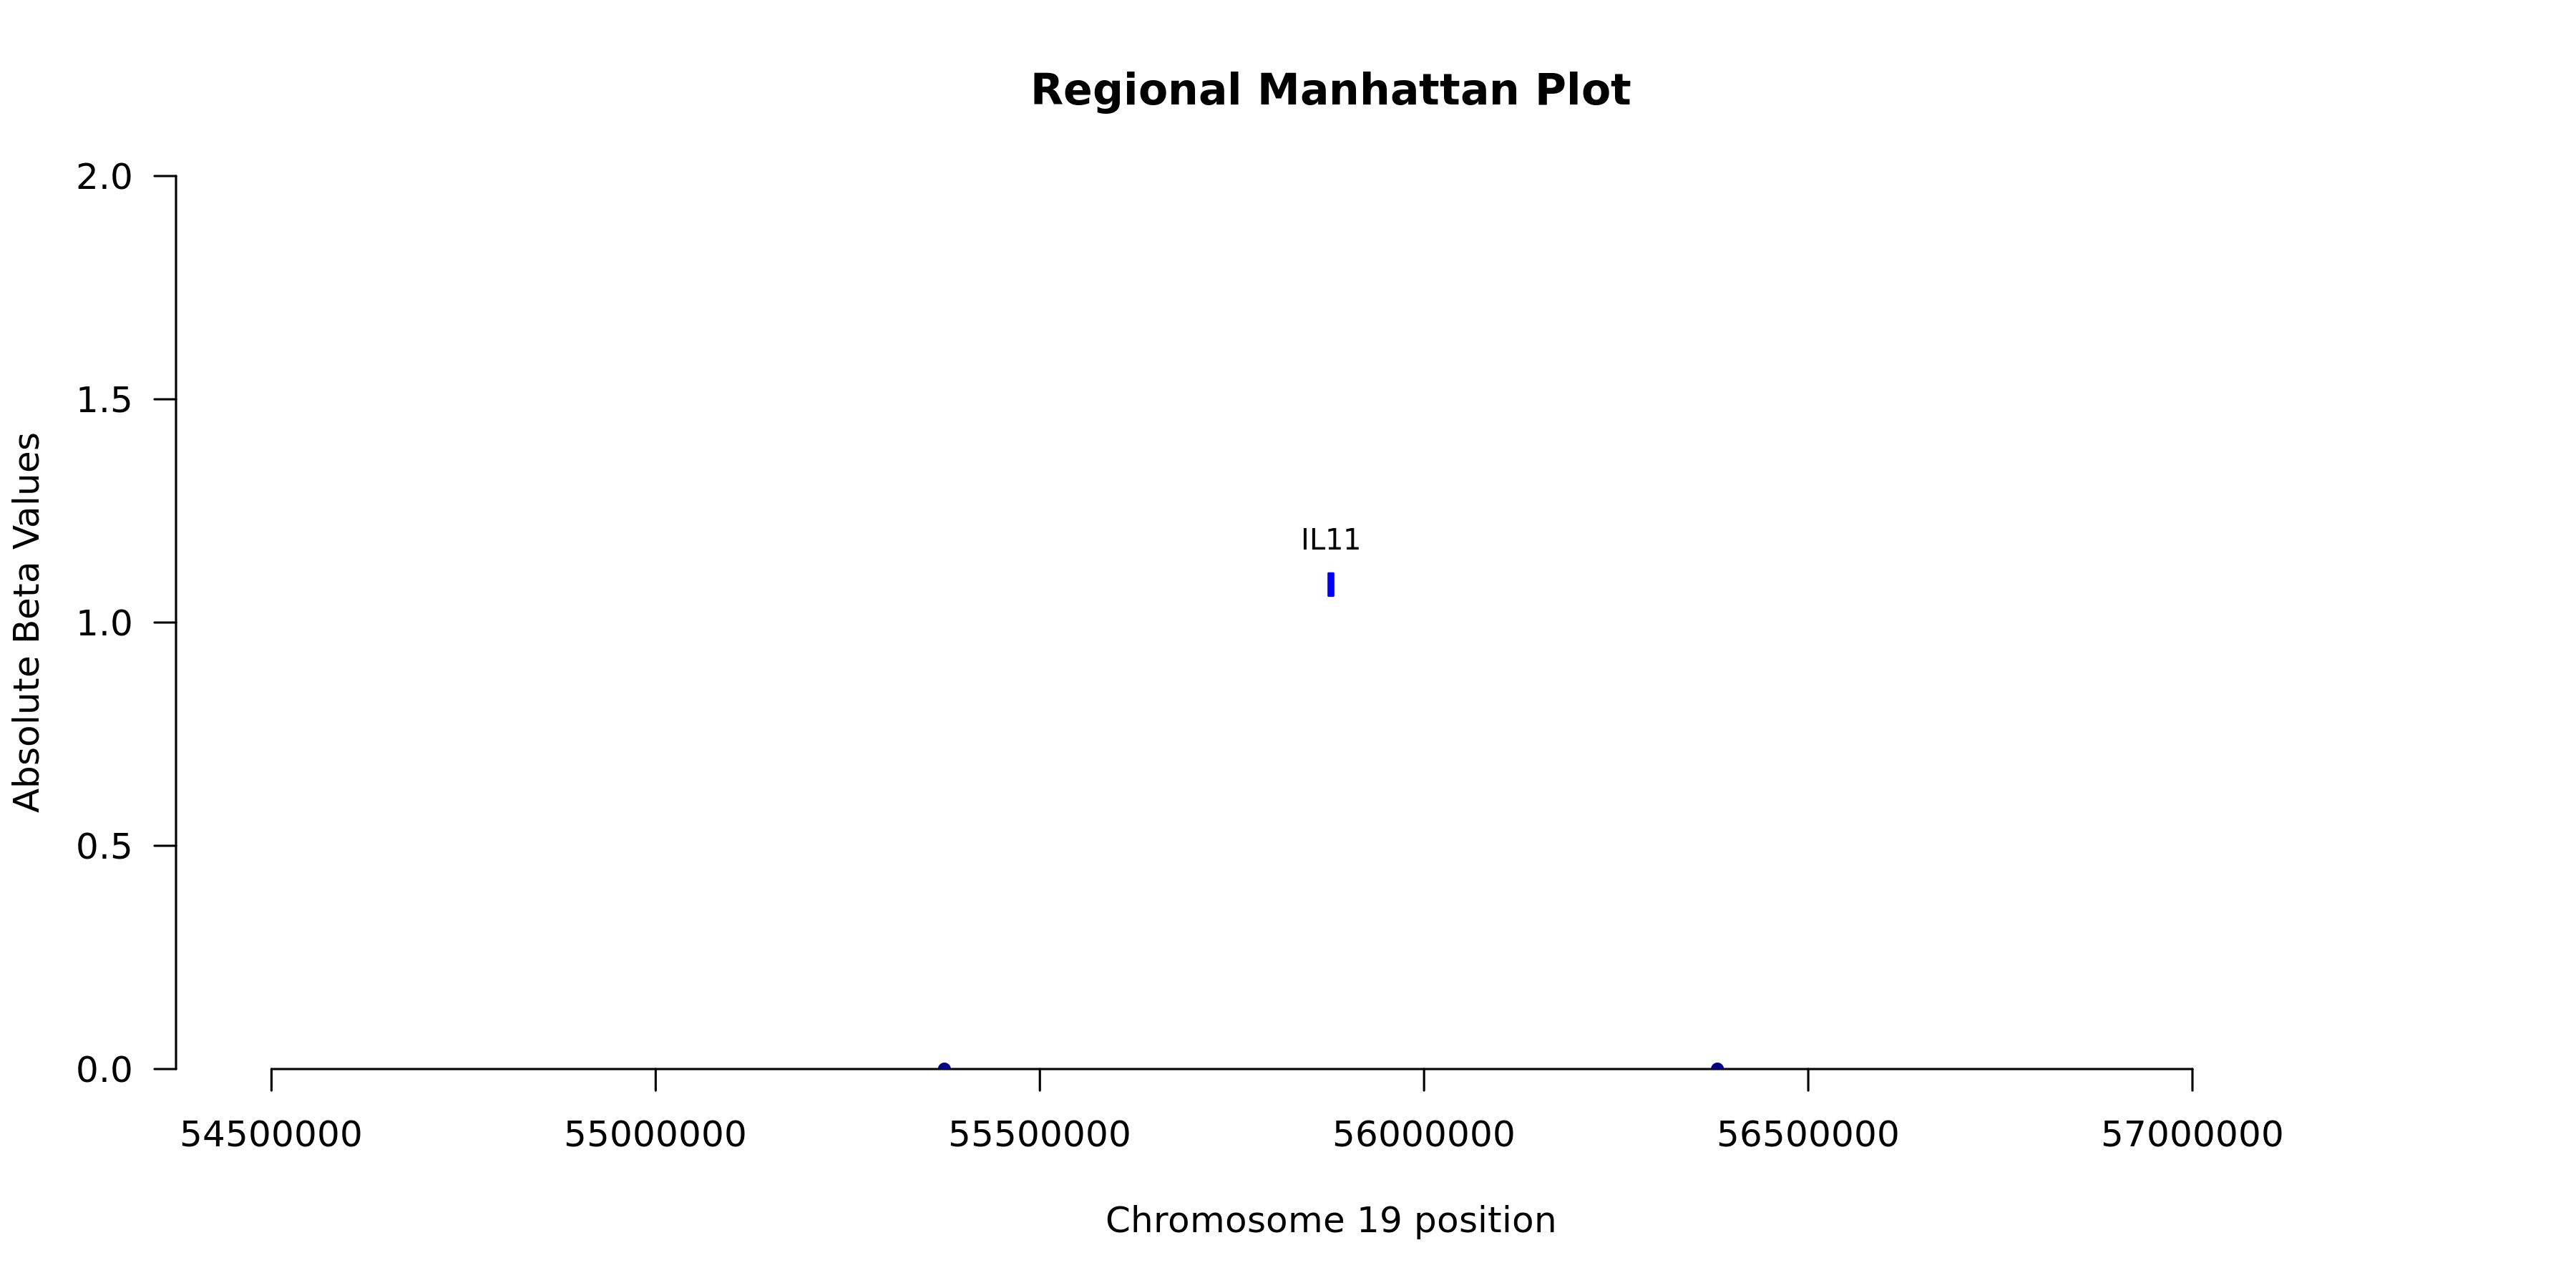
Regional Manhattan Plotenlarge ⤢
Model record
Field
Value
Gene
IL11
test_n
10538
sparsity
95
pearson_coefficent
0.136574877074878
SE
0.00986788749967738
P_corr
3.60899381074088e-43
R2 Covariate Model
6e-04
R2 Full Model
0.0197
P
2.11472401061884e-46
P_full
1.09300350988897e-106
n_cis_pqtl
0
max_cis_pqtl
—
rank_max_cis_pqtl
—
mean_pqtl_beta
—
mean_nopqtl_beta
0.0129792900663253
percentage_pqtl
0
percentage_nopqtl
1
cis and genome-wide metrics
Field
Value
Gene
IL11
test_n_genomewide
10538
sparsity_genomewide
95
pearson_coefficent_genomewide
0.136574877074878
SE_genomewide
0.00986788749967738
P_corr_genomewide
3.60899381074088e-43
R2_covariate_model_genomewide
0.000572565759428212
R2_full_model_genomewide
0.0196971625036049
P_genomewide
2.11472401061884e-46
P_full_genomewide
1.09300350988897e-106
n_cis_pqtl
0
max_cis_pqtl
NA
rank_max_cis_pqtl
NA
mean_pqtl_beta
NA
mean_nopqtl_beta
0.0129792900663253
percentage_pqtl
0
percentage_nopqtl
1
test_n_cis
NA
sparsity_cis
NA
pearson_coefficent_cis
NA
SE_cis
NA
P_corr_cis
NA
R2_covariate_model_cis
NA
R2_full_model_cis
NA
P_cis
NA
P_full_cis
NA