ICAM2
Olink Explore plasma protein · SNPBoost PRS model
R2 Full Model
0.5536
pearson_coefficent
0.7427
sparsity
866
n_cis_pqtl
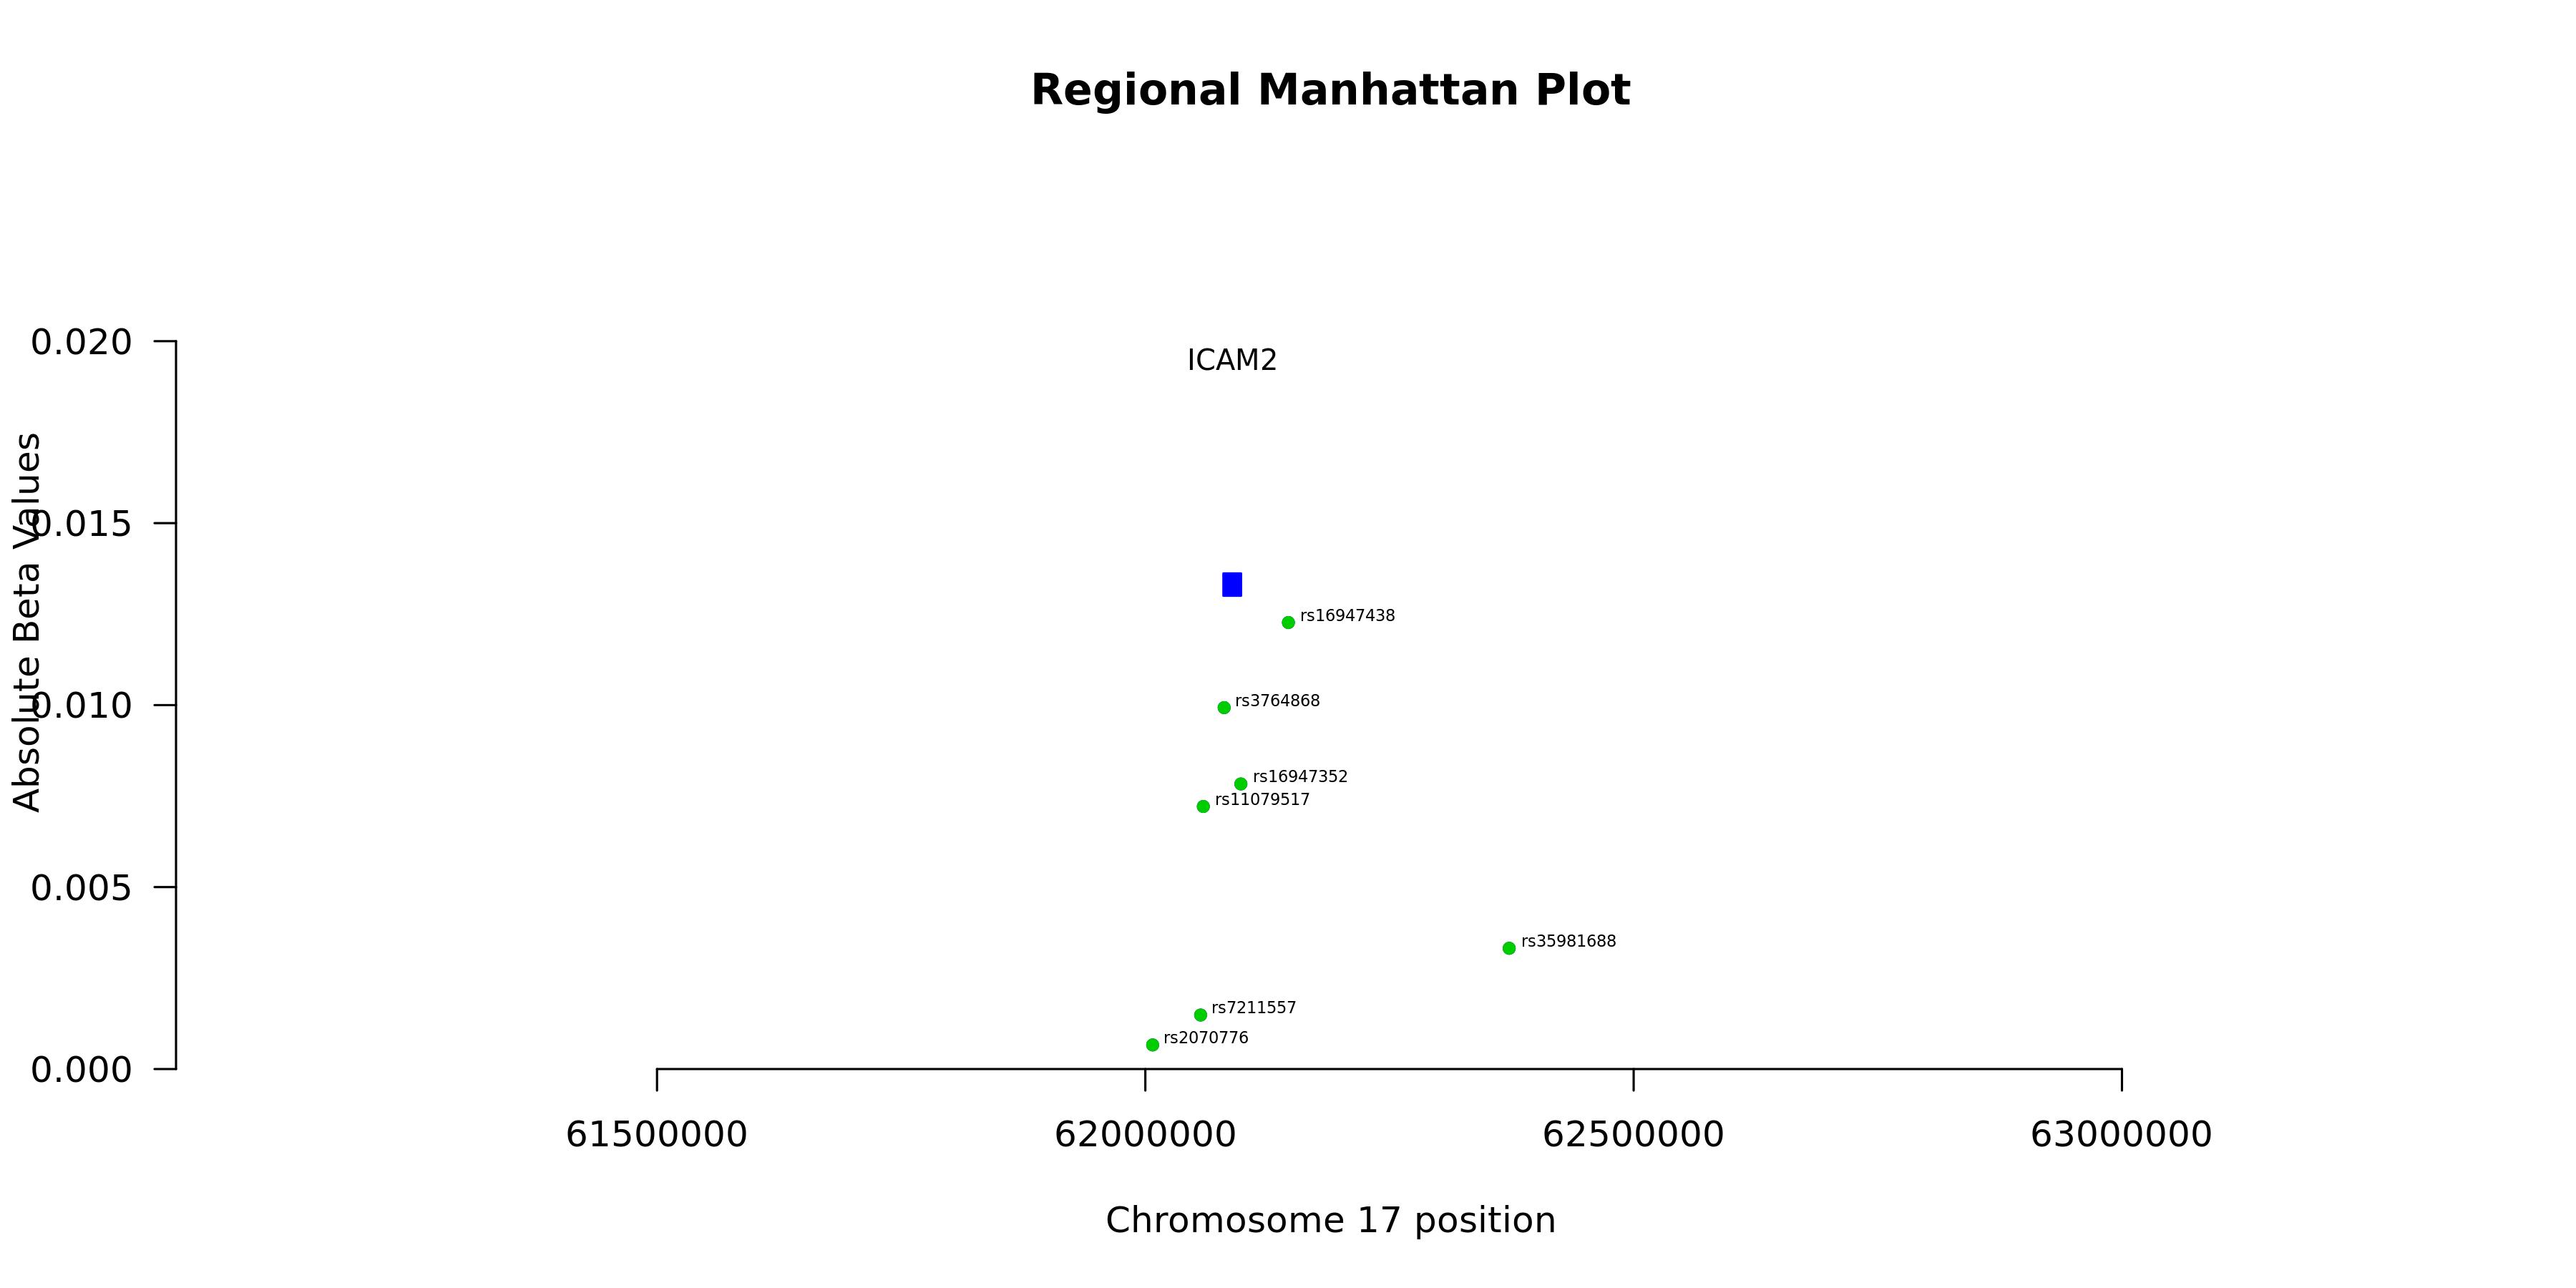
18
max_cis_pqtl
rs16947438
Diagnostics
PRS scatter and box plotsenlarge ⤢

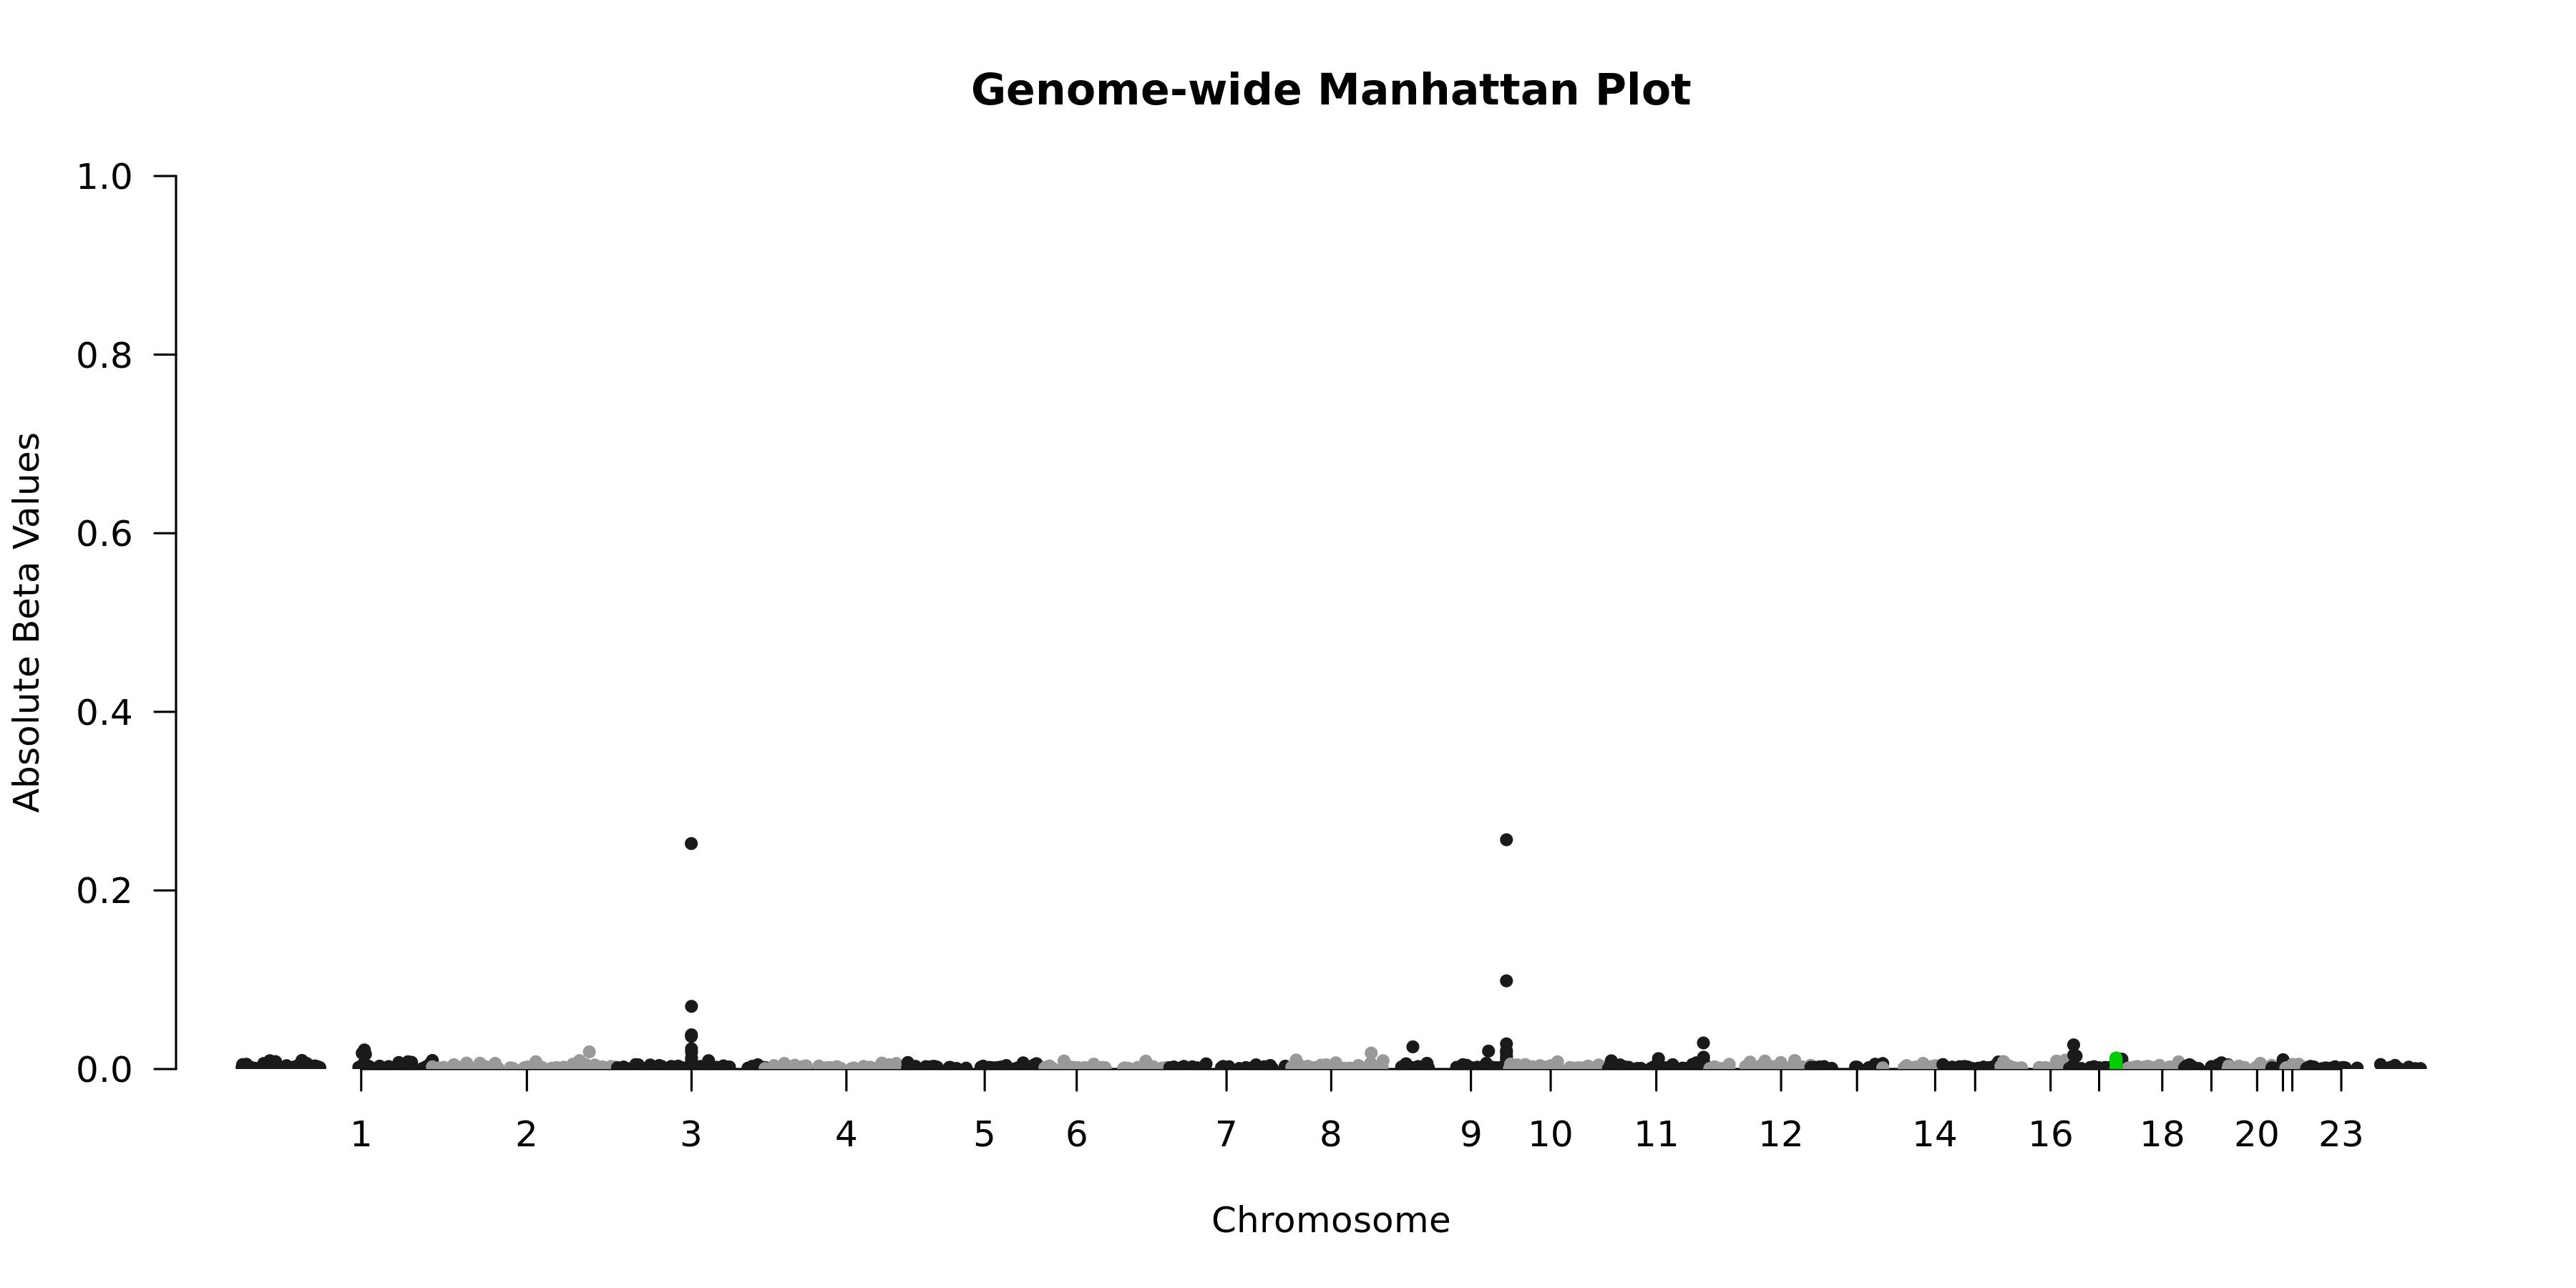
Genome-wide Manhattan Plotenlarge ⤢
Regional Manhattan Plotenlarge ⤢
Model record
Field
Value
Gene
ICAM2
test_n
10538
sparsity
866
pearson_coefficent
0.742681453181422
SE
0.00657336452140539
P_corr
0
R2 Covariate Model
0.005
R2 Full Model
0.5536
P
0
P_full
0
n_cis_pqtl
18
max_cis_pqtl
rs16947438
rank_max_cis_pqtl
26
mean_pqtl_beta
0.00368839156227977
mean_nopqtl_beta
0.00358474727014564
percentage_pqtl
0.0207852193995381
percentage_nopqtl
0.979214780600462
cis and genome-wide metrics
Field
Value
Gene
ICAM2
test_n_genomewide
10538
sparsity_genomewide
866
pearson_coefficent_genomewide
0.742681453181422
SE_genomewide
0.00657336452140539
P_corr_genomewide
0
R2_covariate_model_genomewide
0.00500350675816852
R2_full_model_genomewide
0.553623405220558
P_genomewide
0
P_full_genomewide
0
n_cis_pqtl
18
max_cis_pqtl
rs16947438
rank_max_cis_pqtl
26
mean_pqtl_beta
0.00368839156227977
mean_nopqtl_beta
0.00358474727014564
percentage_pqtl
0.0207852193995381
percentage_nopqtl
0.979214780600462
test_n_cis
10538
sparsity_cis
18
pearson_coefficent_cis
0.0570717532302567
SE_cis
0.009800195146857
P_corr_cis
5.9327285023336e-09
R2_covariate_model_cis
0.00500350675816852
R2_full_model_cis
0.00803475515989083
P_cis
2.61812994896582e-20
P_full_cis
3.15704940045353e-21