HBEGF
Olink Explore plasma protein · SNPBoost PRS model
R2 Full Model
0.2224
pearson_coefficent
0.464
sparsity
1626
n_cis_pqtl
27
max_cis_pqtl
rs149975240
Diagnostics
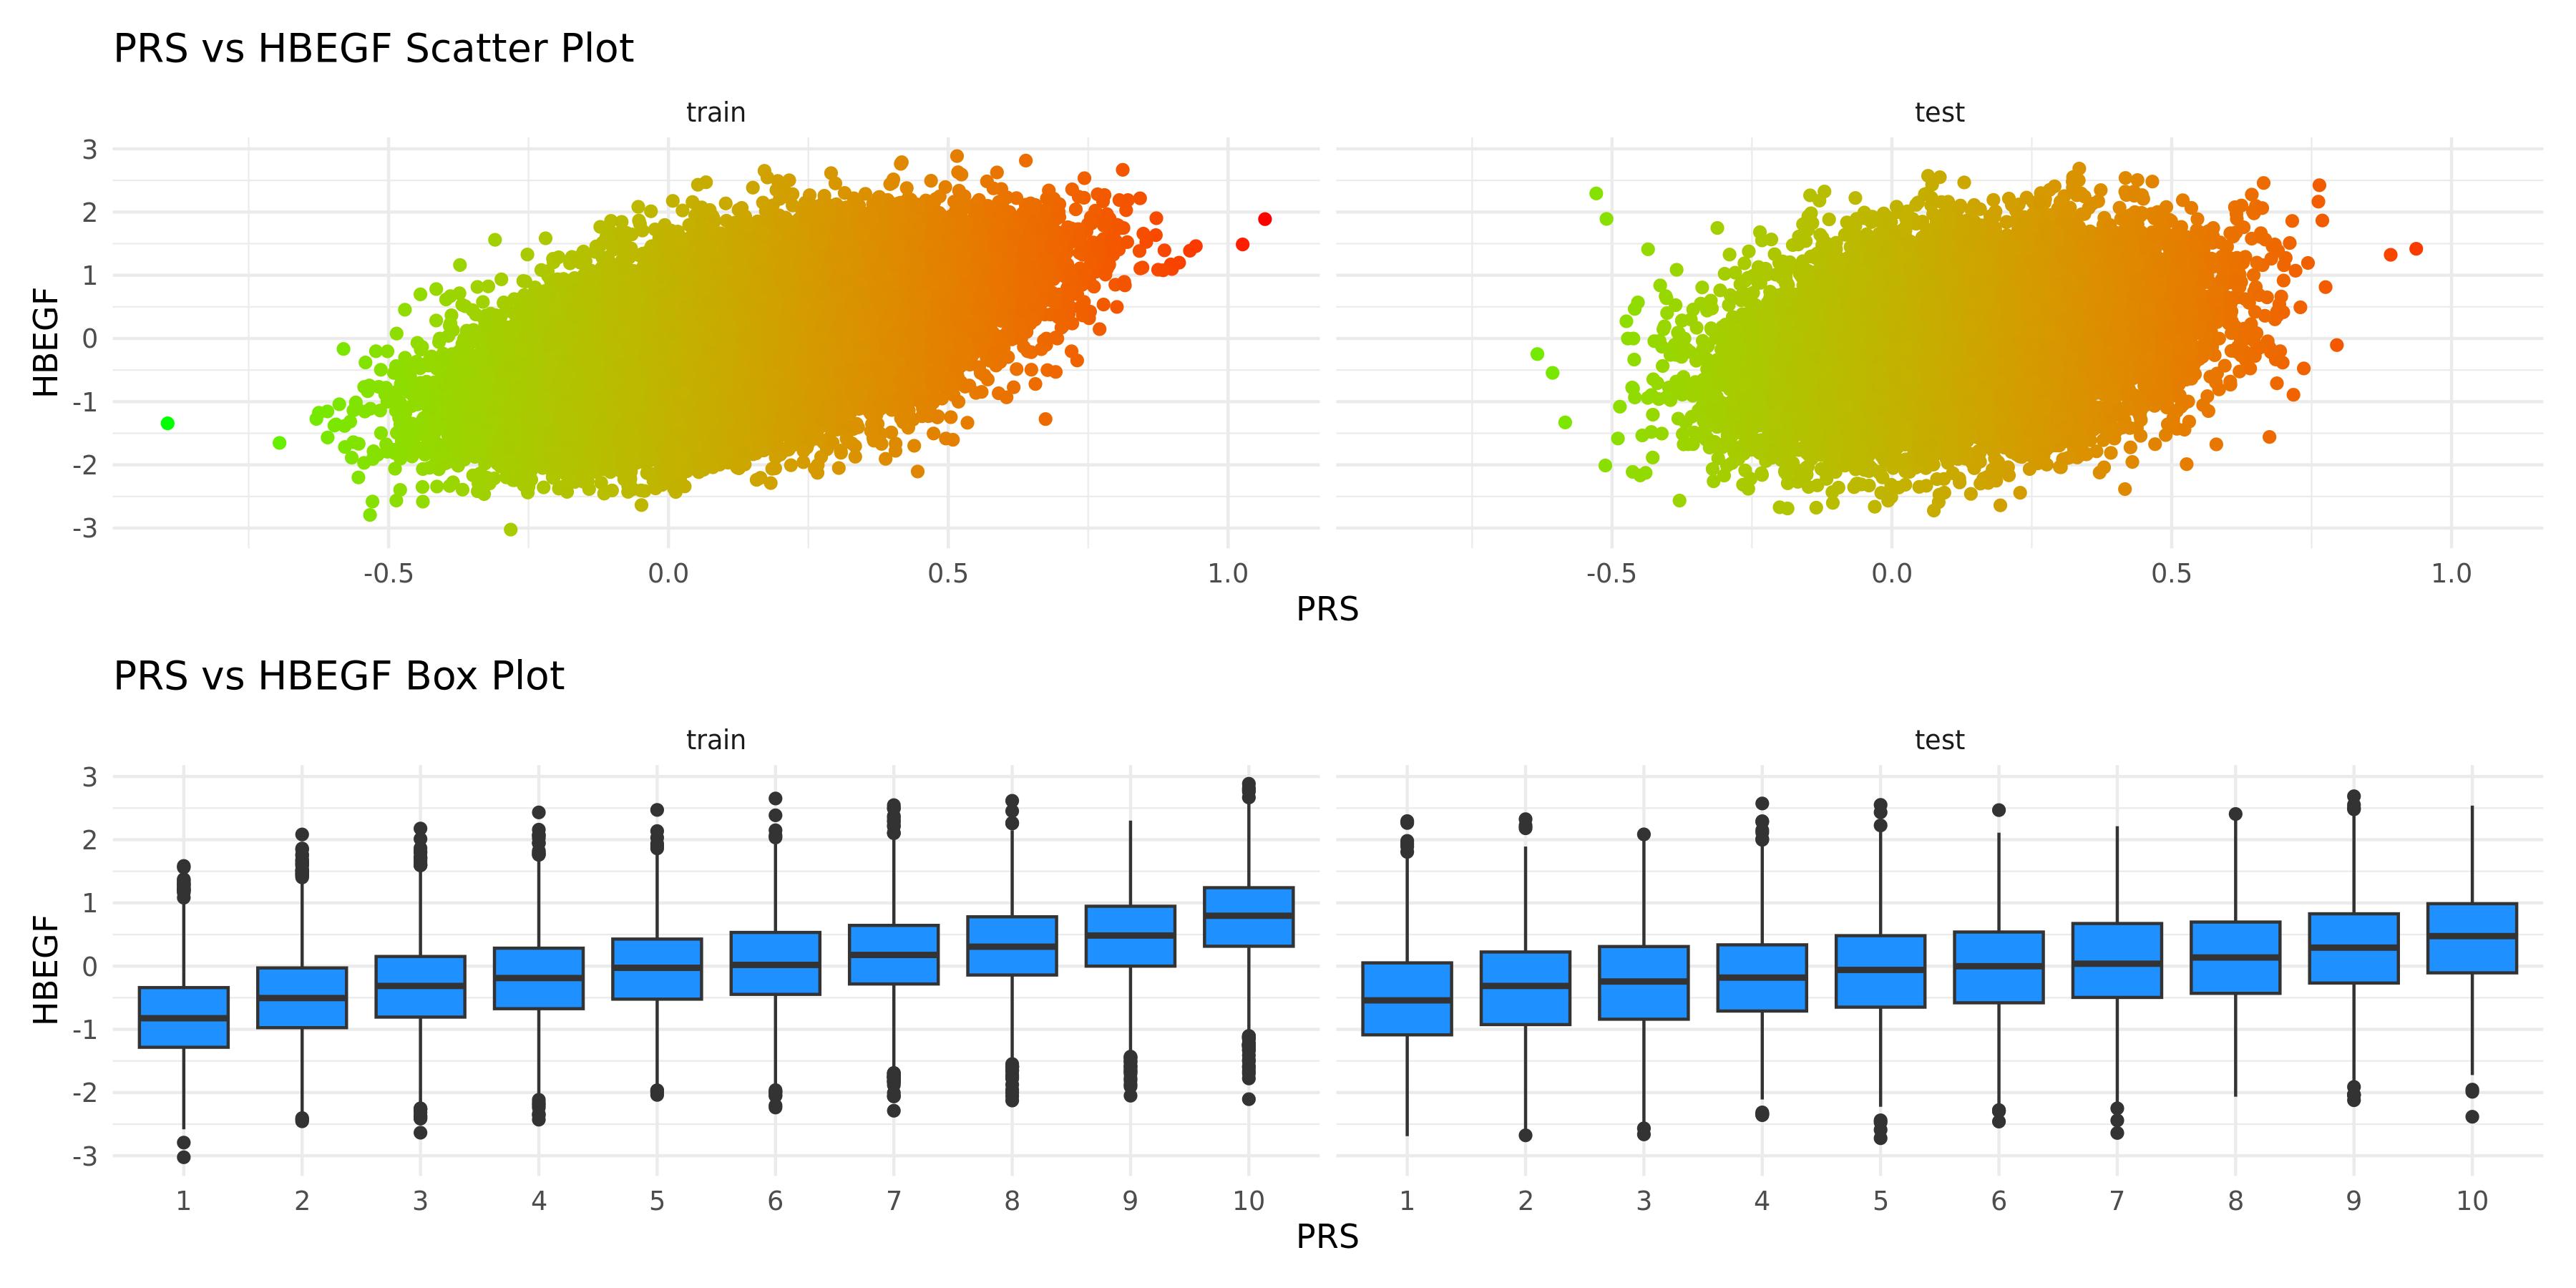
PRS scatter and box plotsenlarge ⤢
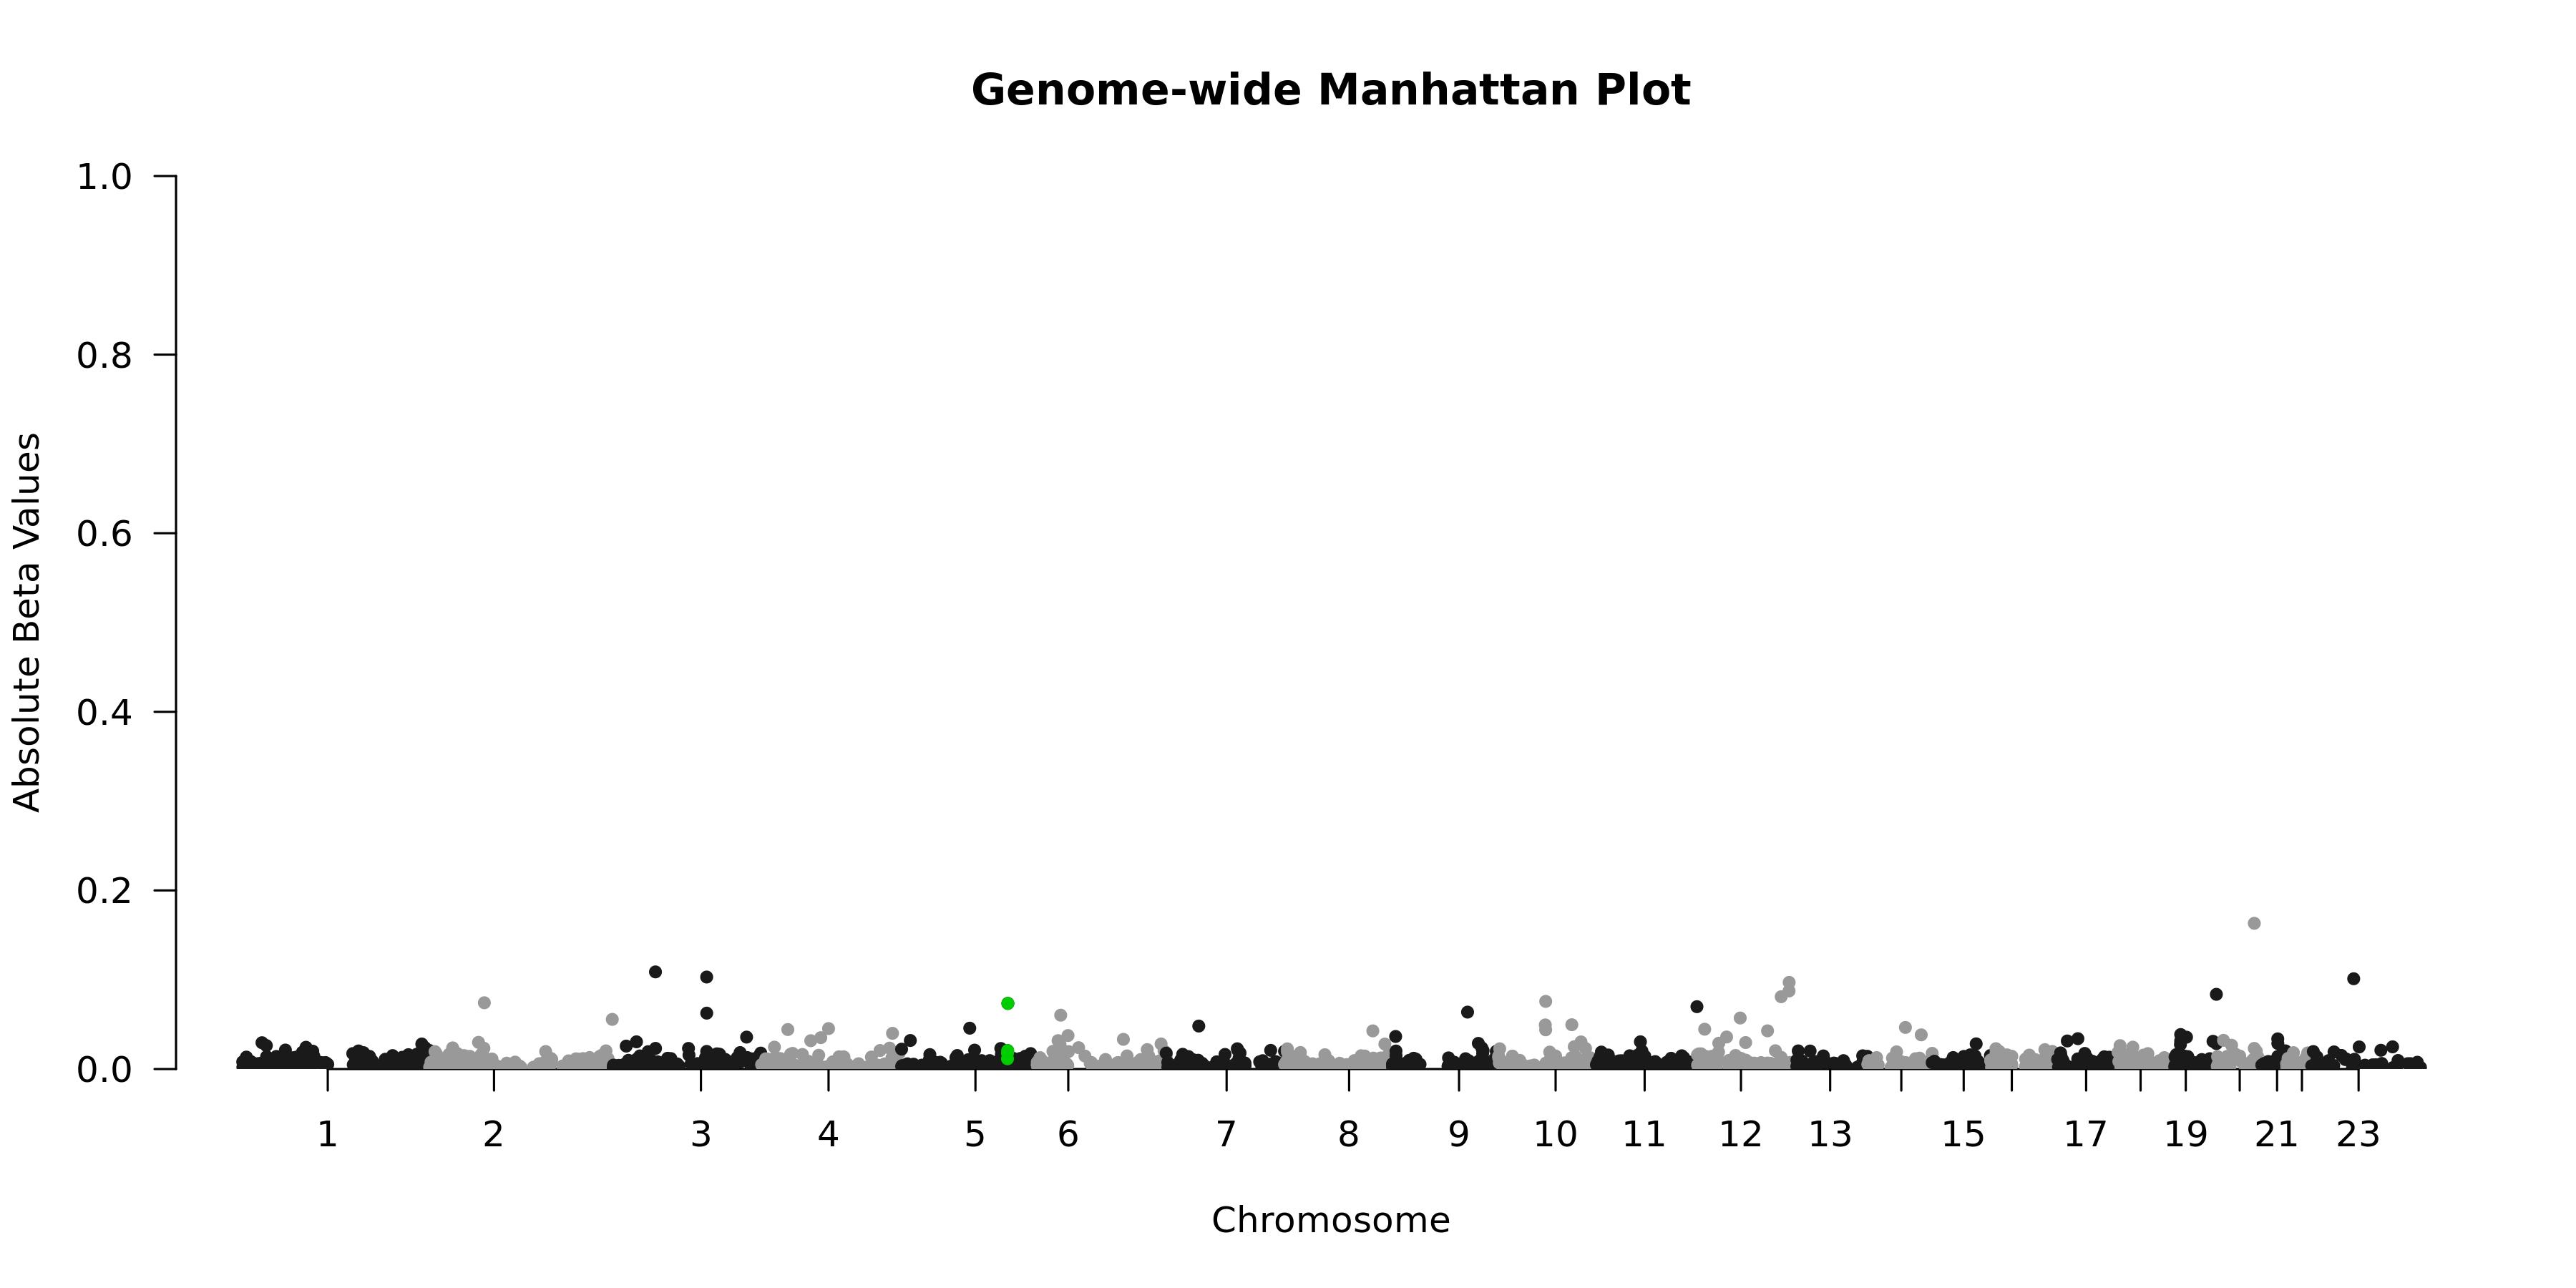
Genome-wide Manhattan Plotenlarge ⤢
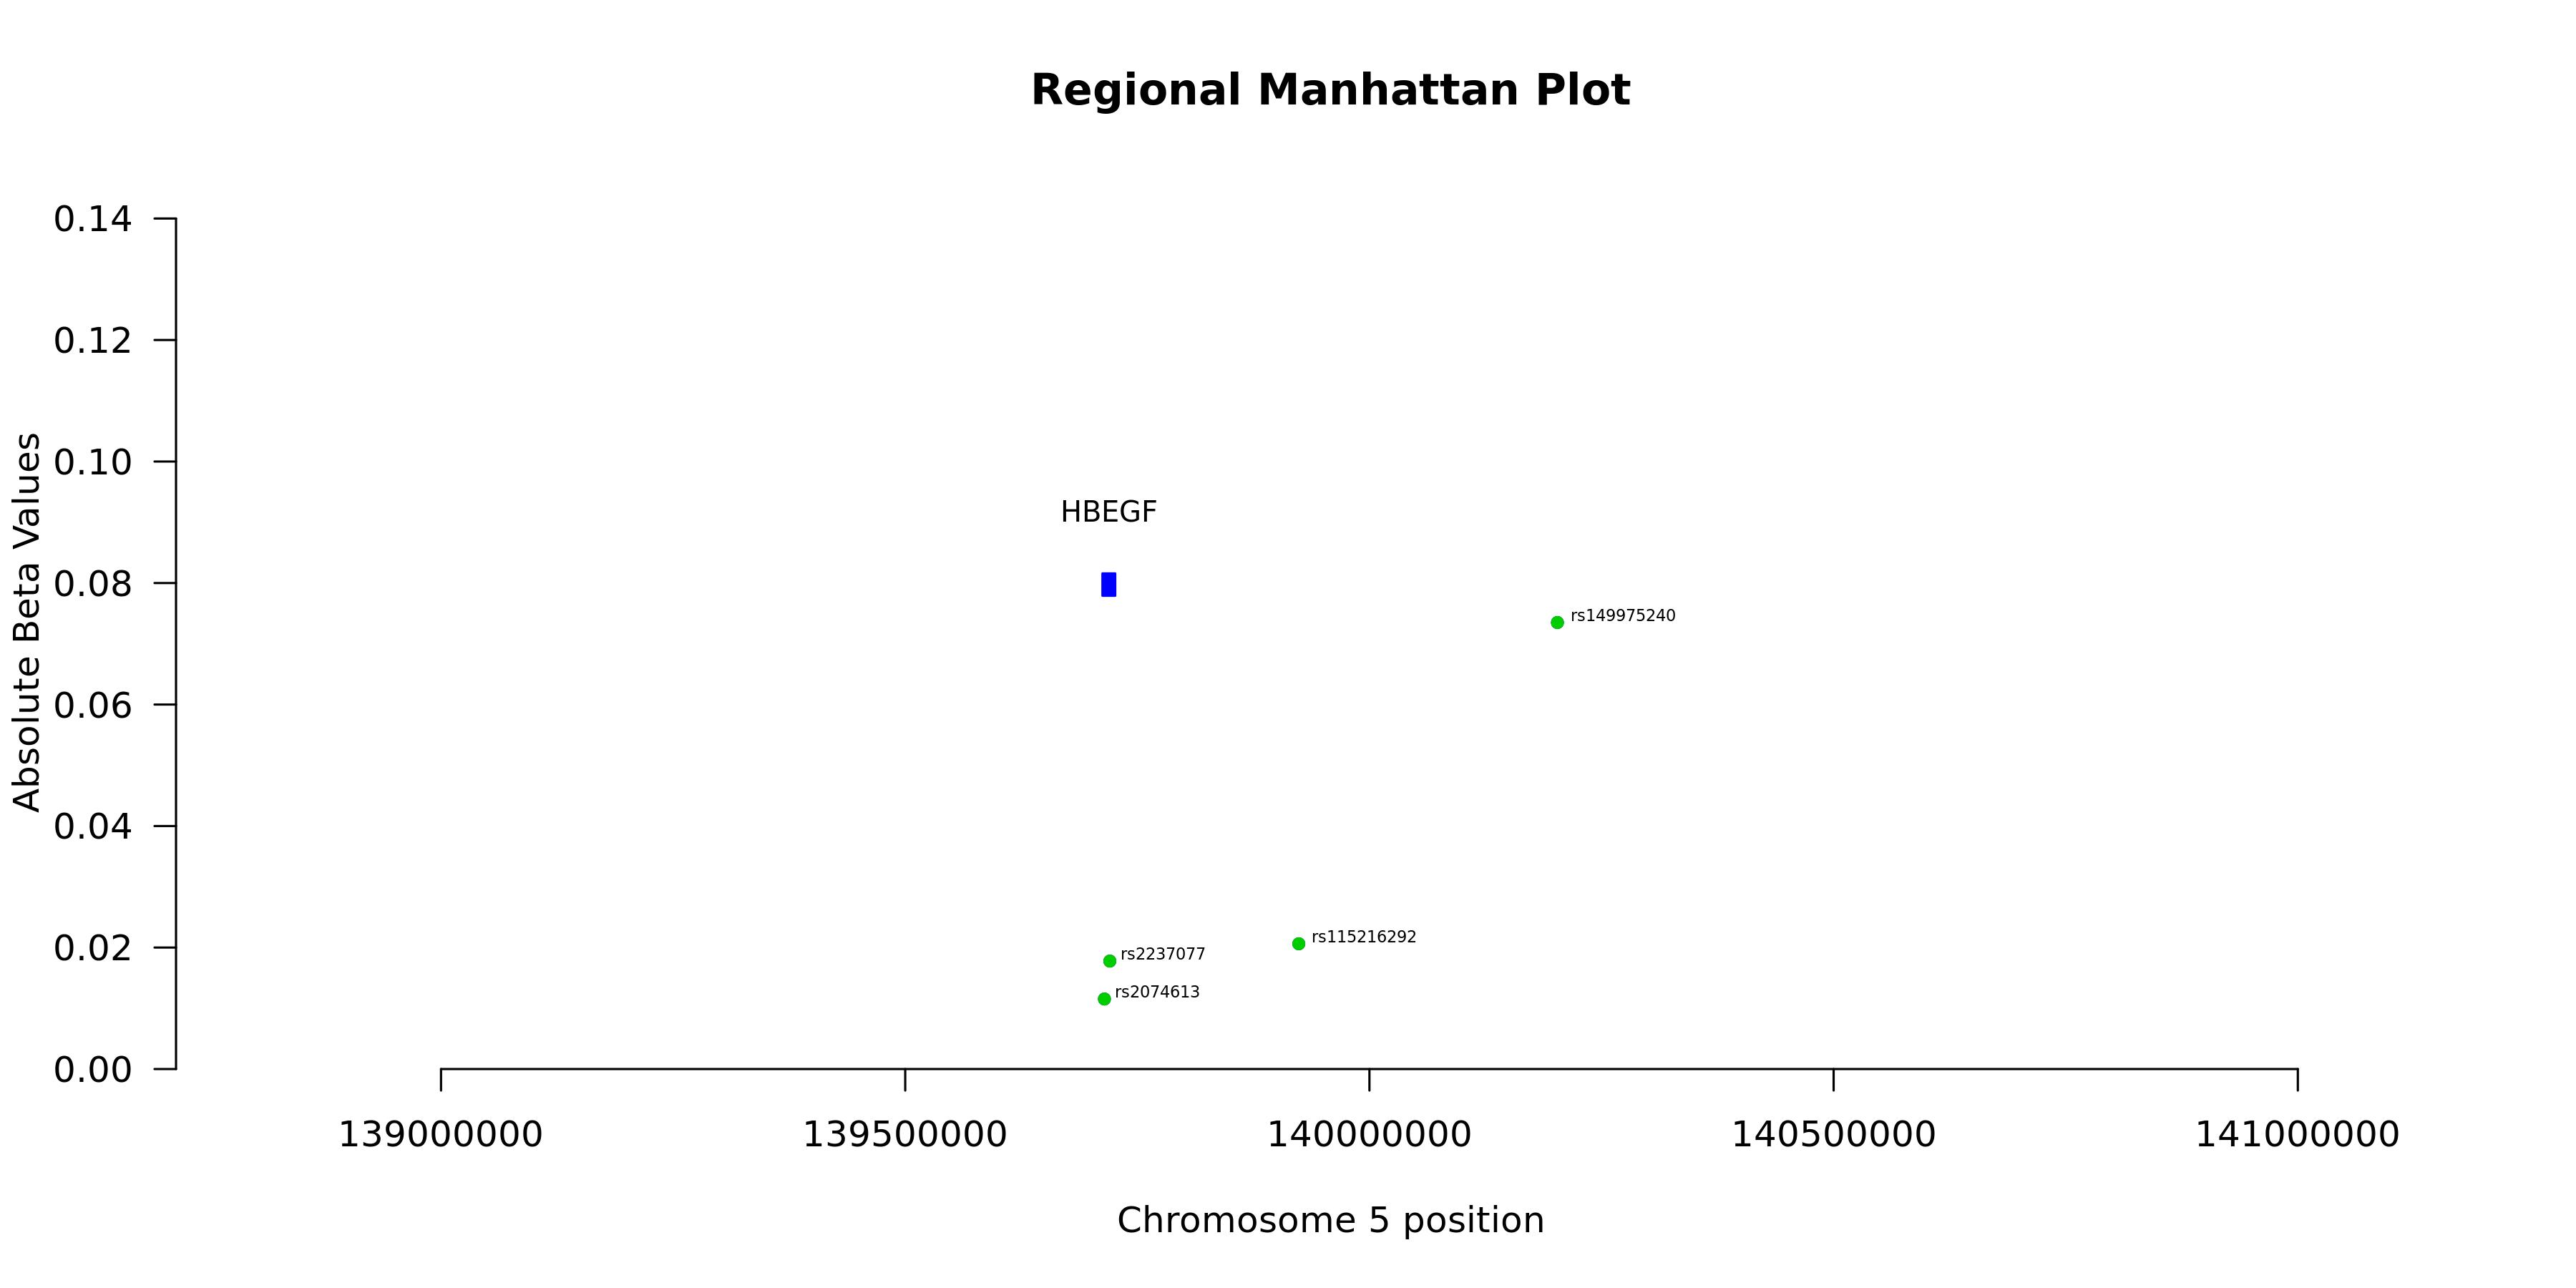
Regional Manhattan Plotenlarge ⤢
Model record
Field
Value
Gene
HBEGF
test_n
10538
sparsity
1626
pearson_coefficent
0.464036076286339
SE
0.00872990266022205
P_corr
0
R2 Covariate Model
0.0094
R2 Full Model
0.2224
P
0
P_full
0
n_cis_pqtl
27
max_cis_pqtl
rs149975240
rank_max_cis_pqtl
11
mean_pqtl_beta
0.010334888109147
mean_nopqtl_beta
0.00858755462710806
percentage_pqtl
0.0166051660516605
percentage_nopqtl
0.98339483394834
cis and genome-wide metrics
Field
Value
Gene
HBEGF
test_n_genomewide
10538
sparsity_genomewide
1626
pearson_coefficent_genomewide
0.464036076286339
SE_genomewide
0.00872990266022205
P_corr_genomewide
0
R2_covariate_model_genomewide
0.0093865152150997
R2_full_model_genomewide
0.222410143014474
P_genomewide
0
P_full_genomewide
0
n_cis_pqtl
27
max_cis_pqtl
rs149975240
rank_max_cis_pqtl
11
mean_pqtl_beta
0.010334888109147
mean_nopqtl_beta
0.00858755462710806
percentage_pqtl
0.0166051660516605
percentage_nopqtl
0.98339483394834
test_n_cis
10538
sparsity_cis
27
pearson_coefficent_cis
0.0598279834585094
SE_cis
0.00983755298620247
P_corr_cis
1.23222431819555e-09
R2_covariate_model_cis
0.00938651521509981
R2_full_model_cis
0.0142654506929549
P_cis
8.67482444693193e-37
P_full_cis
1.24208750709976e-34