GMPR
Olink Explore plasma protein · SNPBoost PRS model
R2 Full Model
0.1057
pearson_coefficent
0.2665
sparsity
92
n_cis_pqtl
11
max_cis_pqtl
rs147049568
Diagnostics
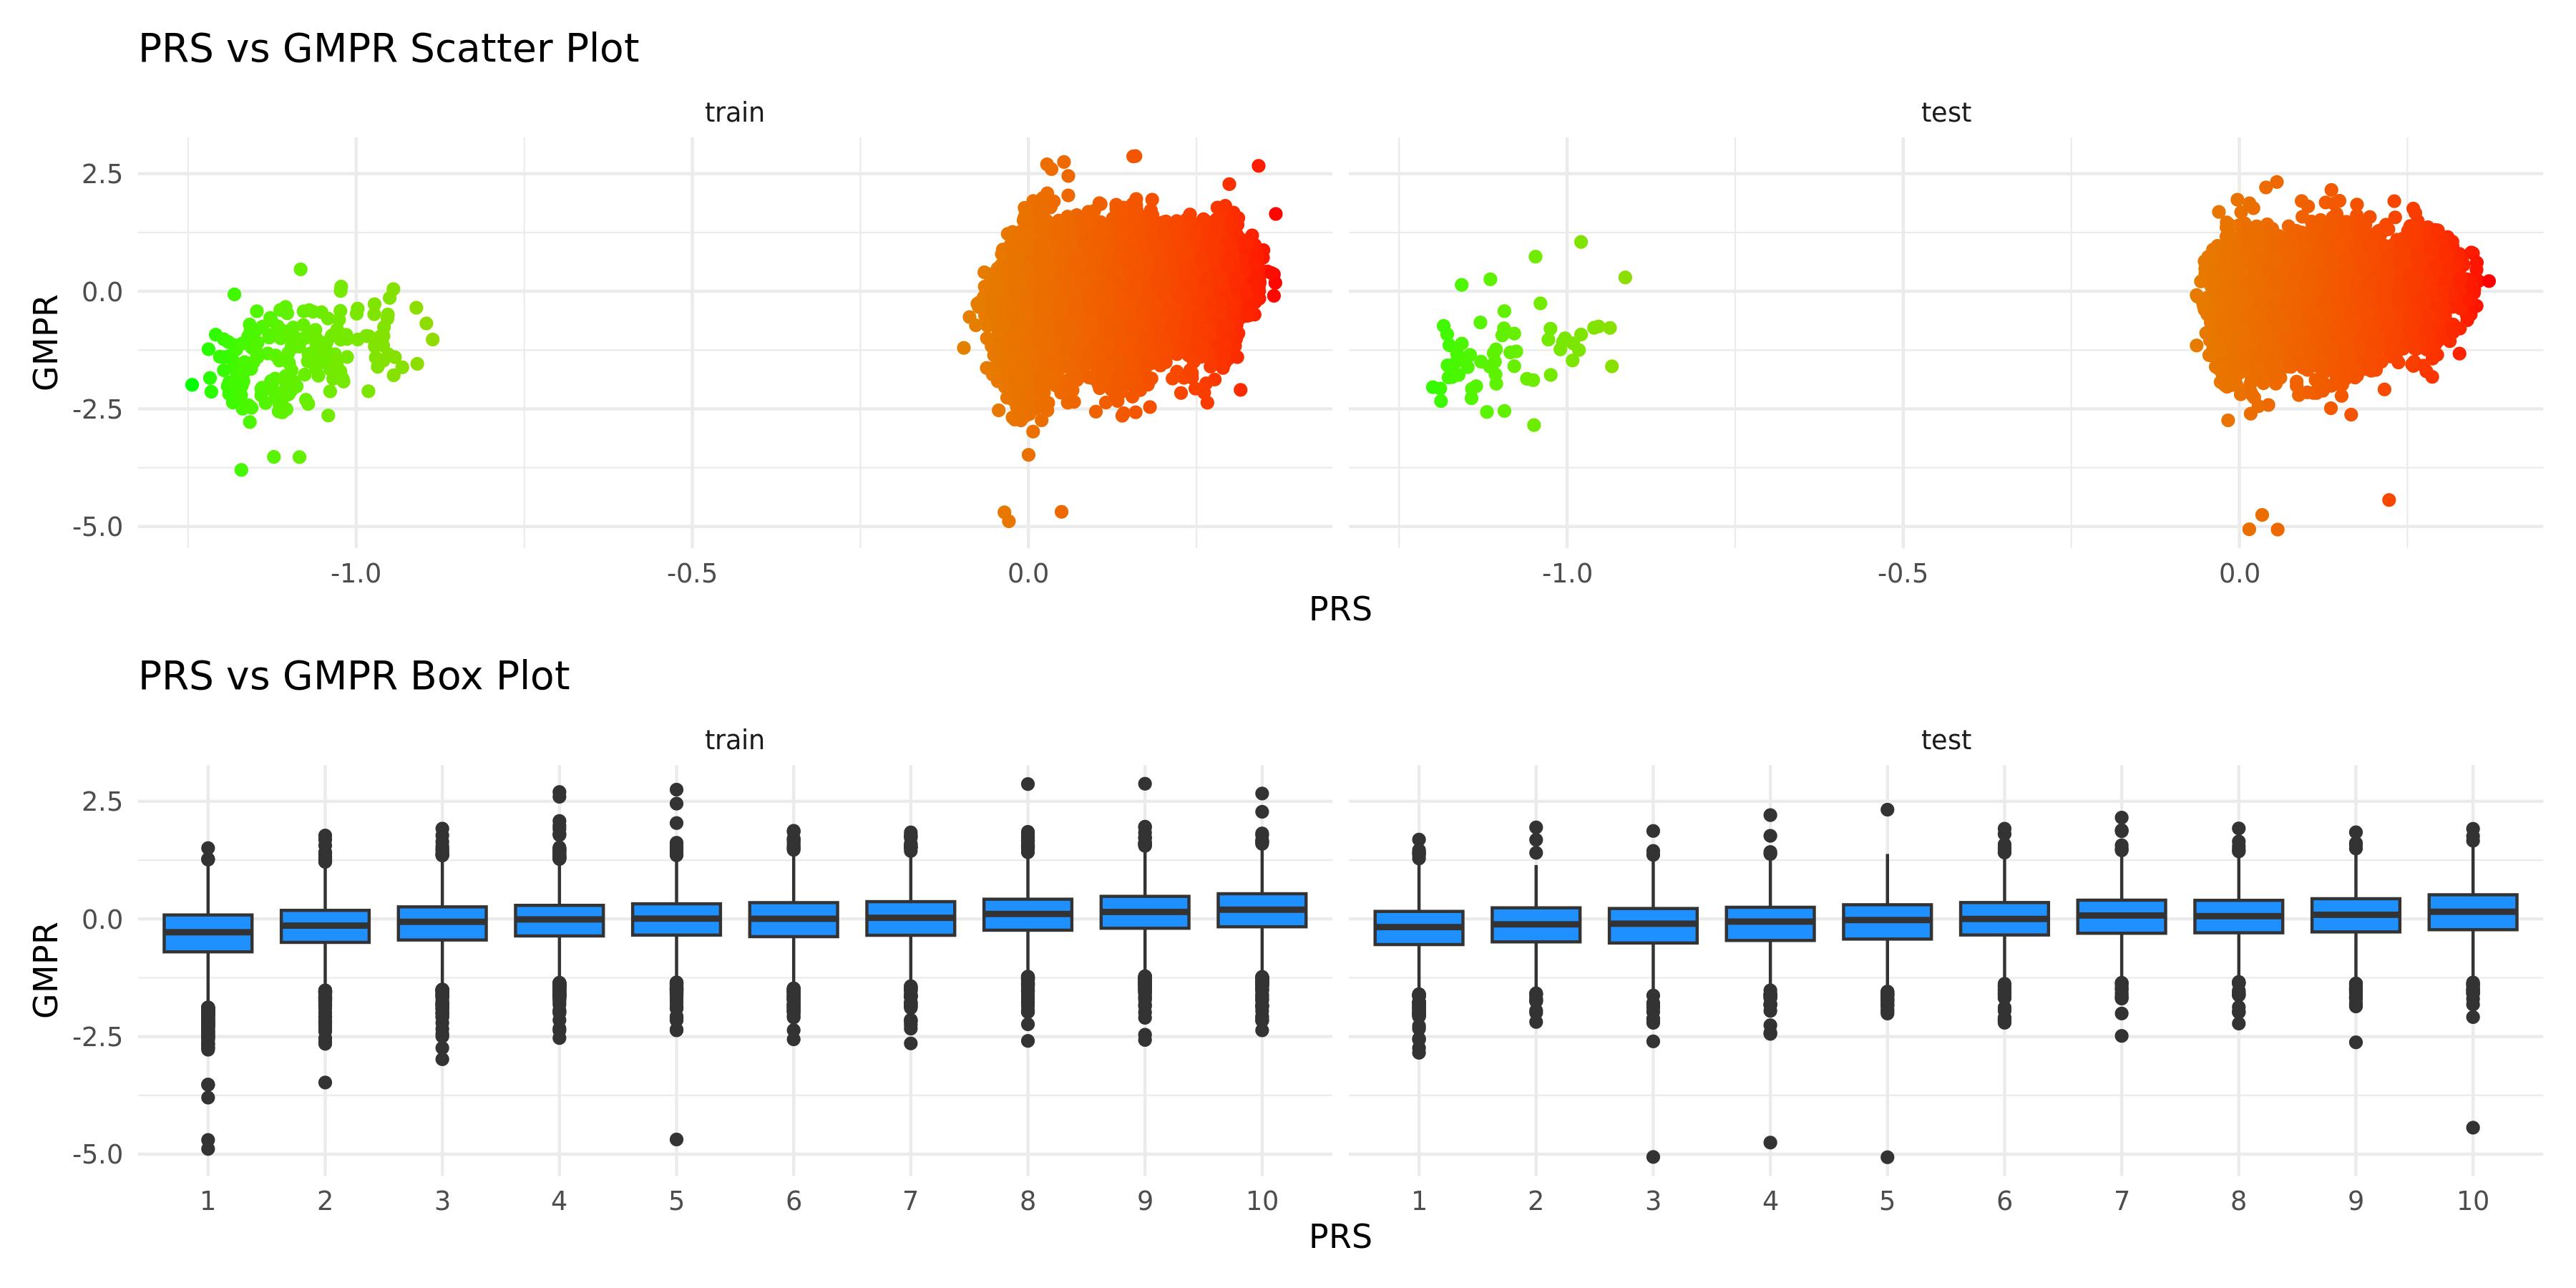
PRS scatter and box plotsenlarge ⤢
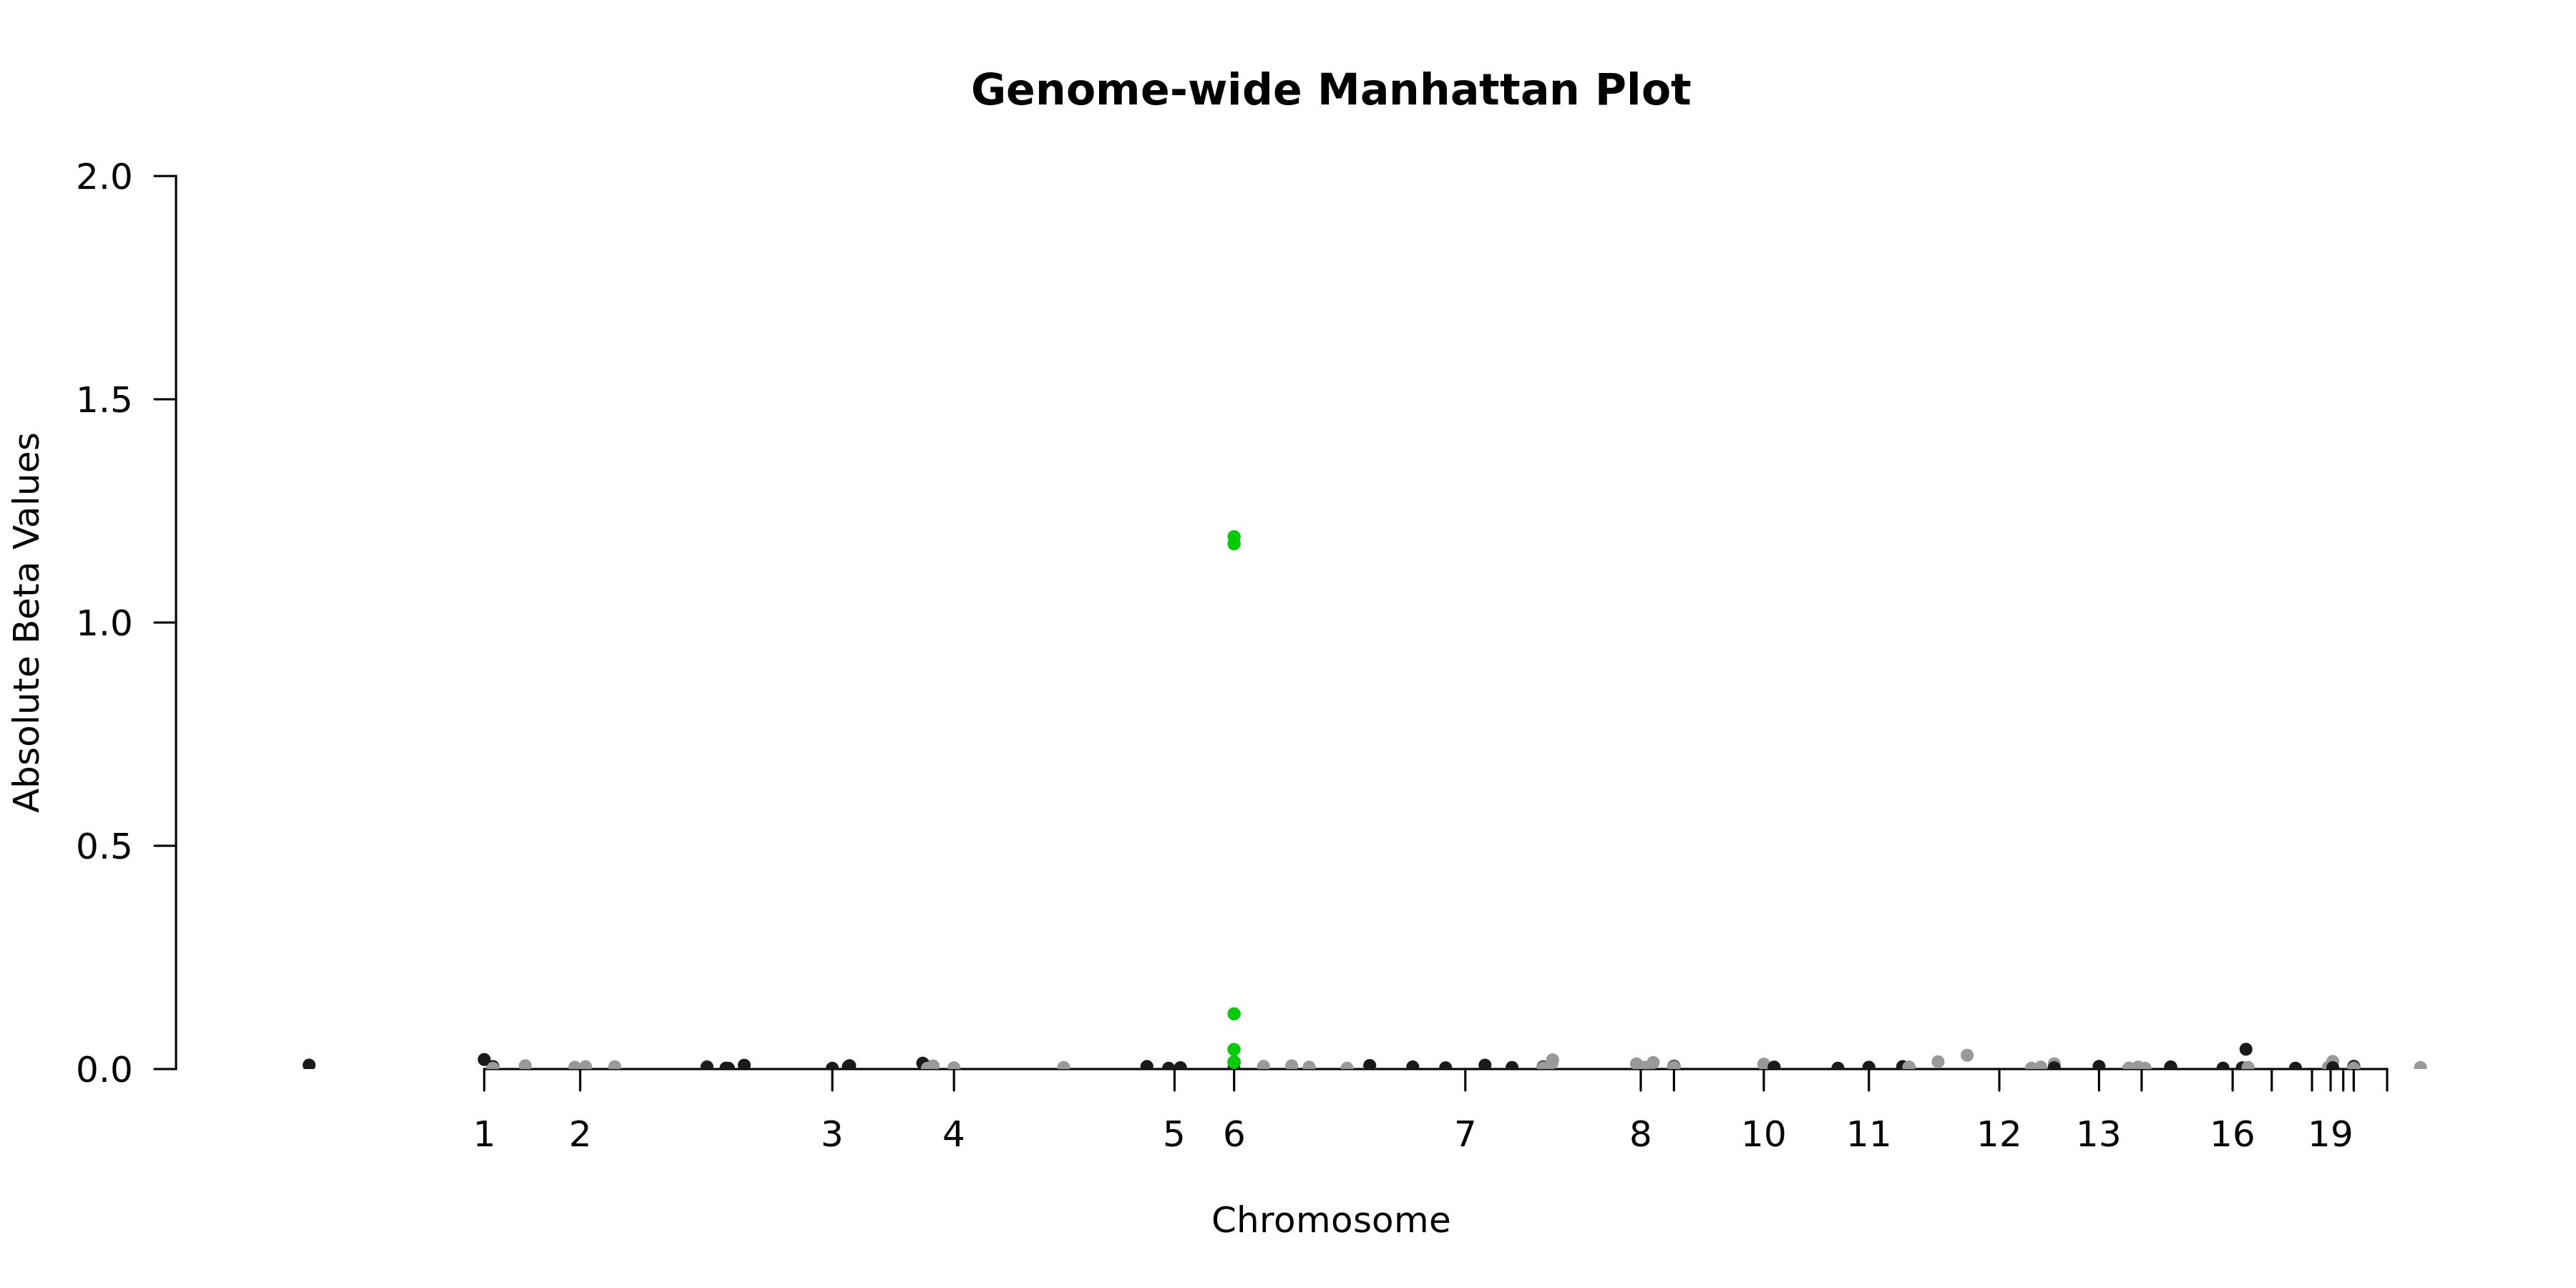
Genome-wide Manhattan Plotenlarge ⤢
Regional Manhattan Plotenlarge ⤢

Model record
Field
Value
Gene
GMPR
test_n
10538
sparsity
92
pearson_coefficent
0.266544033999779
SE
0.00947569192603903
P_corr
7.99729659916081e-168
R2 Covariate Model
0.0368
R2 Full Model
0.1057
P
2.08100624205946e-253
P_full
0
n_cis_pqtl
11
max_cis_pqtl
rs147049568
rank_max_cis_pqtl
1
mean_pqtl_beta
0.235524319891706
mean_nopqtl_beta
0.00616623487407334
percentage_pqtl
0.119565217391304
percentage_nopqtl
0.880434782608696
cis and genome-wide metrics
Field
Value
Gene
GMPR
test_n_genomewide
10538
sparsity_genomewide
92
pearson_coefficent_genomewide
0.266544033999779
SE_genomewide
0.00947569192603903
P_corr_genomewide
7.99729659916081e-168
R2_covariate_model_genomewide
0.0368073534858331
R2_full_model_genomewide
0.105723601333369
P_genomewide
2.08100624205946e-253
P_full_genomewide
0
n_cis_pqtl
11
max_cis_pqtl
rs147049568
rank_max_cis_pqtl
1
mean_pqtl_beta
0.235524319891706
mean_nopqtl_beta
0.00616623487407334
percentage_pqtl
0.119565217391304
percentage_nopqtl
0.880434782608696
test_n_cis
10538
sparsity_cis
11
pearson_coefficent_cis
0.252886684669276
SE_cis
0.00951180412024857
P_corr_cis
1.03981884496102e-150
R2_covariate_model_cis
0.0368073534858331
R2_full_model_cis
0.099006508891476
P_cis
1.39216705728555e-236
P_full_cis
0