GLP1R
Olink Explore plasma protein · SNPBoost PRS model
R2 Full Model
0.007
pearson_coefficent
0.0719
sparsity
14
n_cis_pqtl
0
max_cis_pqtl
—
Diagnostics
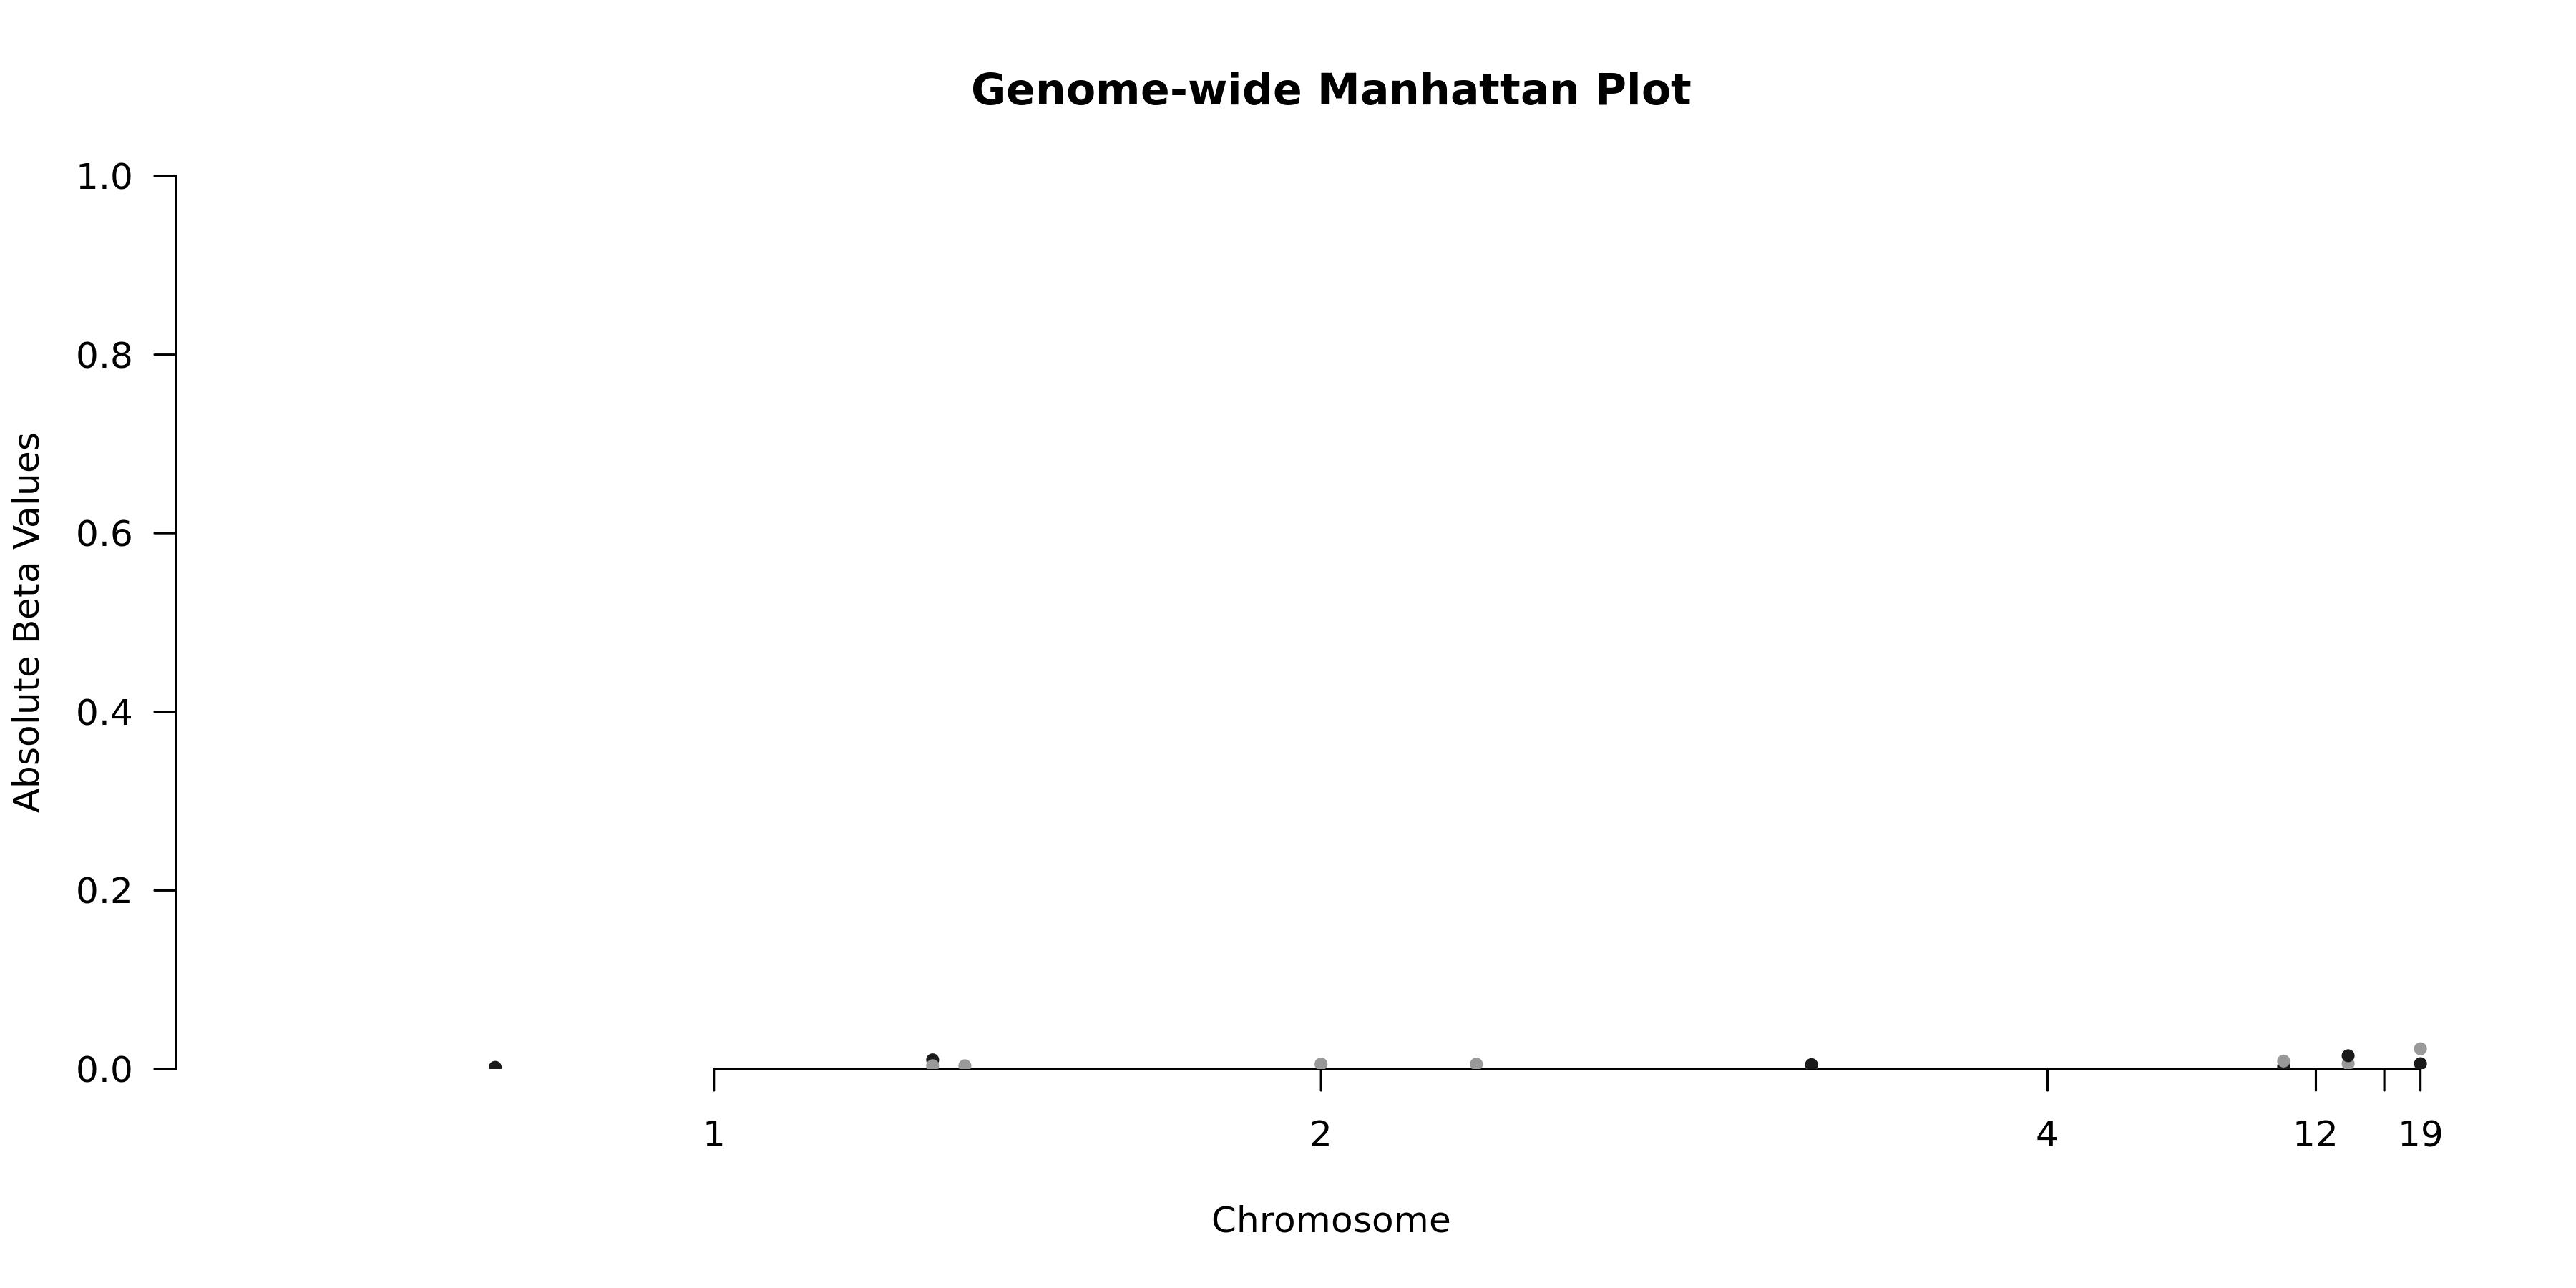
Genome-wide Manhattan Plotenlarge ⤢
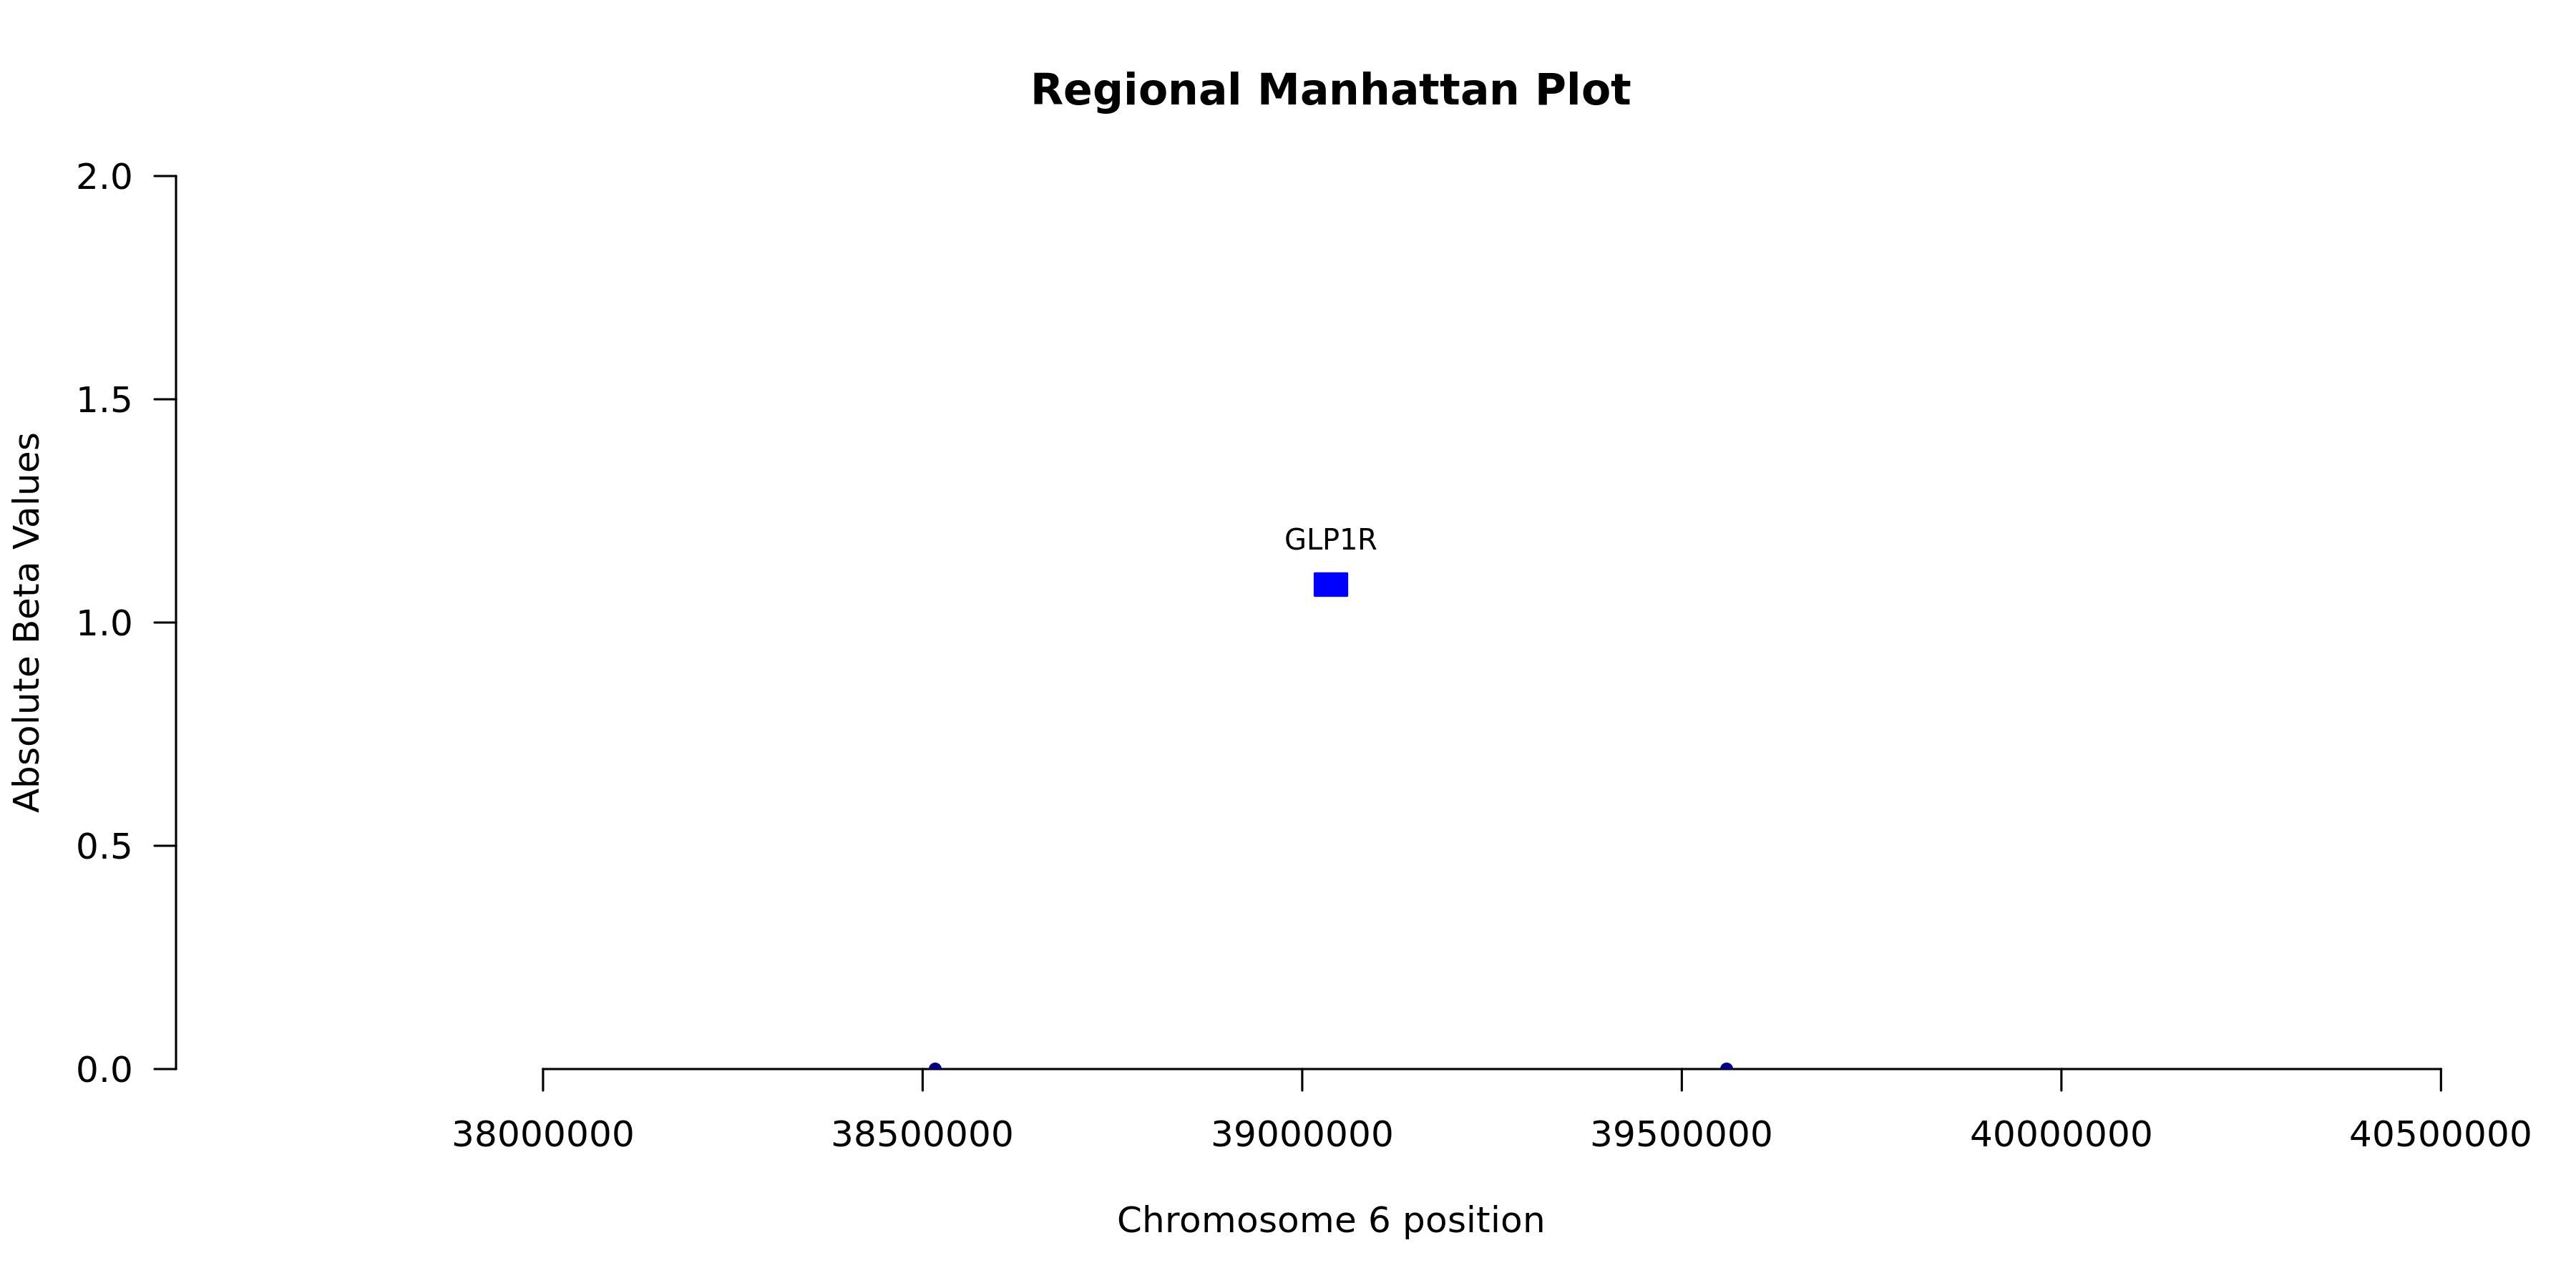
Regional Manhattan Plotenlarge ⤢
Model record
Field
Value
Gene
GLP1R
test_n
10538
sparsity
14
pearson_coefficent
0.0718870935724198
SE
0.0109067128303429
P_corr
4.63054827942621e-11
R2 Covariate Model
0.0015
R2 Full Model
0.007
P
1.58429574173275e-14
P_full
1.28113230790894e-25
n_cis_pqtl
0
max_cis_pqtl
—
rank_max_cis_pqtl
—
mean_pqtl_beta
—
mean_nopqtl_beta
0.00722152168956679
percentage_pqtl
0
percentage_nopqtl
1
cis and genome-wide metrics
Field
Value
Gene
GLP1R
test_n_genomewide
10538
sparsity_genomewide
14
pearson_coefficent_genomewide
0.0718870935724198
SE_genomewide
0.0109067128303429
P_corr_genomewide
4.63054827942621e-11
R2_covariate_model_genomewide
0.00153651436693369
R2_full_model_genomewide
0.00696711935222905
P_genomewide
1.58429574173275e-14
P_full_genomewide
1.28113230790894e-25
n_cis_pqtl
0
max_cis_pqtl
NA
rank_max_cis_pqtl
NA
mean_pqtl_beta
NA
mean_nopqtl_beta
0.00722152168956679
percentage_pqtl
0
percentage_nopqtl
1
test_n_cis
NA
sparsity_cis
NA
pearson_coefficent_cis
NA
SE_cis
NA
P_corr_cis
NA
R2_covariate_model_cis
NA
R2_full_model_cis
NA
P_cis
NA
P_full_cis
NA