FRMD7
Olink Explore plasma protein · SNPBoost PRS model
R2 Full Model
0.0057
pearson_coefficent
0.0657
sparsity
18
n_cis_pqtl
0
max_cis_pqtl
—
Diagnostics
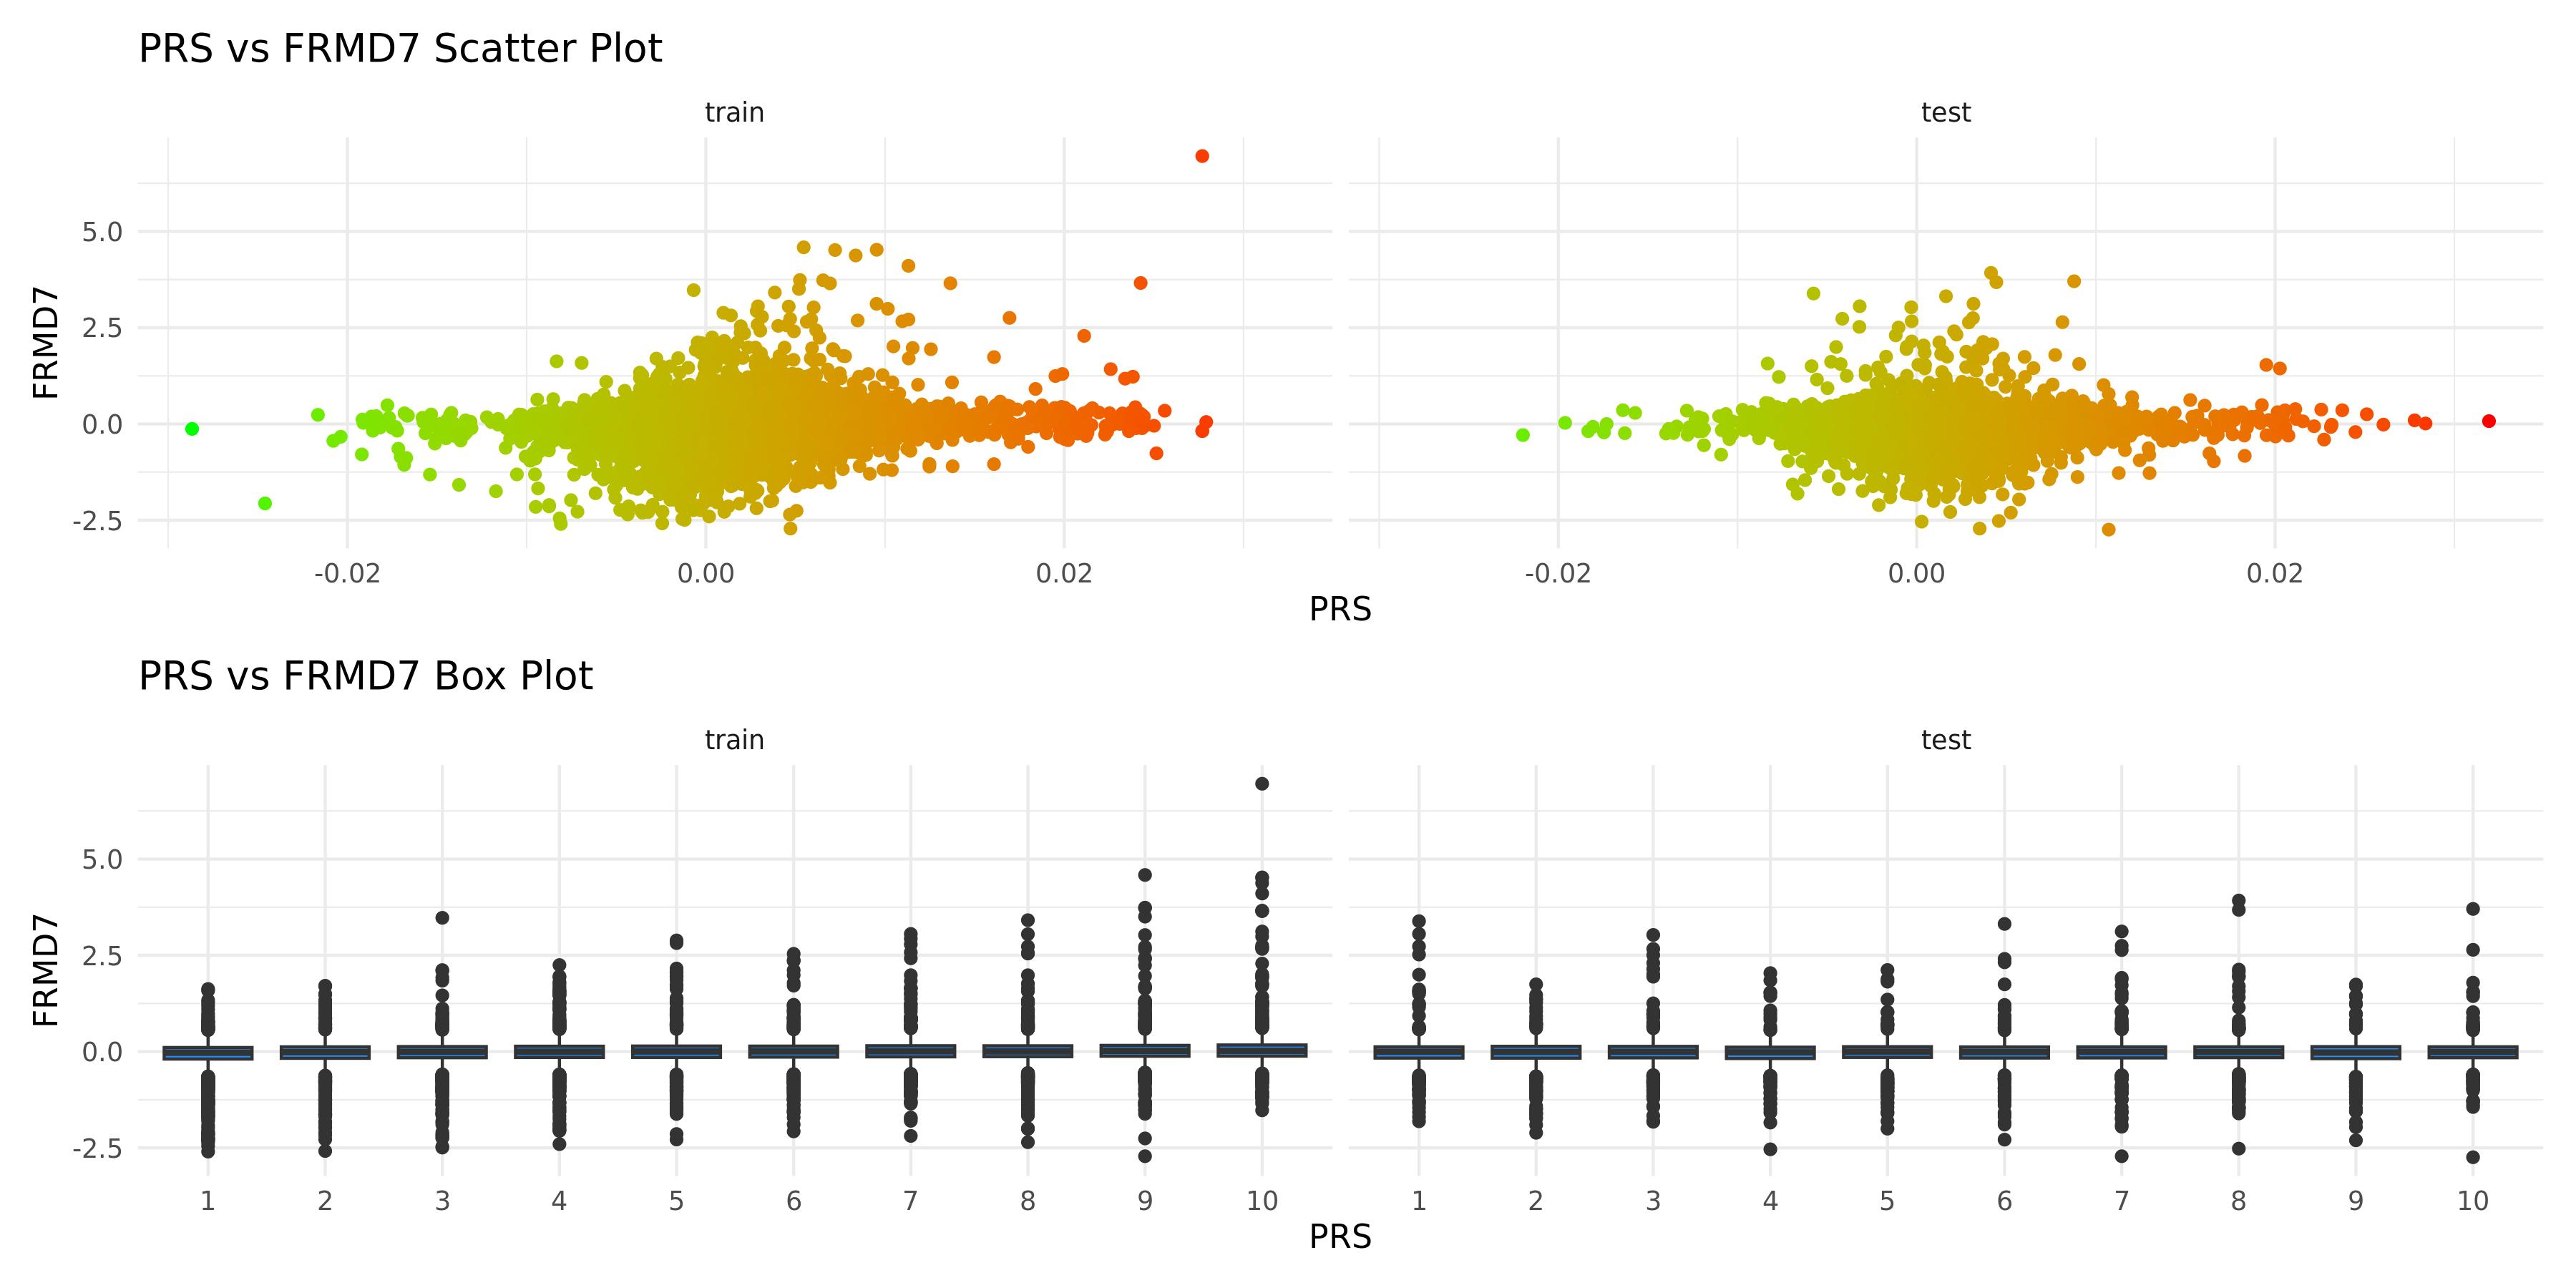
PRS scatter and box plotsenlarge ⤢
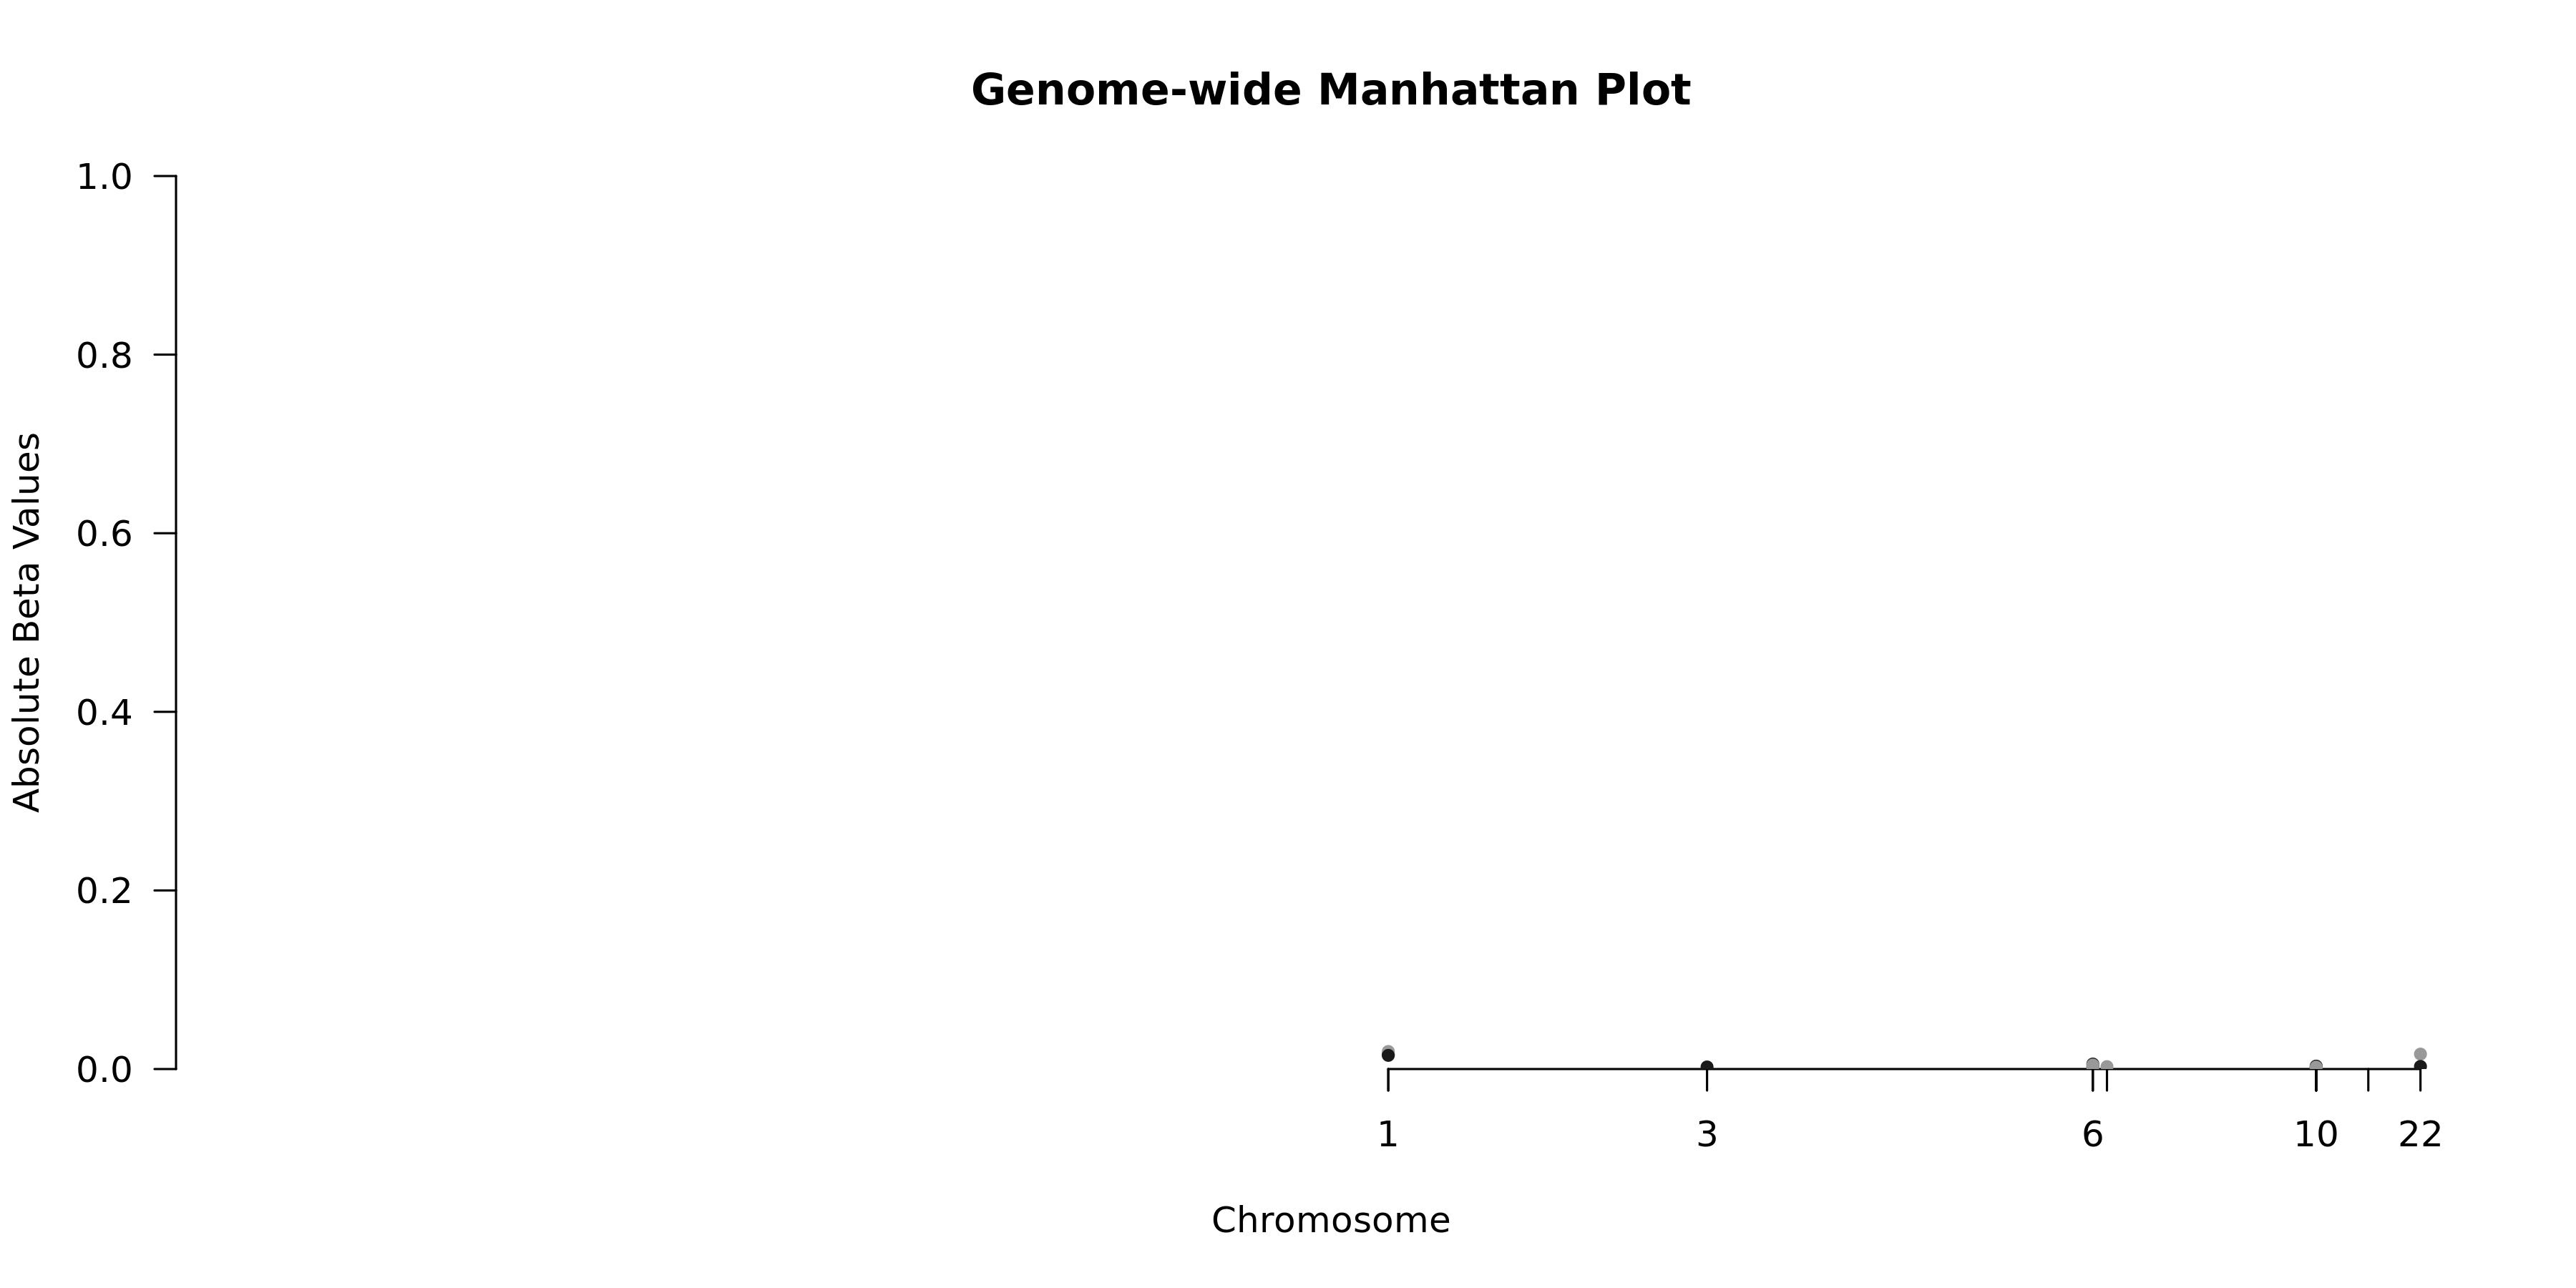
Genome-wide Manhattan Plotenlarge ⤢
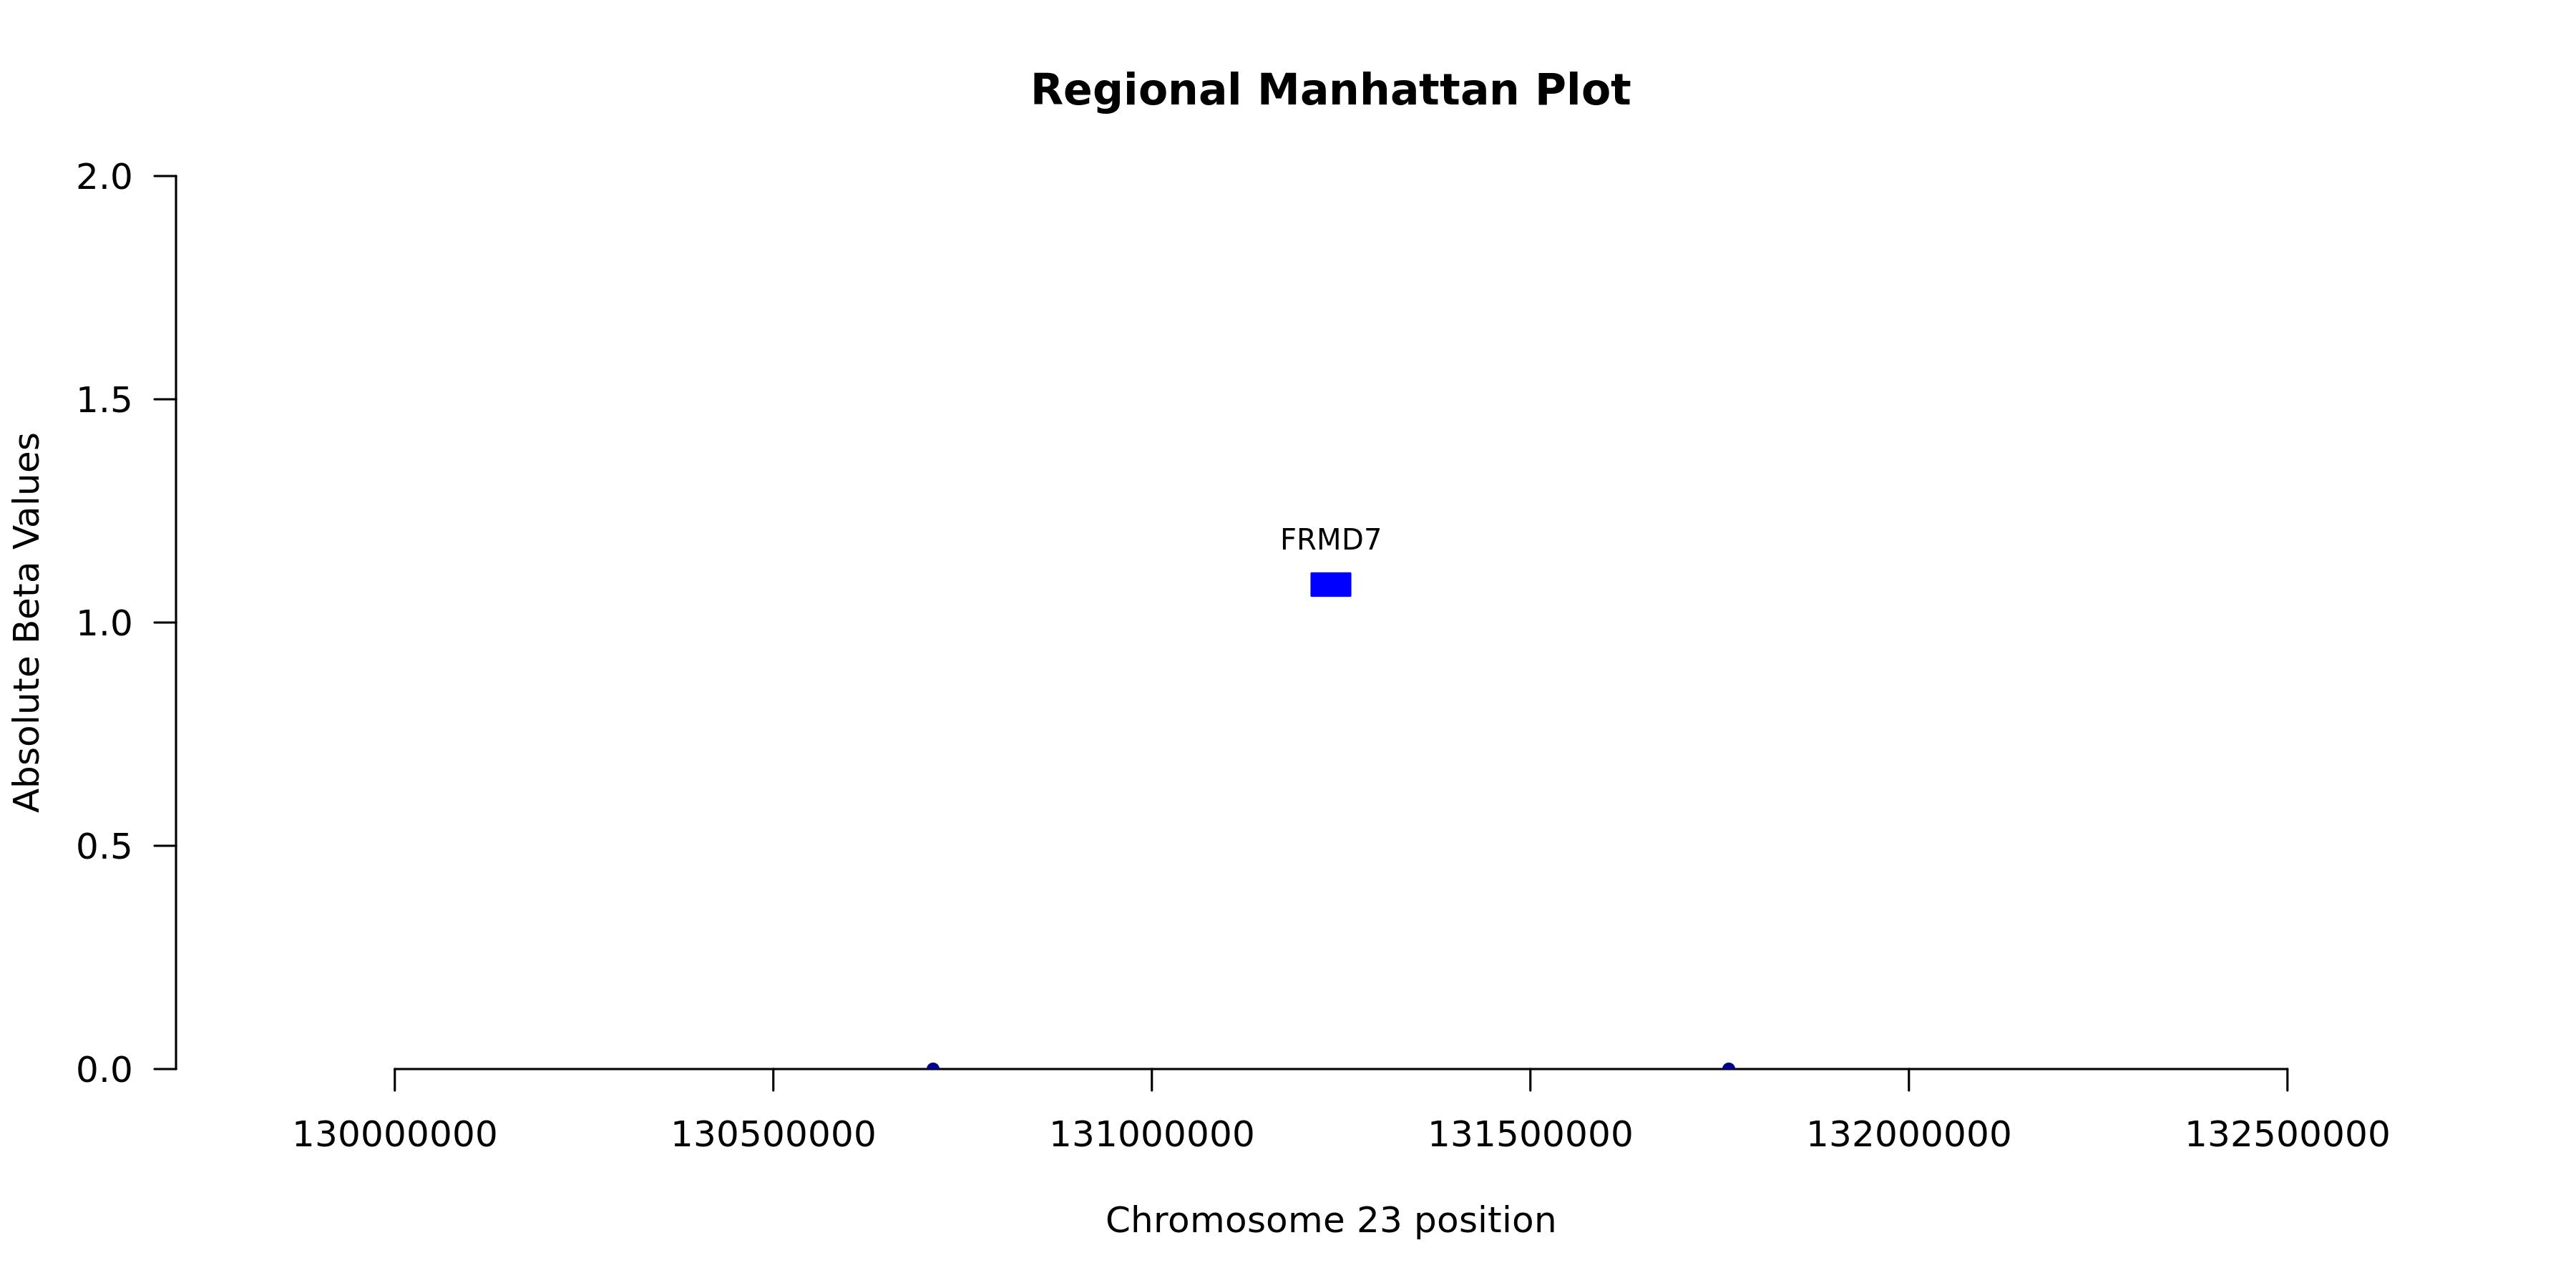
Regional Manhattan Plotenlarge ⤢
Model record
Field
Value
Gene
FRMD7
test_n
10538
sparsity
18
pearson_coefficent
0.0657080324654326
SE
0.0108679251783962
P_corr
1.54752369317873e-09
R2 Covariate Model
0.0015
R2 Full Model
0.0057
P
1.59457839354915e-13
P_full
2.55282456338495e-36
n_cis_pqtl
0
max_cis_pqtl
—
rank_max_cis_pqtl
—
mean_pqtl_beta
—
mean_nopqtl_beta
0.00580369231811127
percentage_pqtl
0
percentage_nopqtl
1
cis and genome-wide metrics
Field
Value
Gene
FRMD7
test_n_genomewide
10538
sparsity_genomewide
18
pearson_coefficent_genomewide
0.0657080324654326
SE_genomewide
0.0108679251783962
P_corr_genomewide
1.54752369317873e-09
R2_covariate_model_genomewide
0.0015002503998931
R2_full_model_genomewide
0.0057440407707875
P_genomewide
1.59457839354915e-13
P_full_genomewide
2.55282456338495e-36
n_cis_pqtl
0
max_cis_pqtl
NA
rank_max_cis_pqtl
NA
mean_pqtl_beta
NA
mean_nopqtl_beta
0.00580369231811127
percentage_pqtl
0
percentage_nopqtl
1
test_n_cis
NA
sparsity_cis
NA
pearson_coefficent_cis
NA
SE_cis
NA
P_corr_cis
NA
R2_covariate_model_cis
NA
R2_full_model_cis
NA
P_cis
NA
P_full_cis
NA