DDX58
Olink Explore plasma protein · SNPBoost PRS model
R2 Full Model
0.0646
pearson_coefficent
0.2467
sparsity
92
n_cis_pqtl
11
max_cis_pqtl
rs138425677
Diagnostics
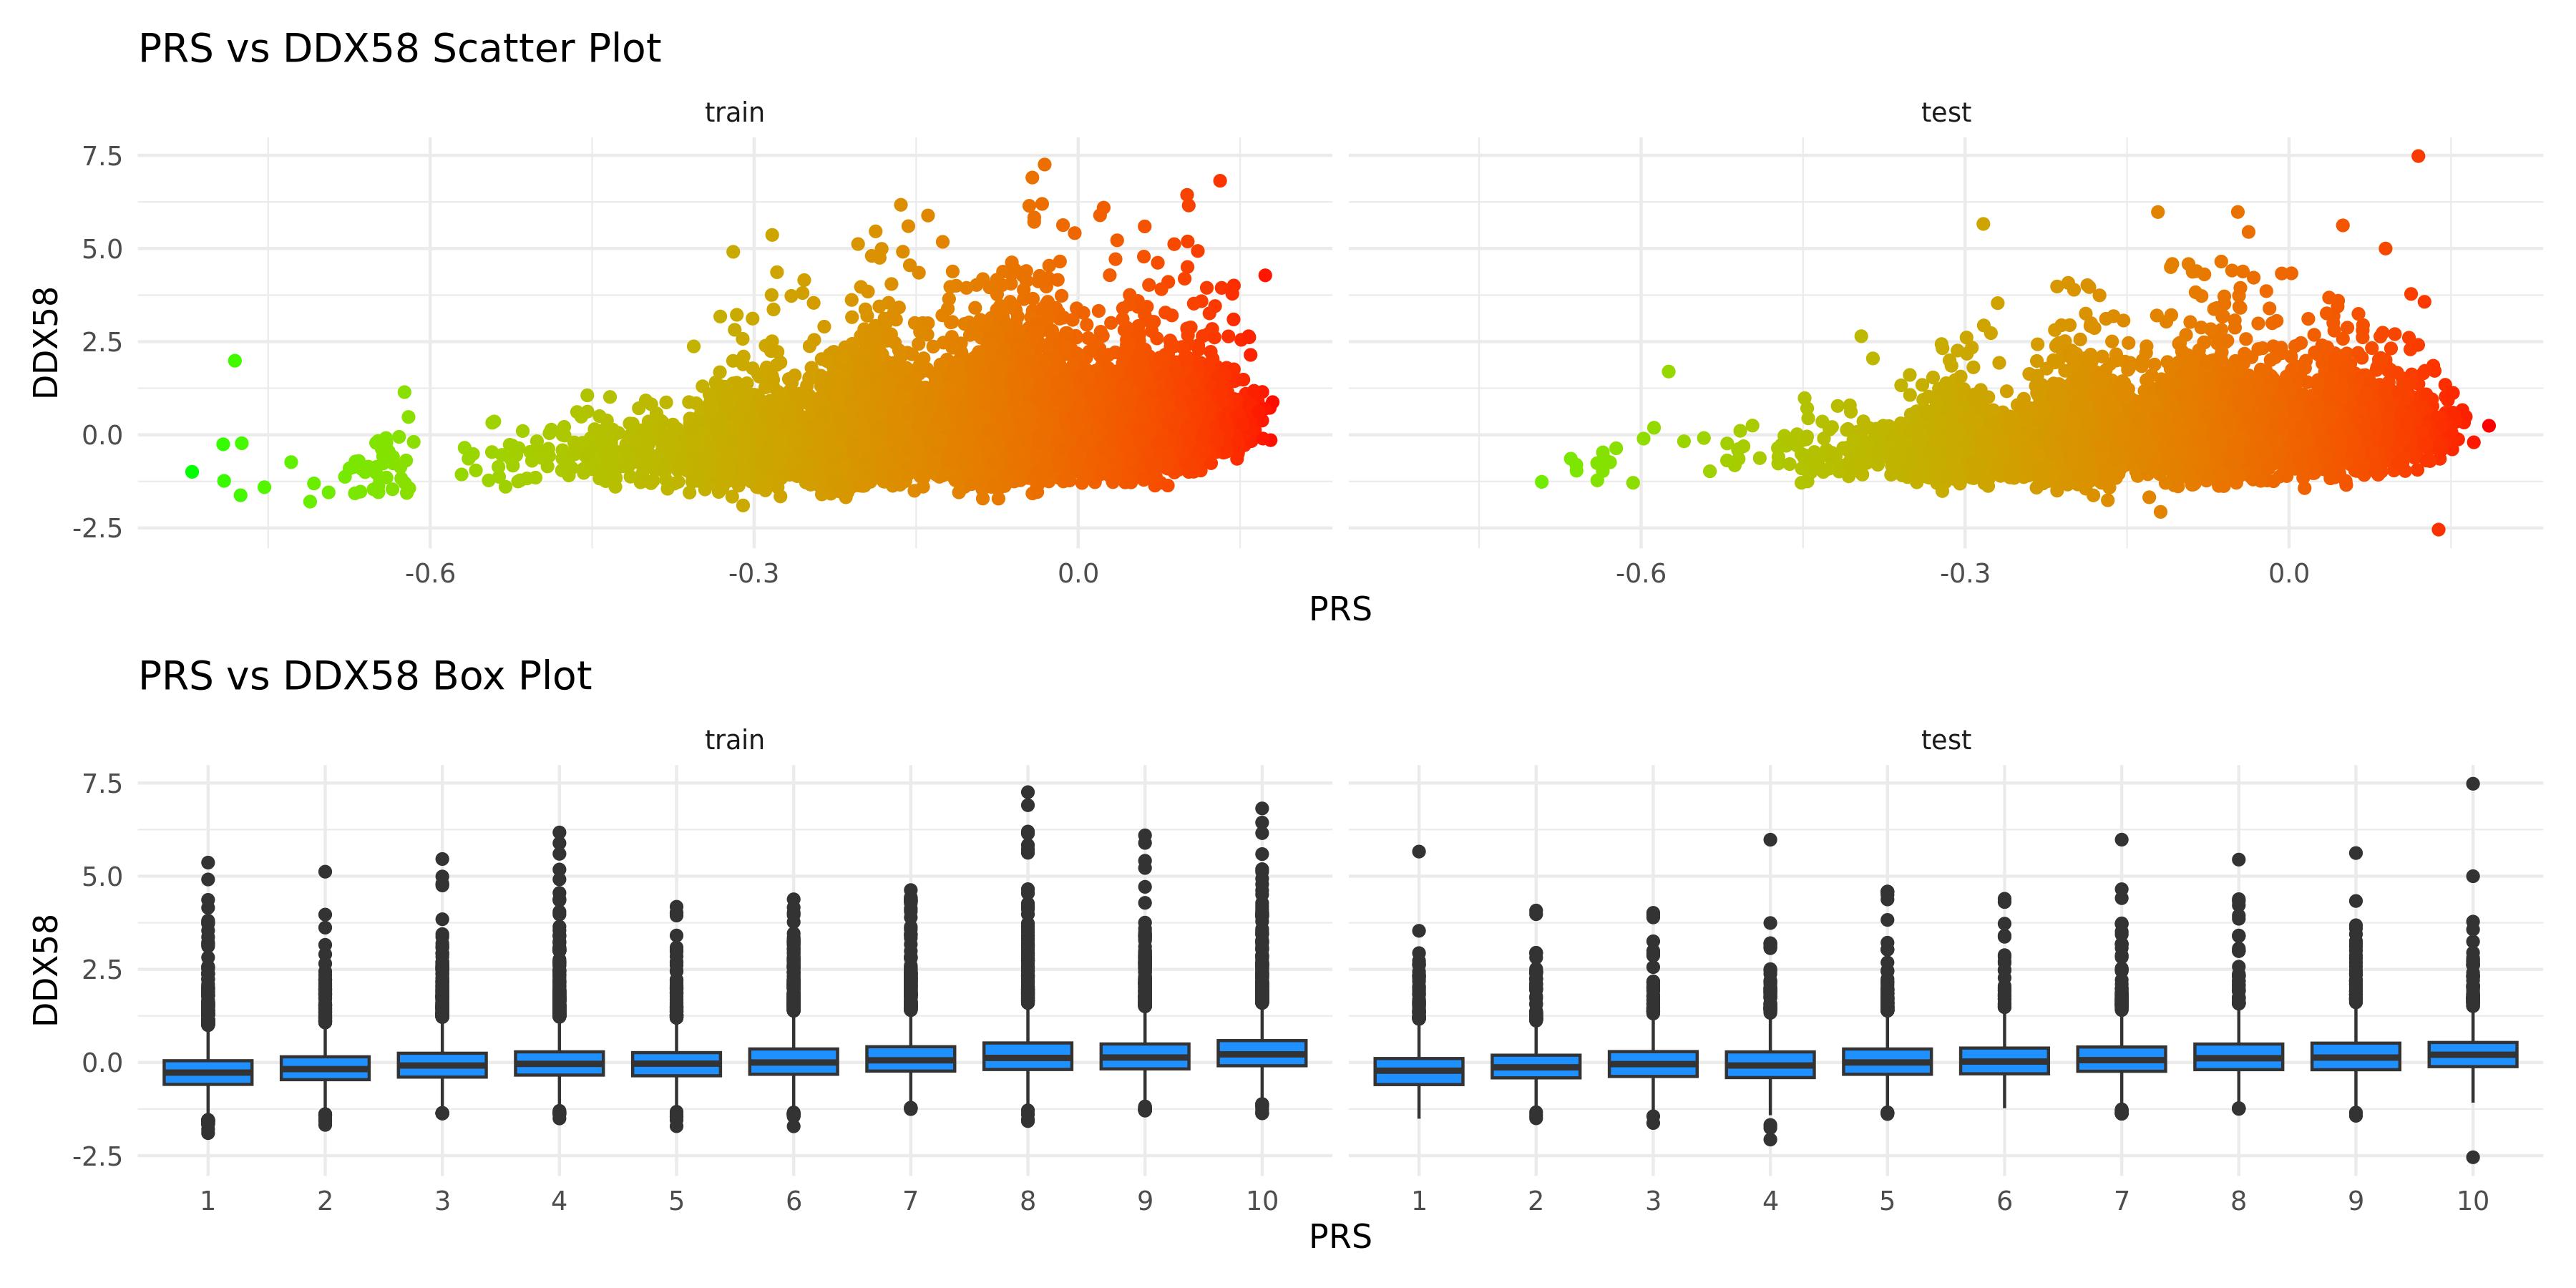
PRS scatter and box plotsenlarge ⤢
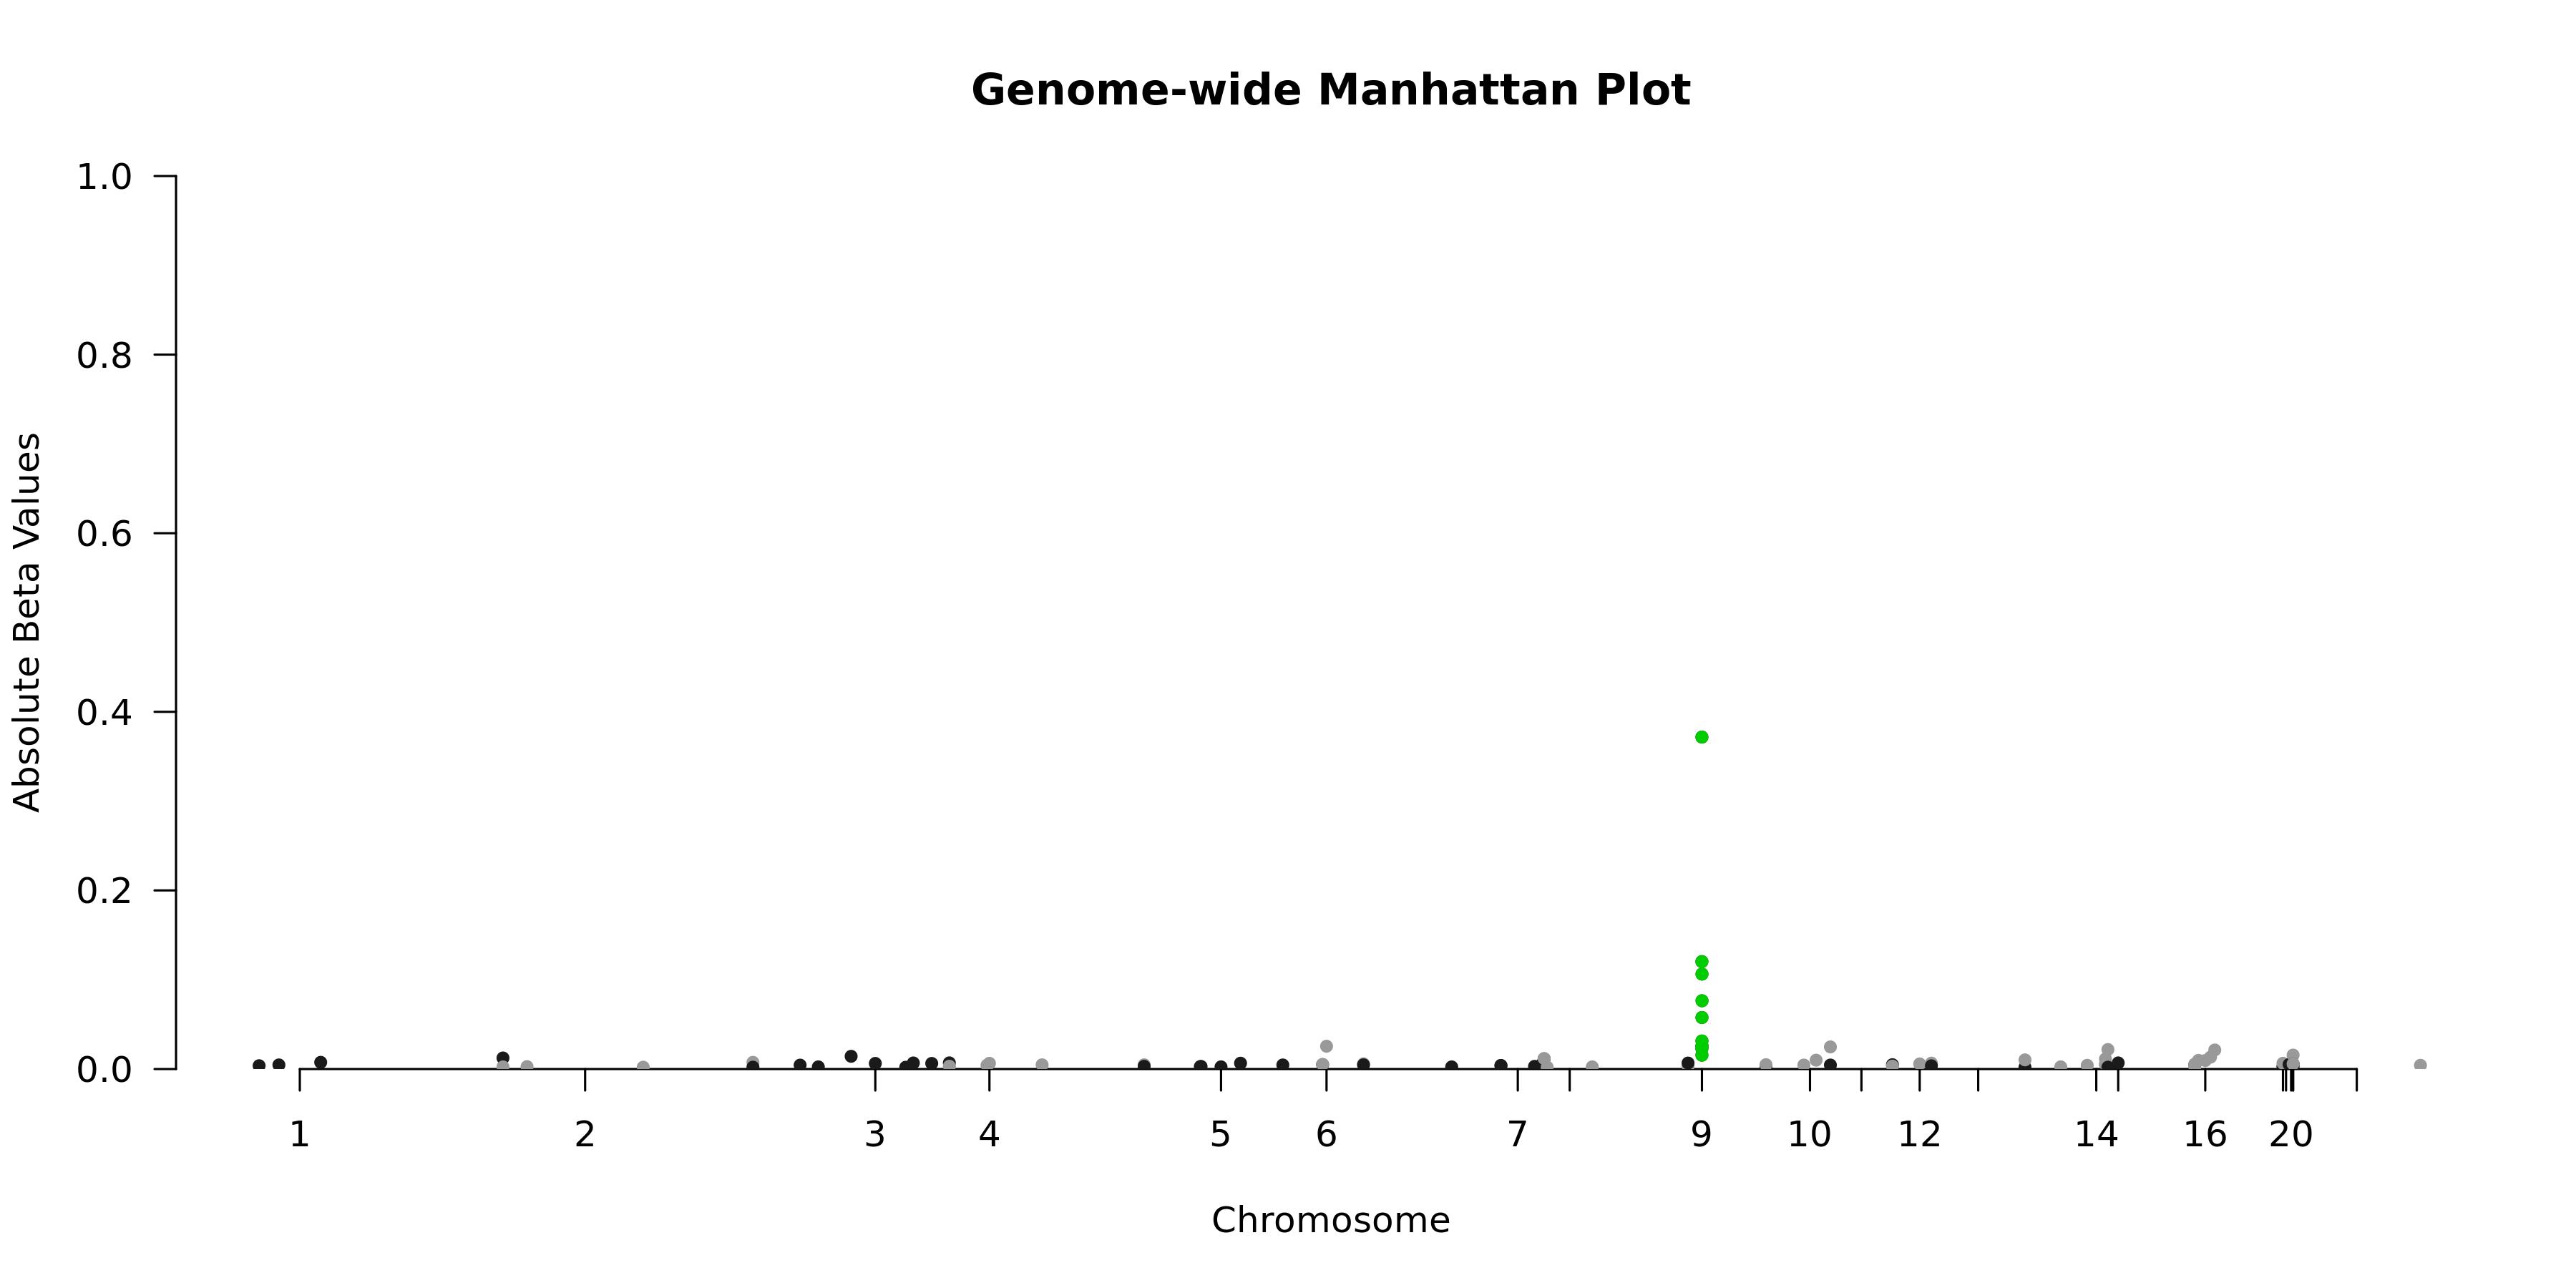
Genome-wide Manhattan Plotenlarge ⤢
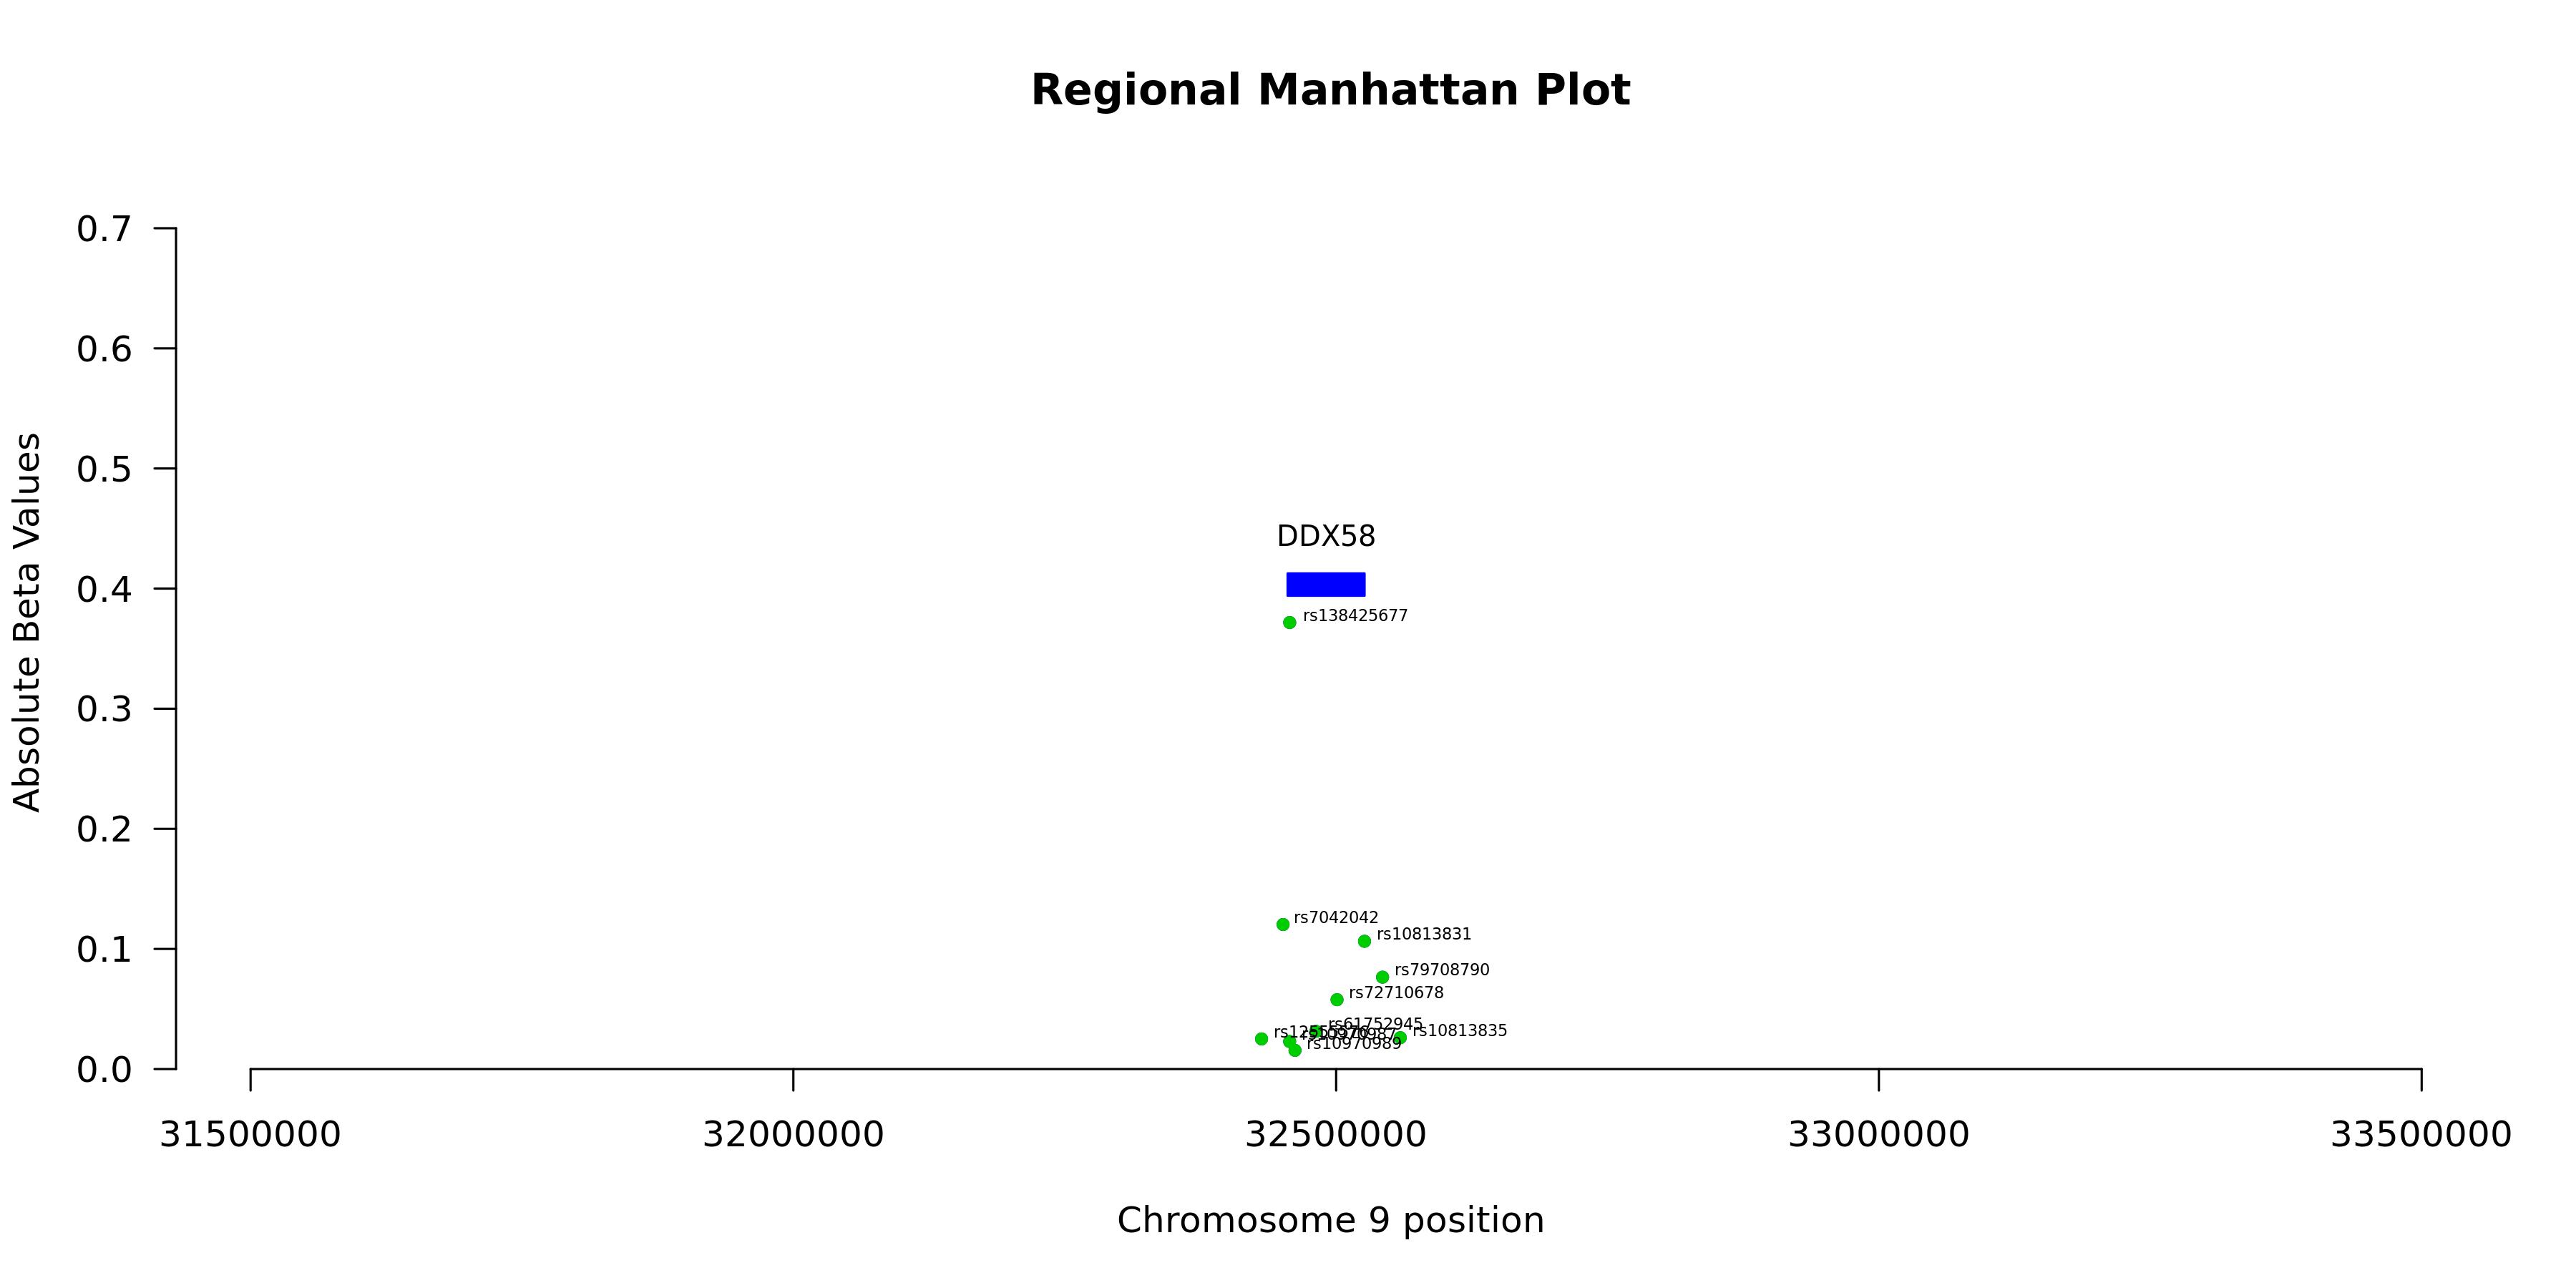
Regional Manhattan Plotenlarge ⤢
Model record
Field
Value
Gene
DDX58
test_n
10538
sparsity
92
pearson_coefficent
0.246734305669407
SE
0.00968937836110636
P_corr
1.19824307397702e-138
R2 Covariate Model
0.0048
R2 Full Model
0.0646
P
1.98350308964303e-147
P_full
0
n_cis_pqtl
11
max_cis_pqtl
rs138425677
rank_max_cis_pqtl
1
mean_pqtl_beta
0.0778174189642151
mean_nopqtl_beta
0.00628339959240894
percentage_pqtl
0.119565217391304
percentage_nopqtl
0.880434782608696
cis and genome-wide metrics
Field
Value
Gene
DDX58
test_n_genomewide
10538
sparsity_genomewide
92
pearson_coefficent_genomewide
0.246734305669407
SE_genomewide
0.00968937836110636
P_corr_genomewide
1.19824307397702e-138
R2_covariate_model_genomewide
0.00476598024252084
R2_full_model_genomewide
0.0646276586982831
P_genomewide
1.98350308964303e-147
P_full_genomewide
0
n_cis_pqtl
11
max_cis_pqtl
rs138425677
rank_max_cis_pqtl
1
mean_pqtl_beta
0.0778174189642151
mean_nopqtl_beta
0.00628339959240894
percentage_pqtl
0.119565217391304
percentage_nopqtl
0.880434782608696
test_n_cis
10538
sparsity_cis
11
pearson_coefficent_cis
0.230369036968558
SE_cis
0.00972957405528262
P_corr_cis
1.23813970984469e-120
R2_covariate_model_cis
0.00476598024252084
R2_full_model_cis
0.0569373481401729
P_cis
1.23379310728915e-129
P_full_cis
3.25597143065122e-301