CTSS
Olink Explore plasma protein · SNPBoost PRS model
R2 Full Model
0.2526
pearson_coefficent
0.4784
sparsity
822
n_cis_pqtl
34
max_cis_pqtl
rs41271951
Diagnostics
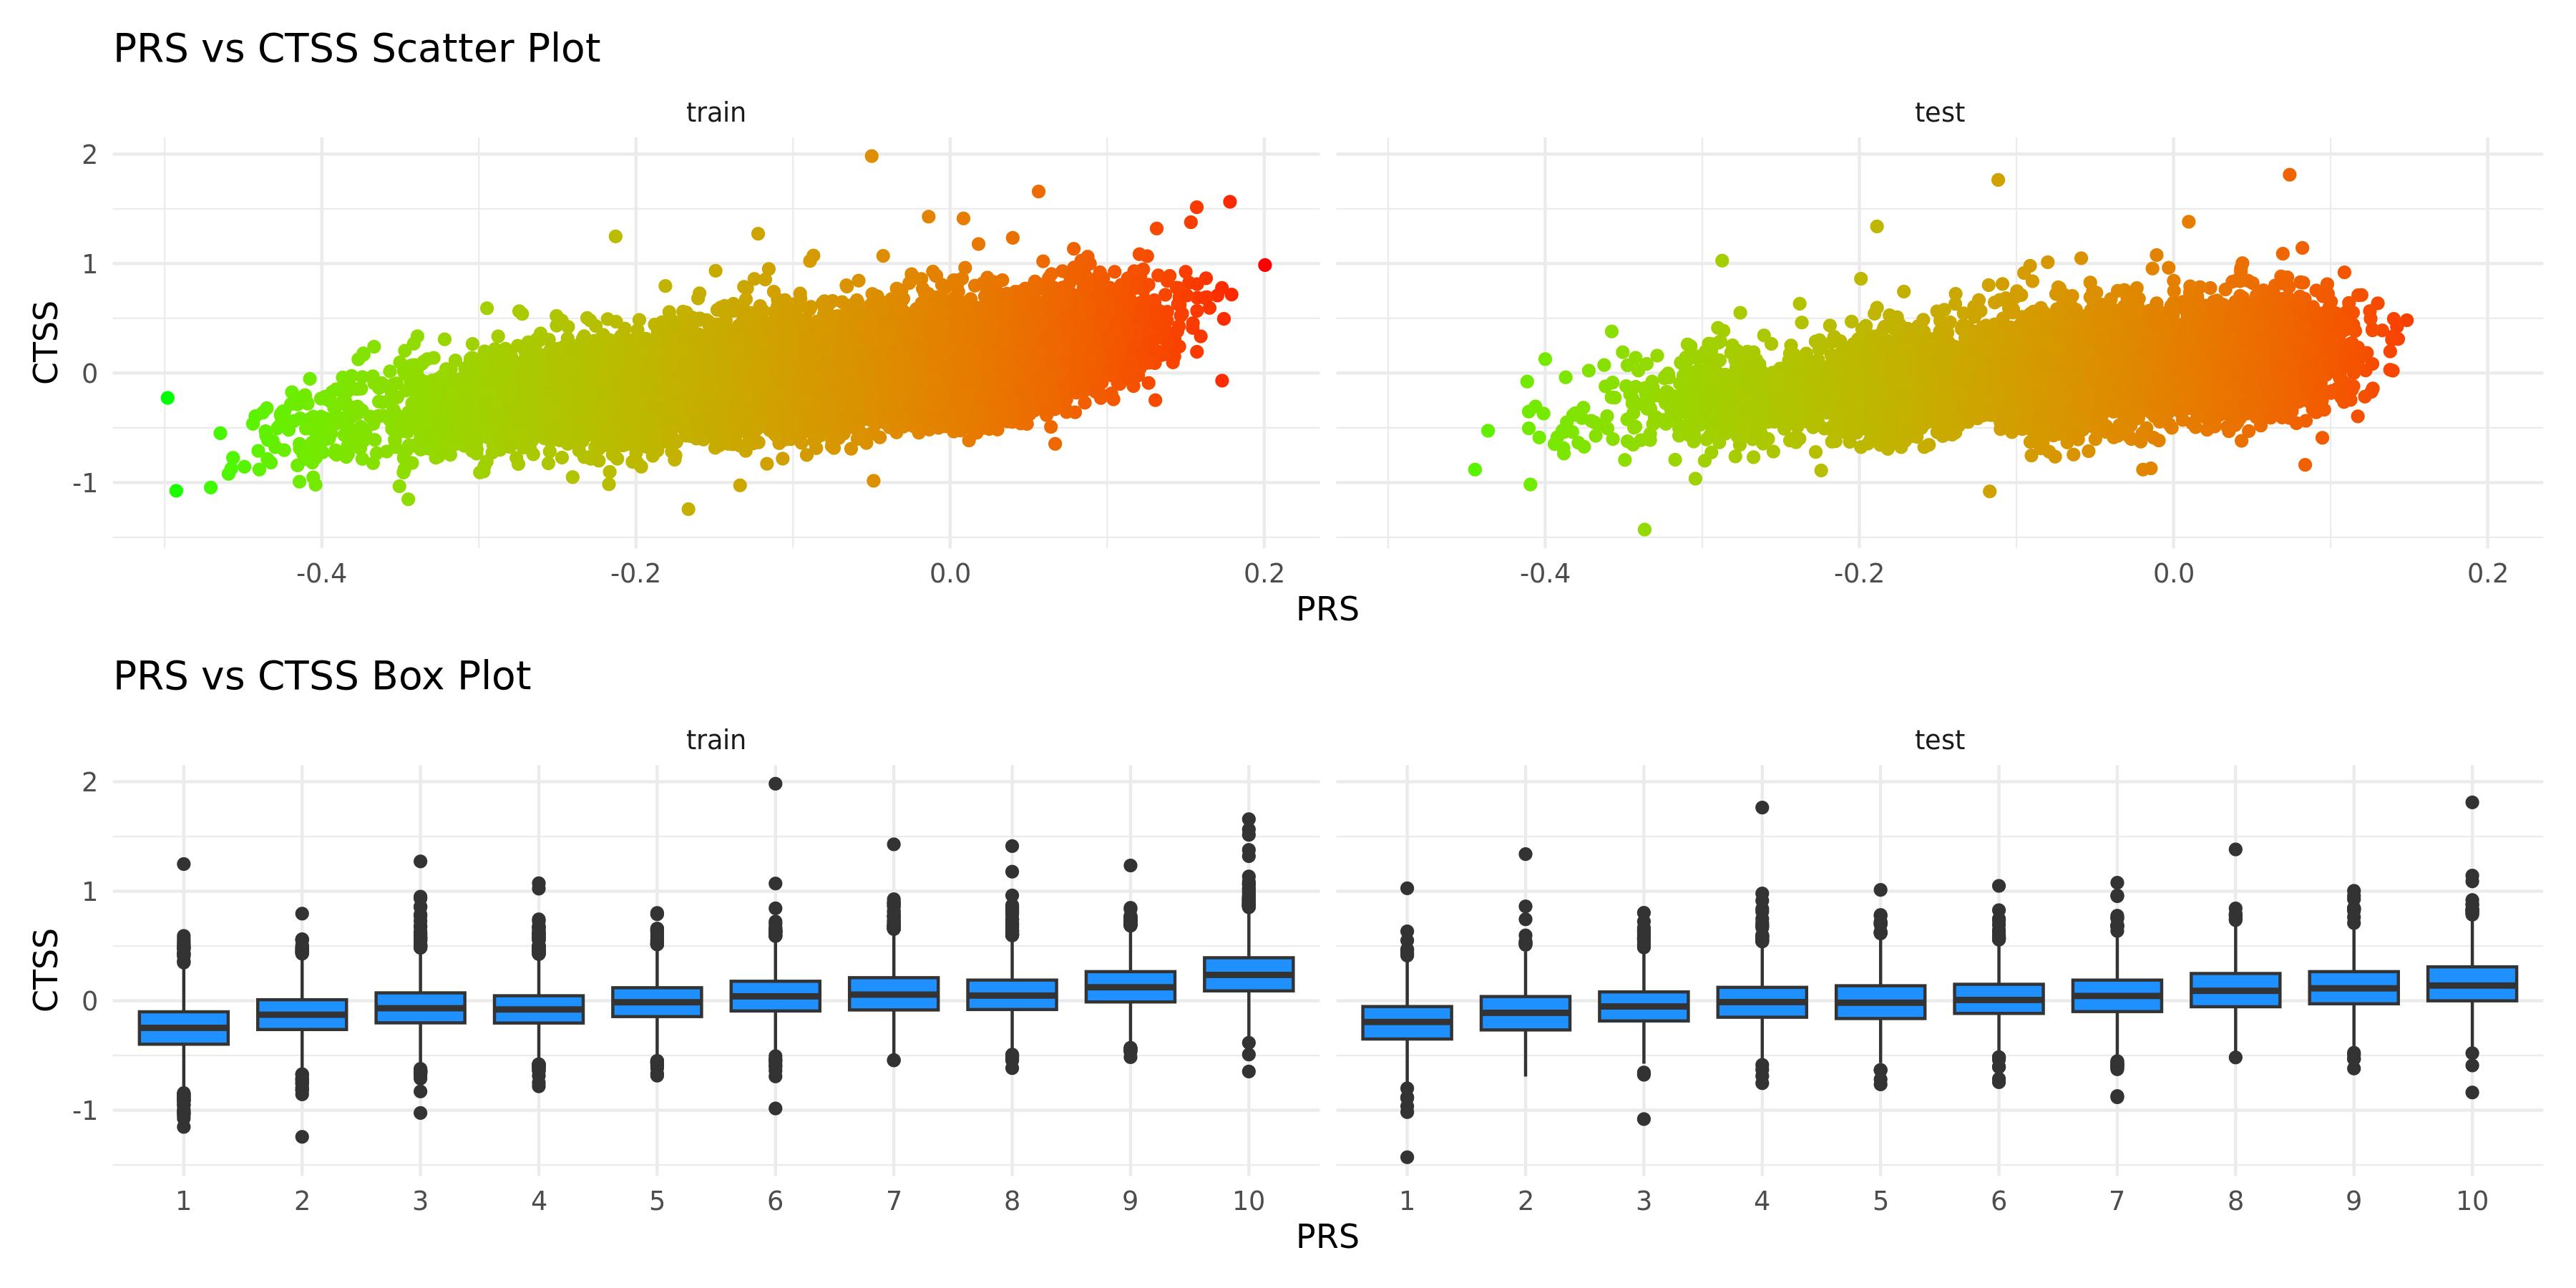
PRS scatter and box plotsenlarge ⤢
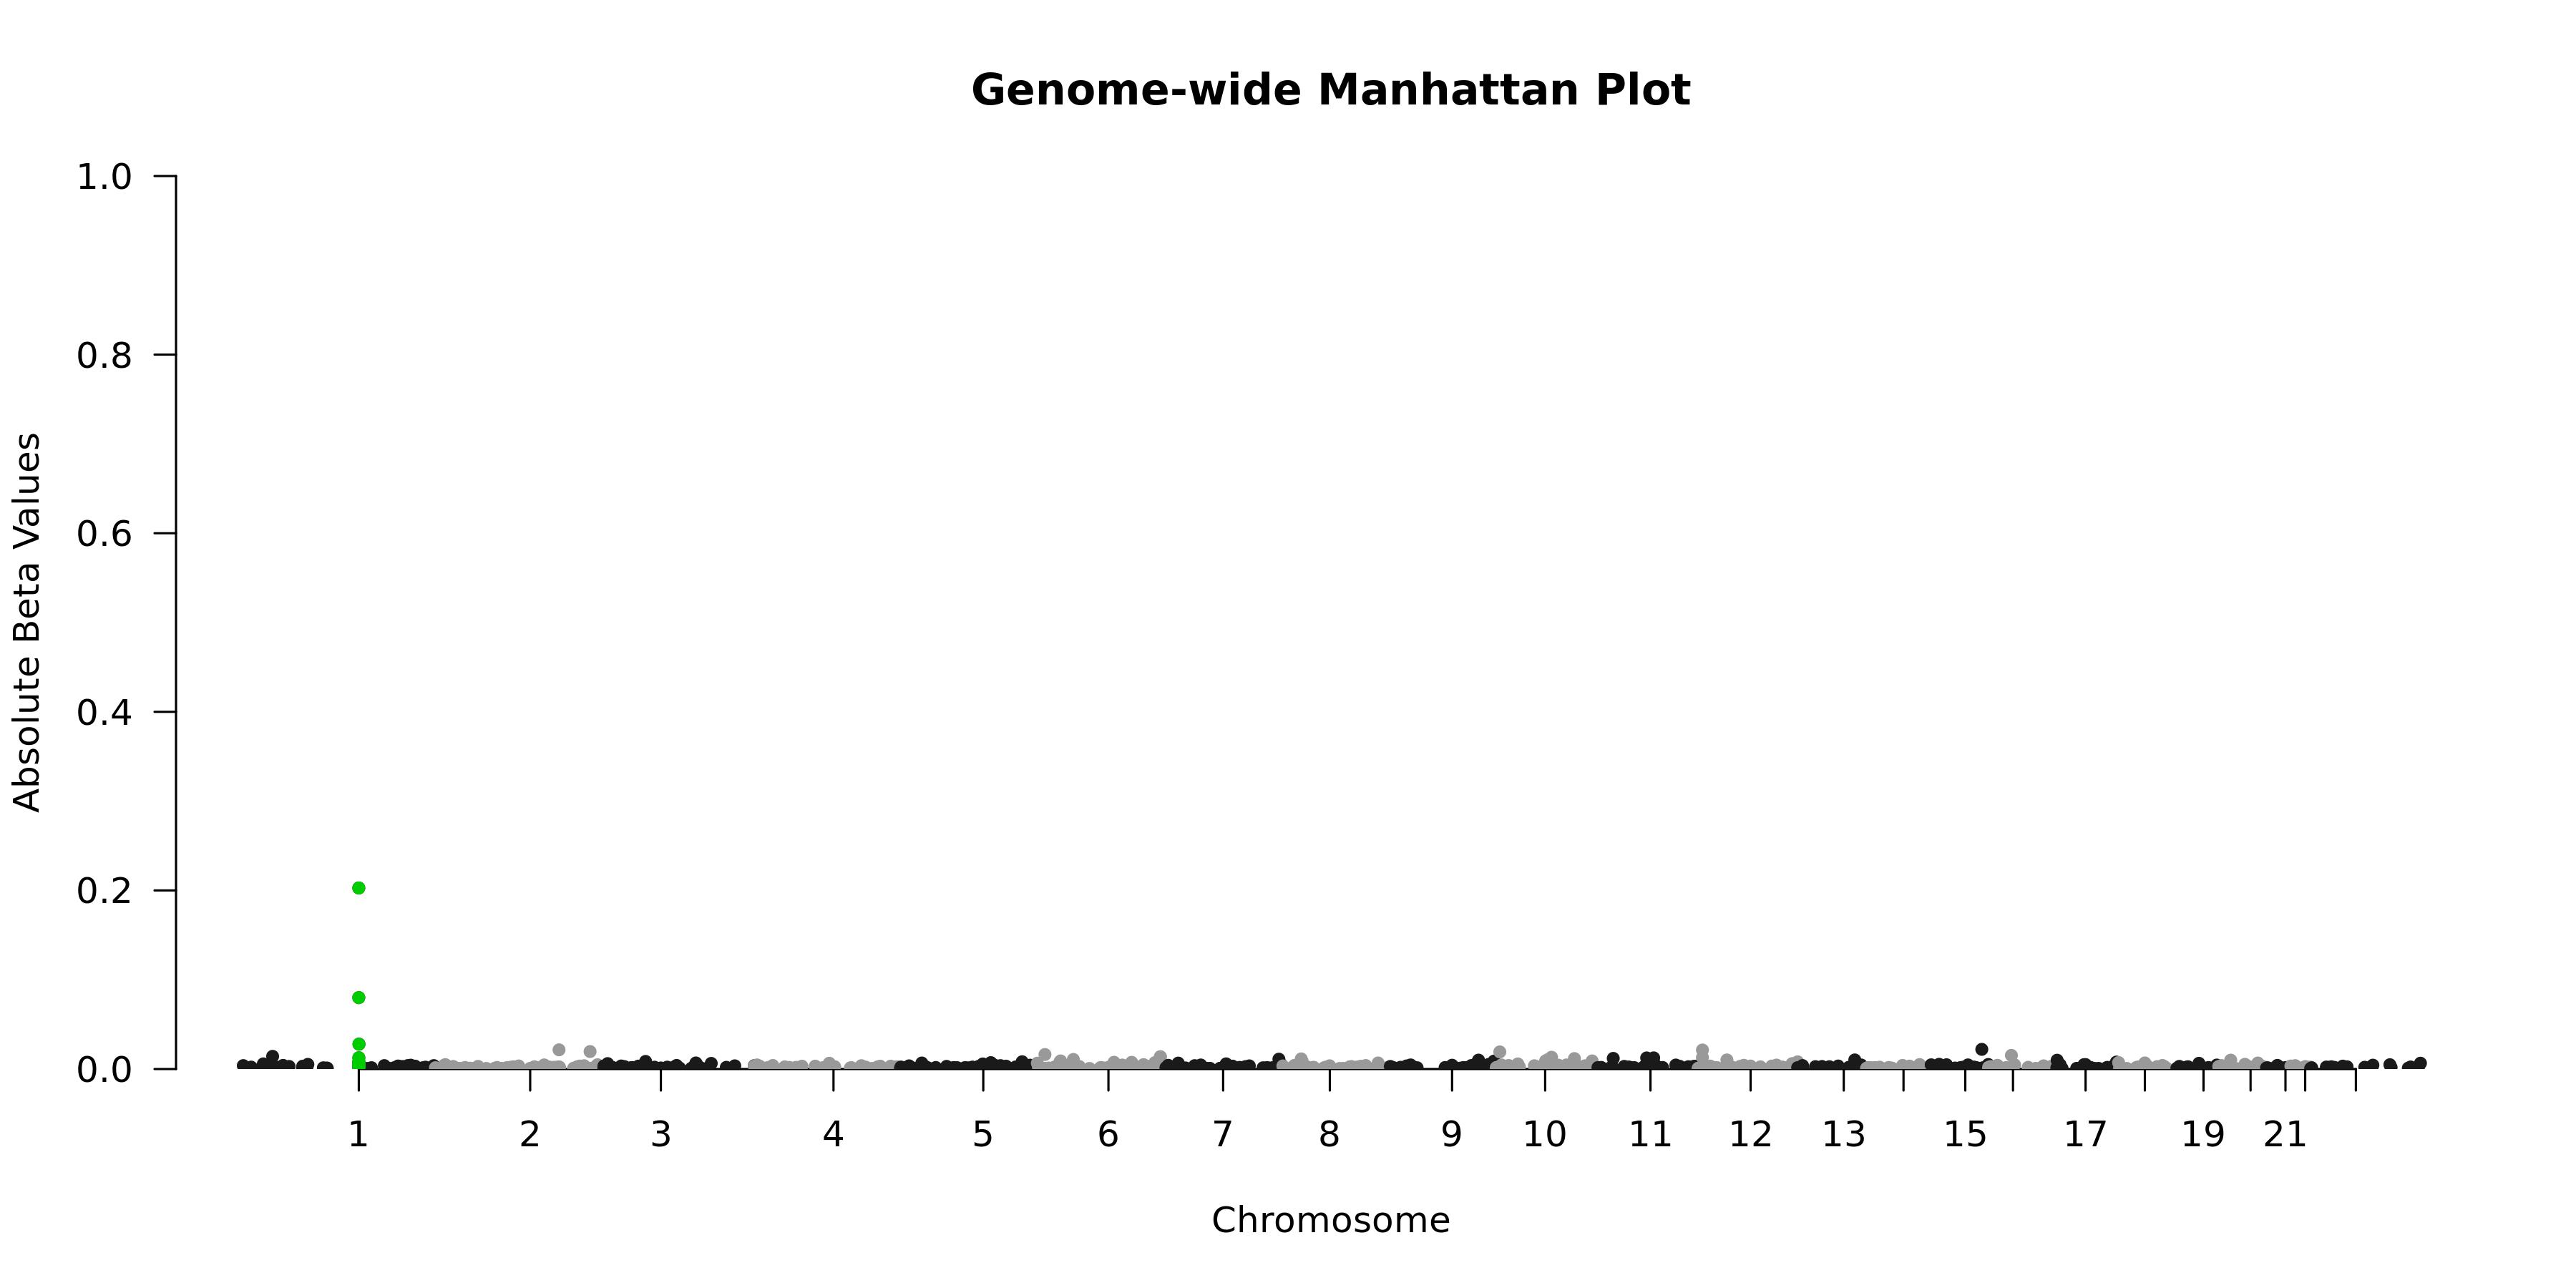
Genome-wide Manhattan Plotenlarge ⤢
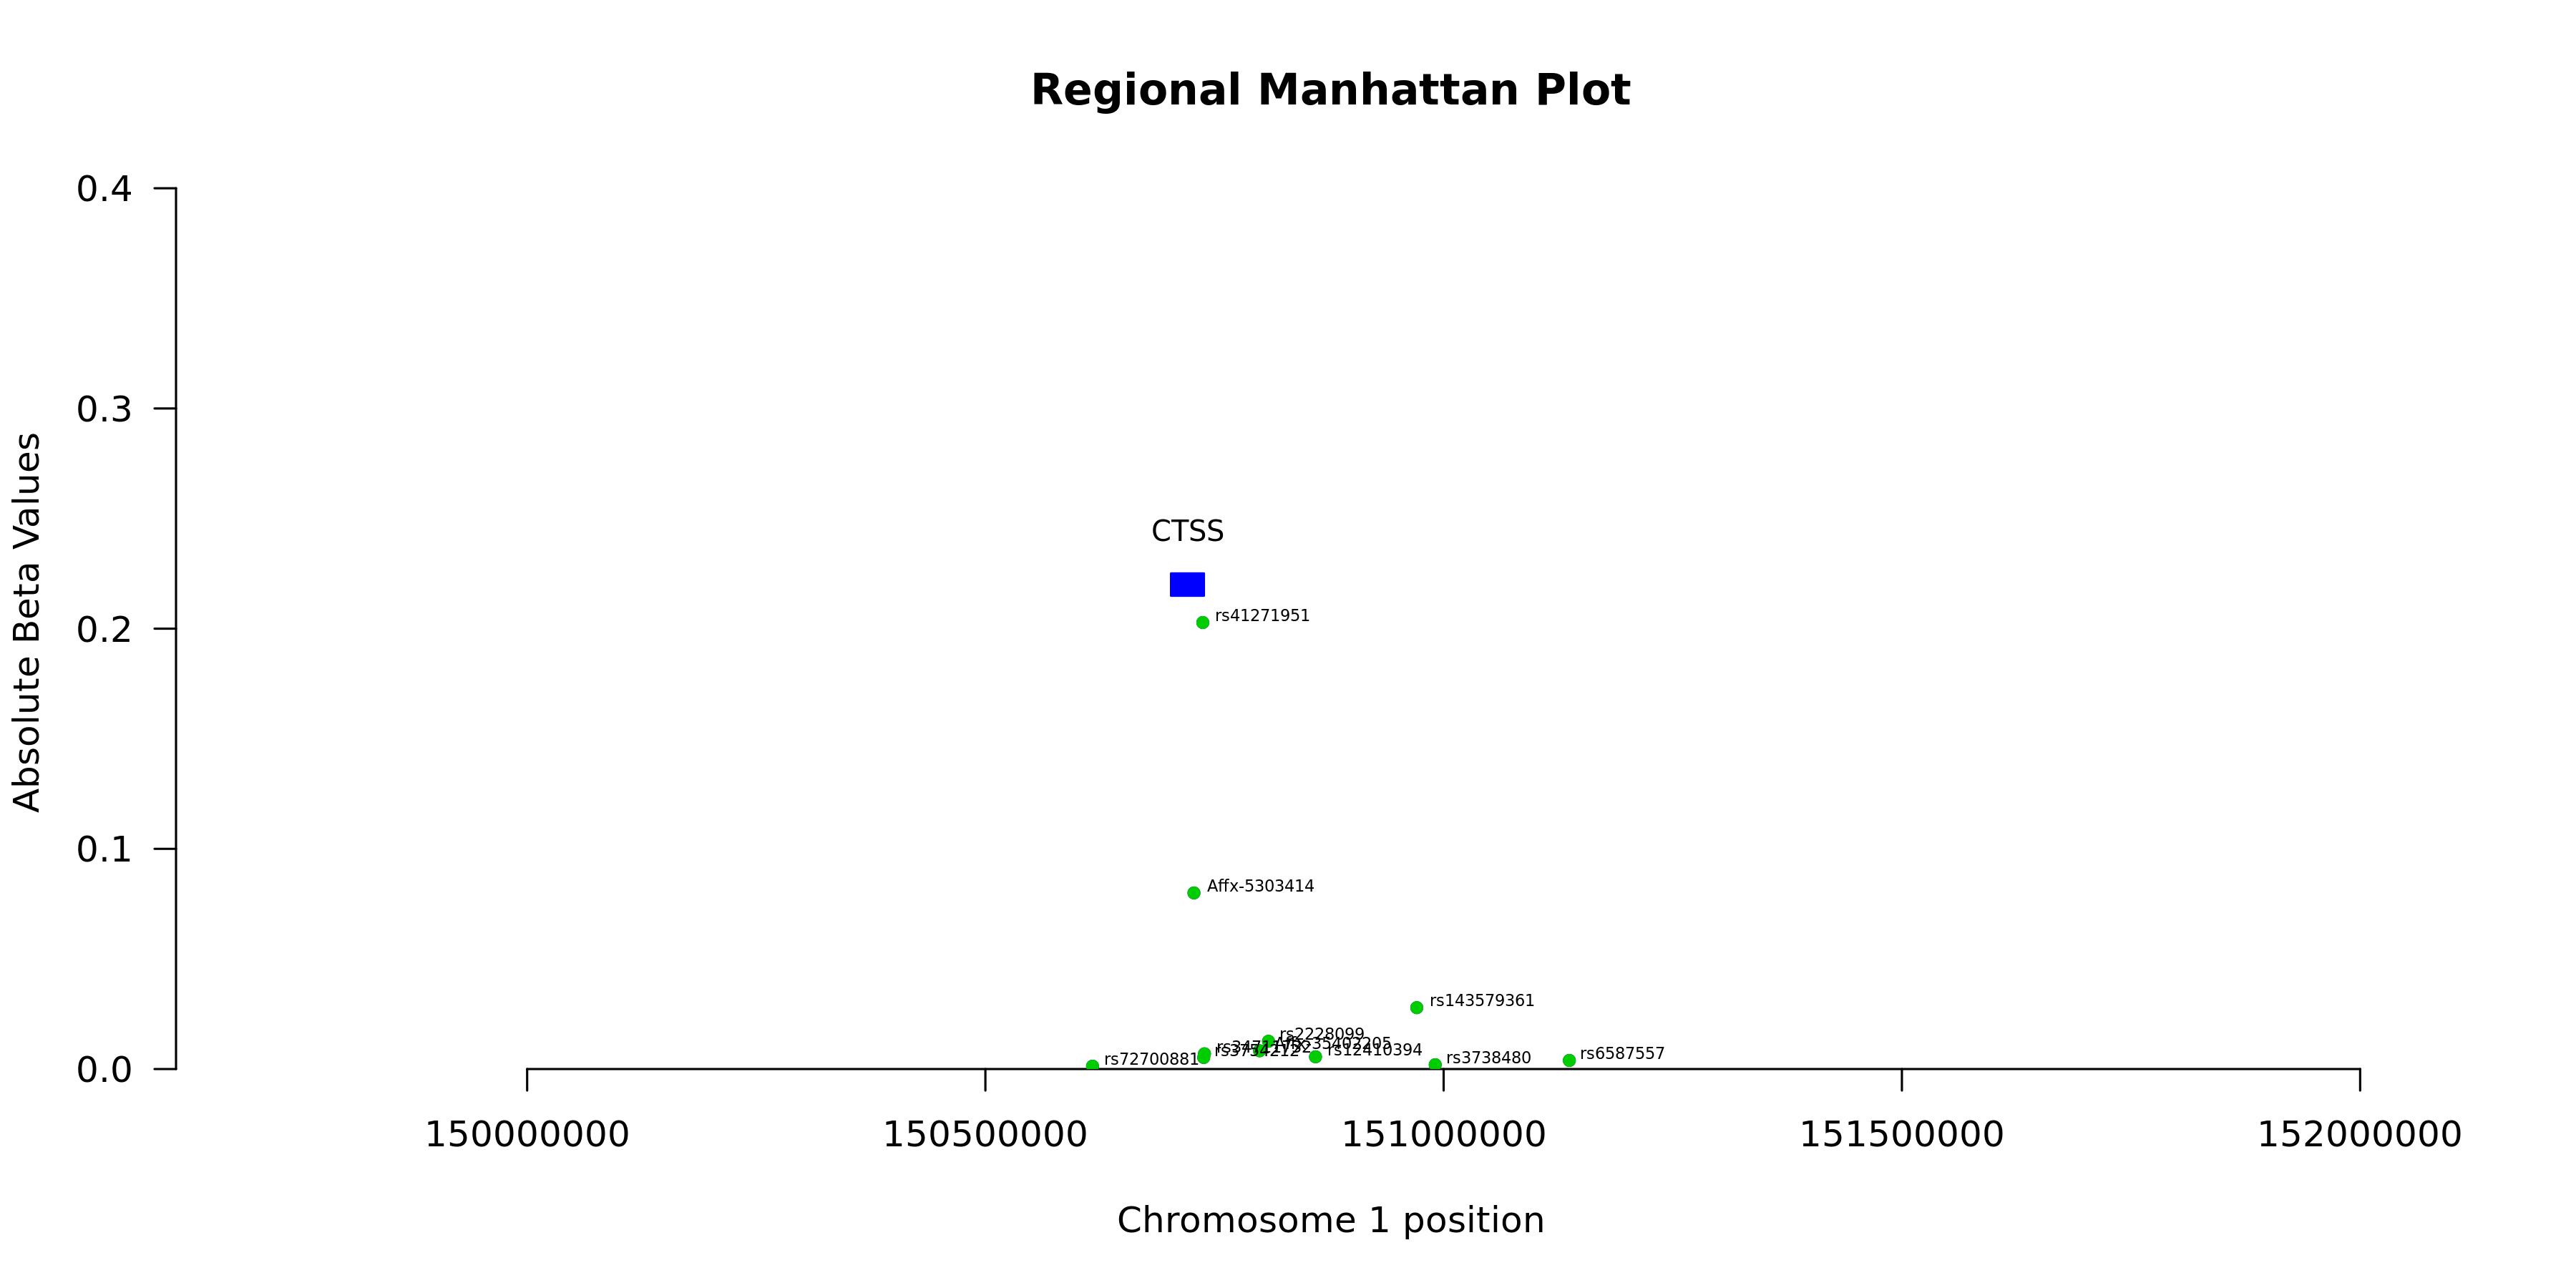
Regional Manhattan Plotenlarge ⤢
Model record
Field
Value
Gene
CTSS
test_n
10538
sparsity
822
pearson_coefficent
0.478378607261486
SE
0.00980580715084796
P_corr
0
R2 Covariate Model
0.0295
R2 Full Model
0.2526
P
0
P_full
0
n_cis_pqtl
34
max_cis_pqtl
rs41271951
rank_max_cis_pqtl
1
mean_pqtl_beta
0.0119153999533466
mean_nopqtl_beta
0.0024929281801601
percentage_pqtl
0.0413625304136253
percentage_nopqtl
0.958637469586375
cis and genome-wide metrics
Field
Value
Gene
CTSS
test_n_genomewide
10538
sparsity_genomewide
822
pearson_coefficent_genomewide
0.478378607261486
SE_genomewide
0.00980580715084796
P_corr_genomewide
0
R2_covariate_model_genomewide
0.0295451422628373
R2_full_model_genomewide
0.252602110887551
P_genomewide
0
P_full_genomewide
0
n_cis_pqtl
34
max_cis_pqtl
rs41271951
rank_max_cis_pqtl
1
mean_pqtl_beta
0.0119153999533466
mean_nopqtl_beta
0.0024929281801601
percentage_pqtl
0.0413625304136253
percentage_nopqtl
0.958637469586375
test_n_cis
10538
sparsity_cis
34
pearson_coefficent_cis
0.405234294016157
SE_cis
0.0102084579801907
P_corr_cis
1.11253736618342e-308
R2_covariate_model_cis
0.0295451422628371
R2_full_model_cis
0.190164899144479
P_cis
0
P_full_cis
0