CRACR2A
Olink Explore plasma protein · SNPBoost PRS model
R2 Full Model
0.026
pearson_coefficent
0.1574
sparsity
59
n_cis_pqtl
11
max_cis_pqtl
rs10744628
Diagnostics
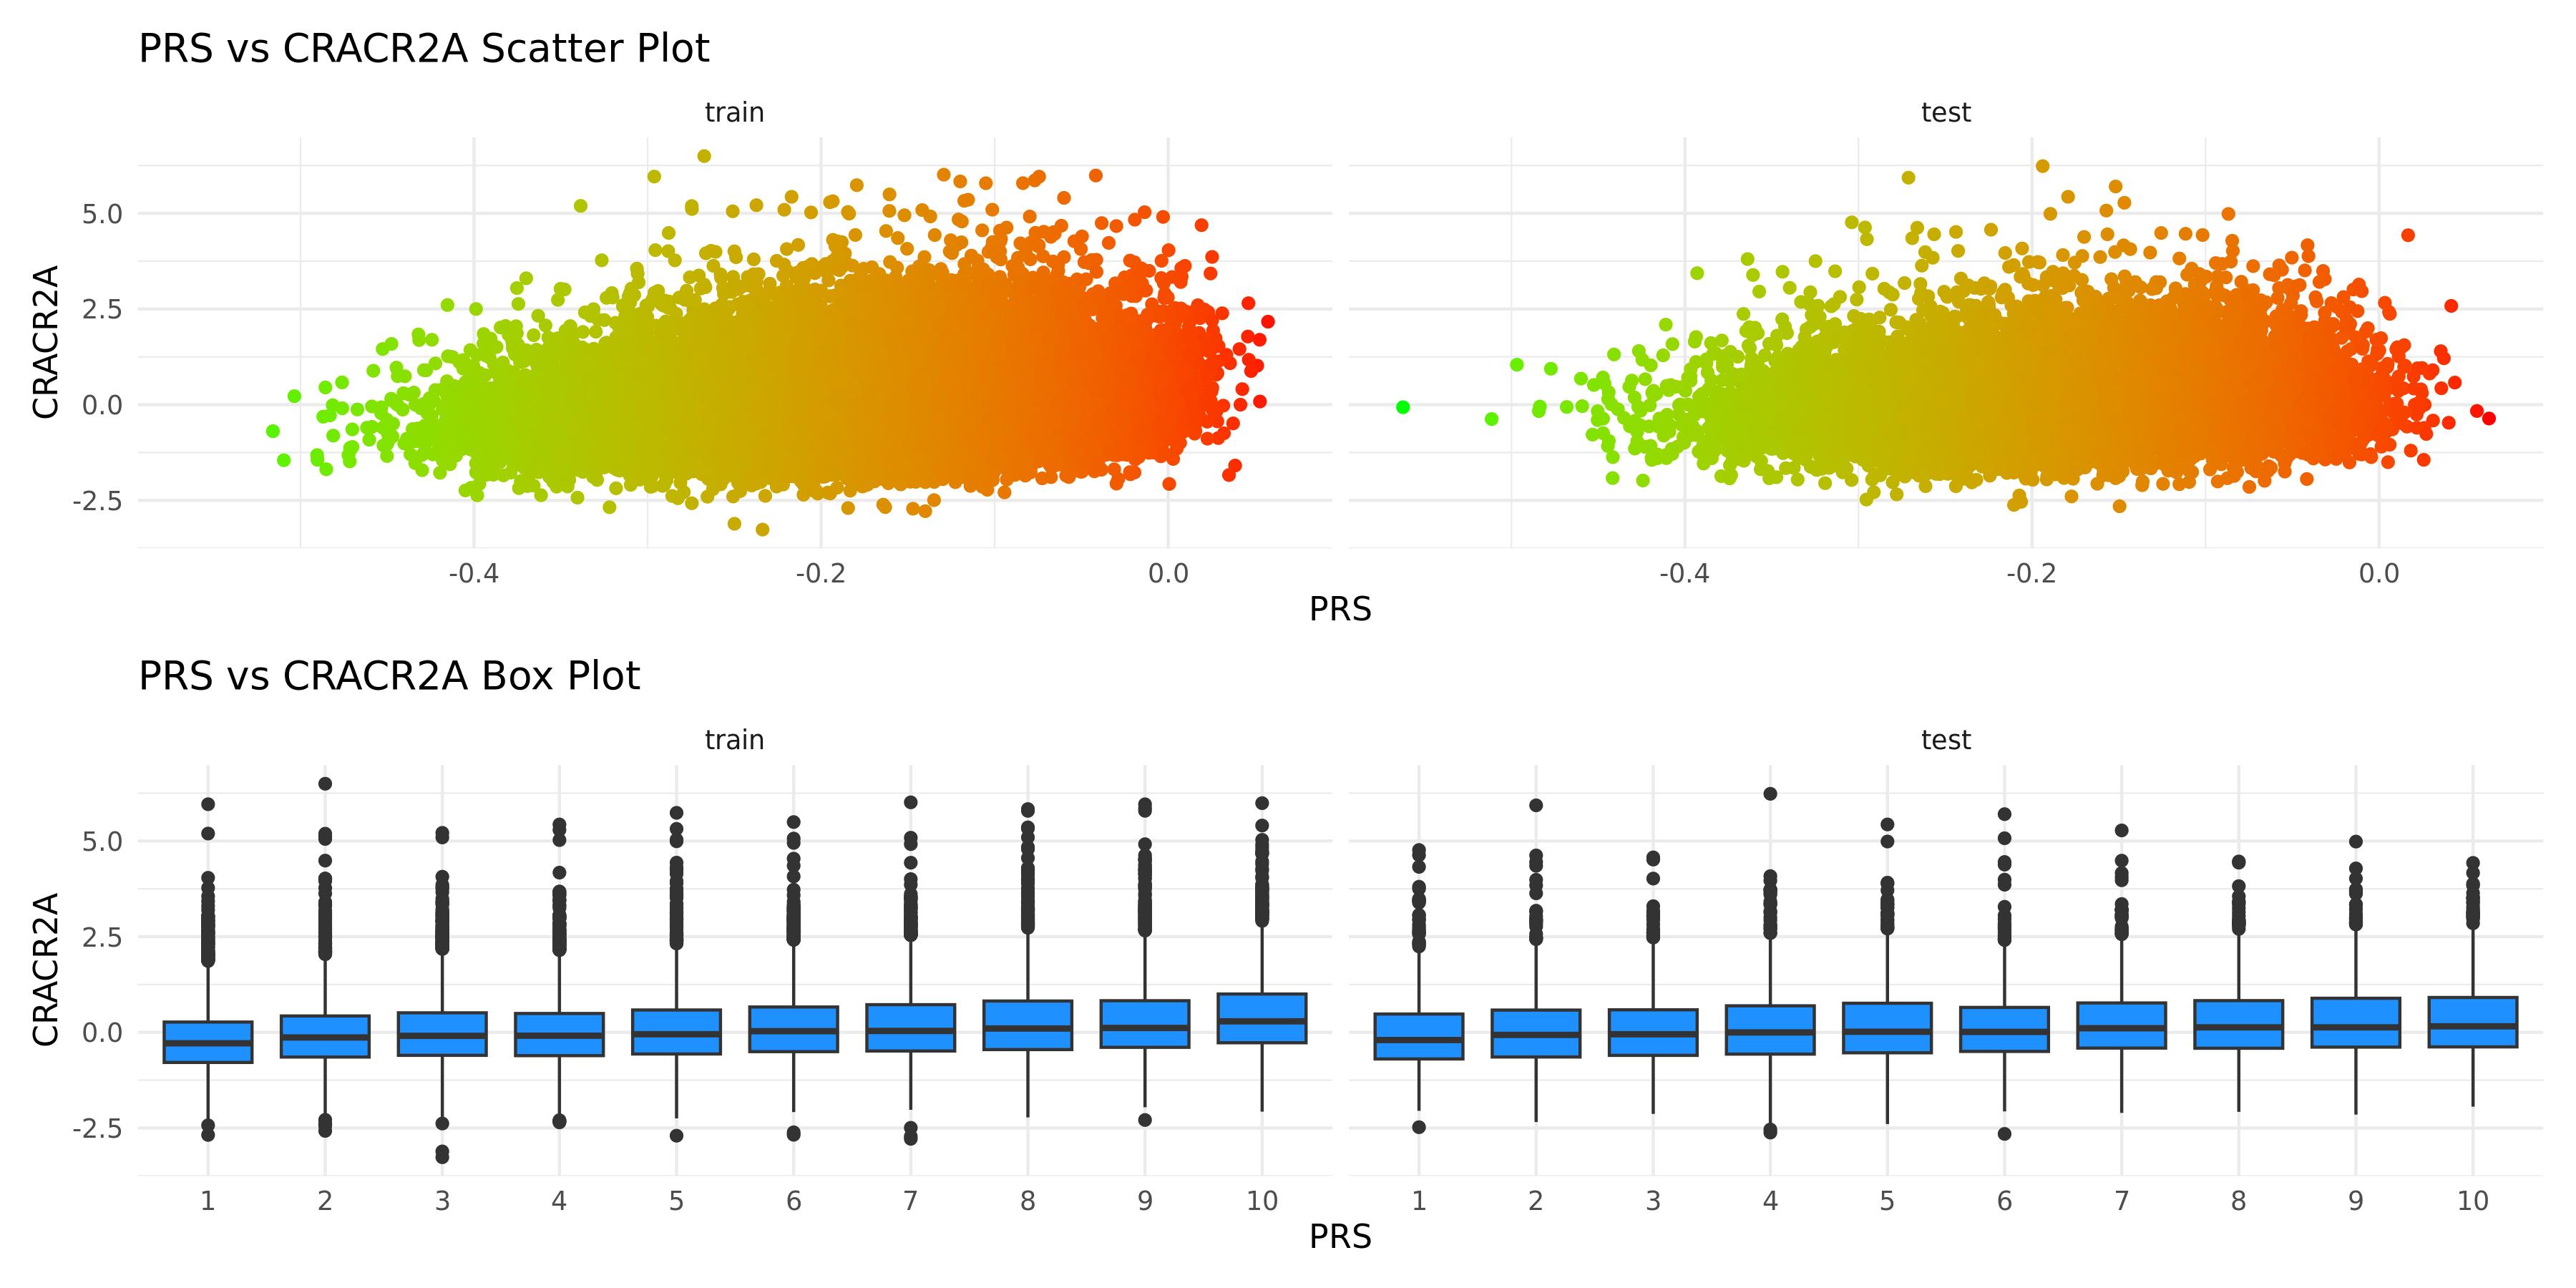
PRS scatter and box plotsenlarge ⤢
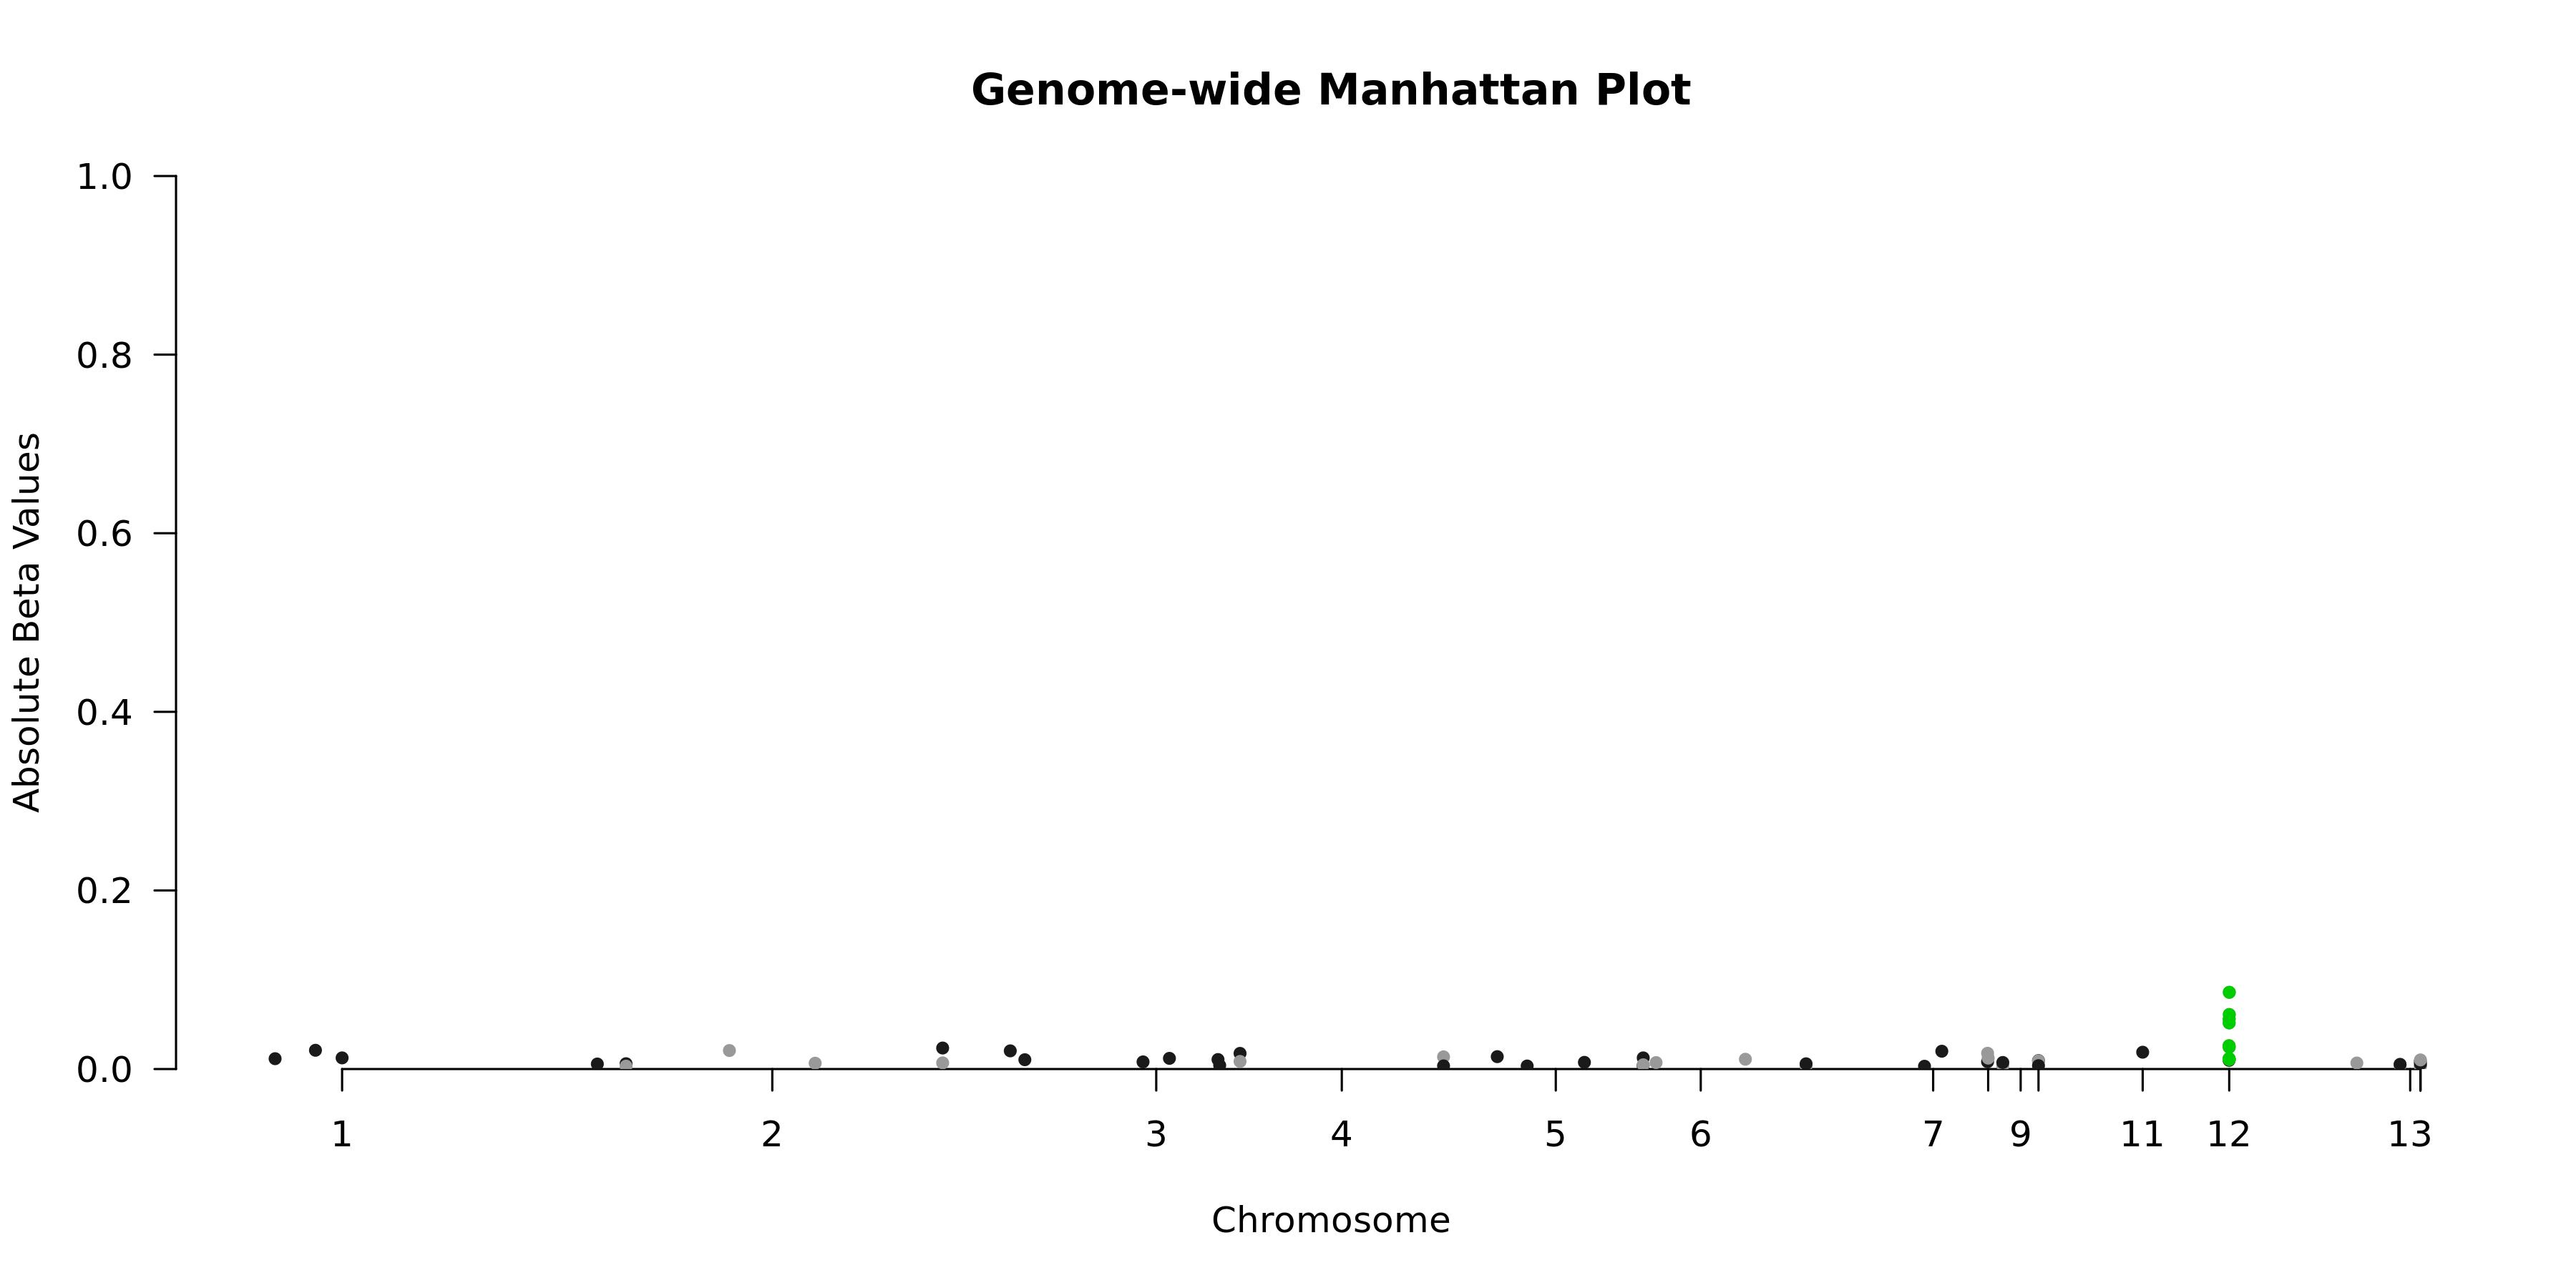
Genome-wide Manhattan Plotenlarge ⤢
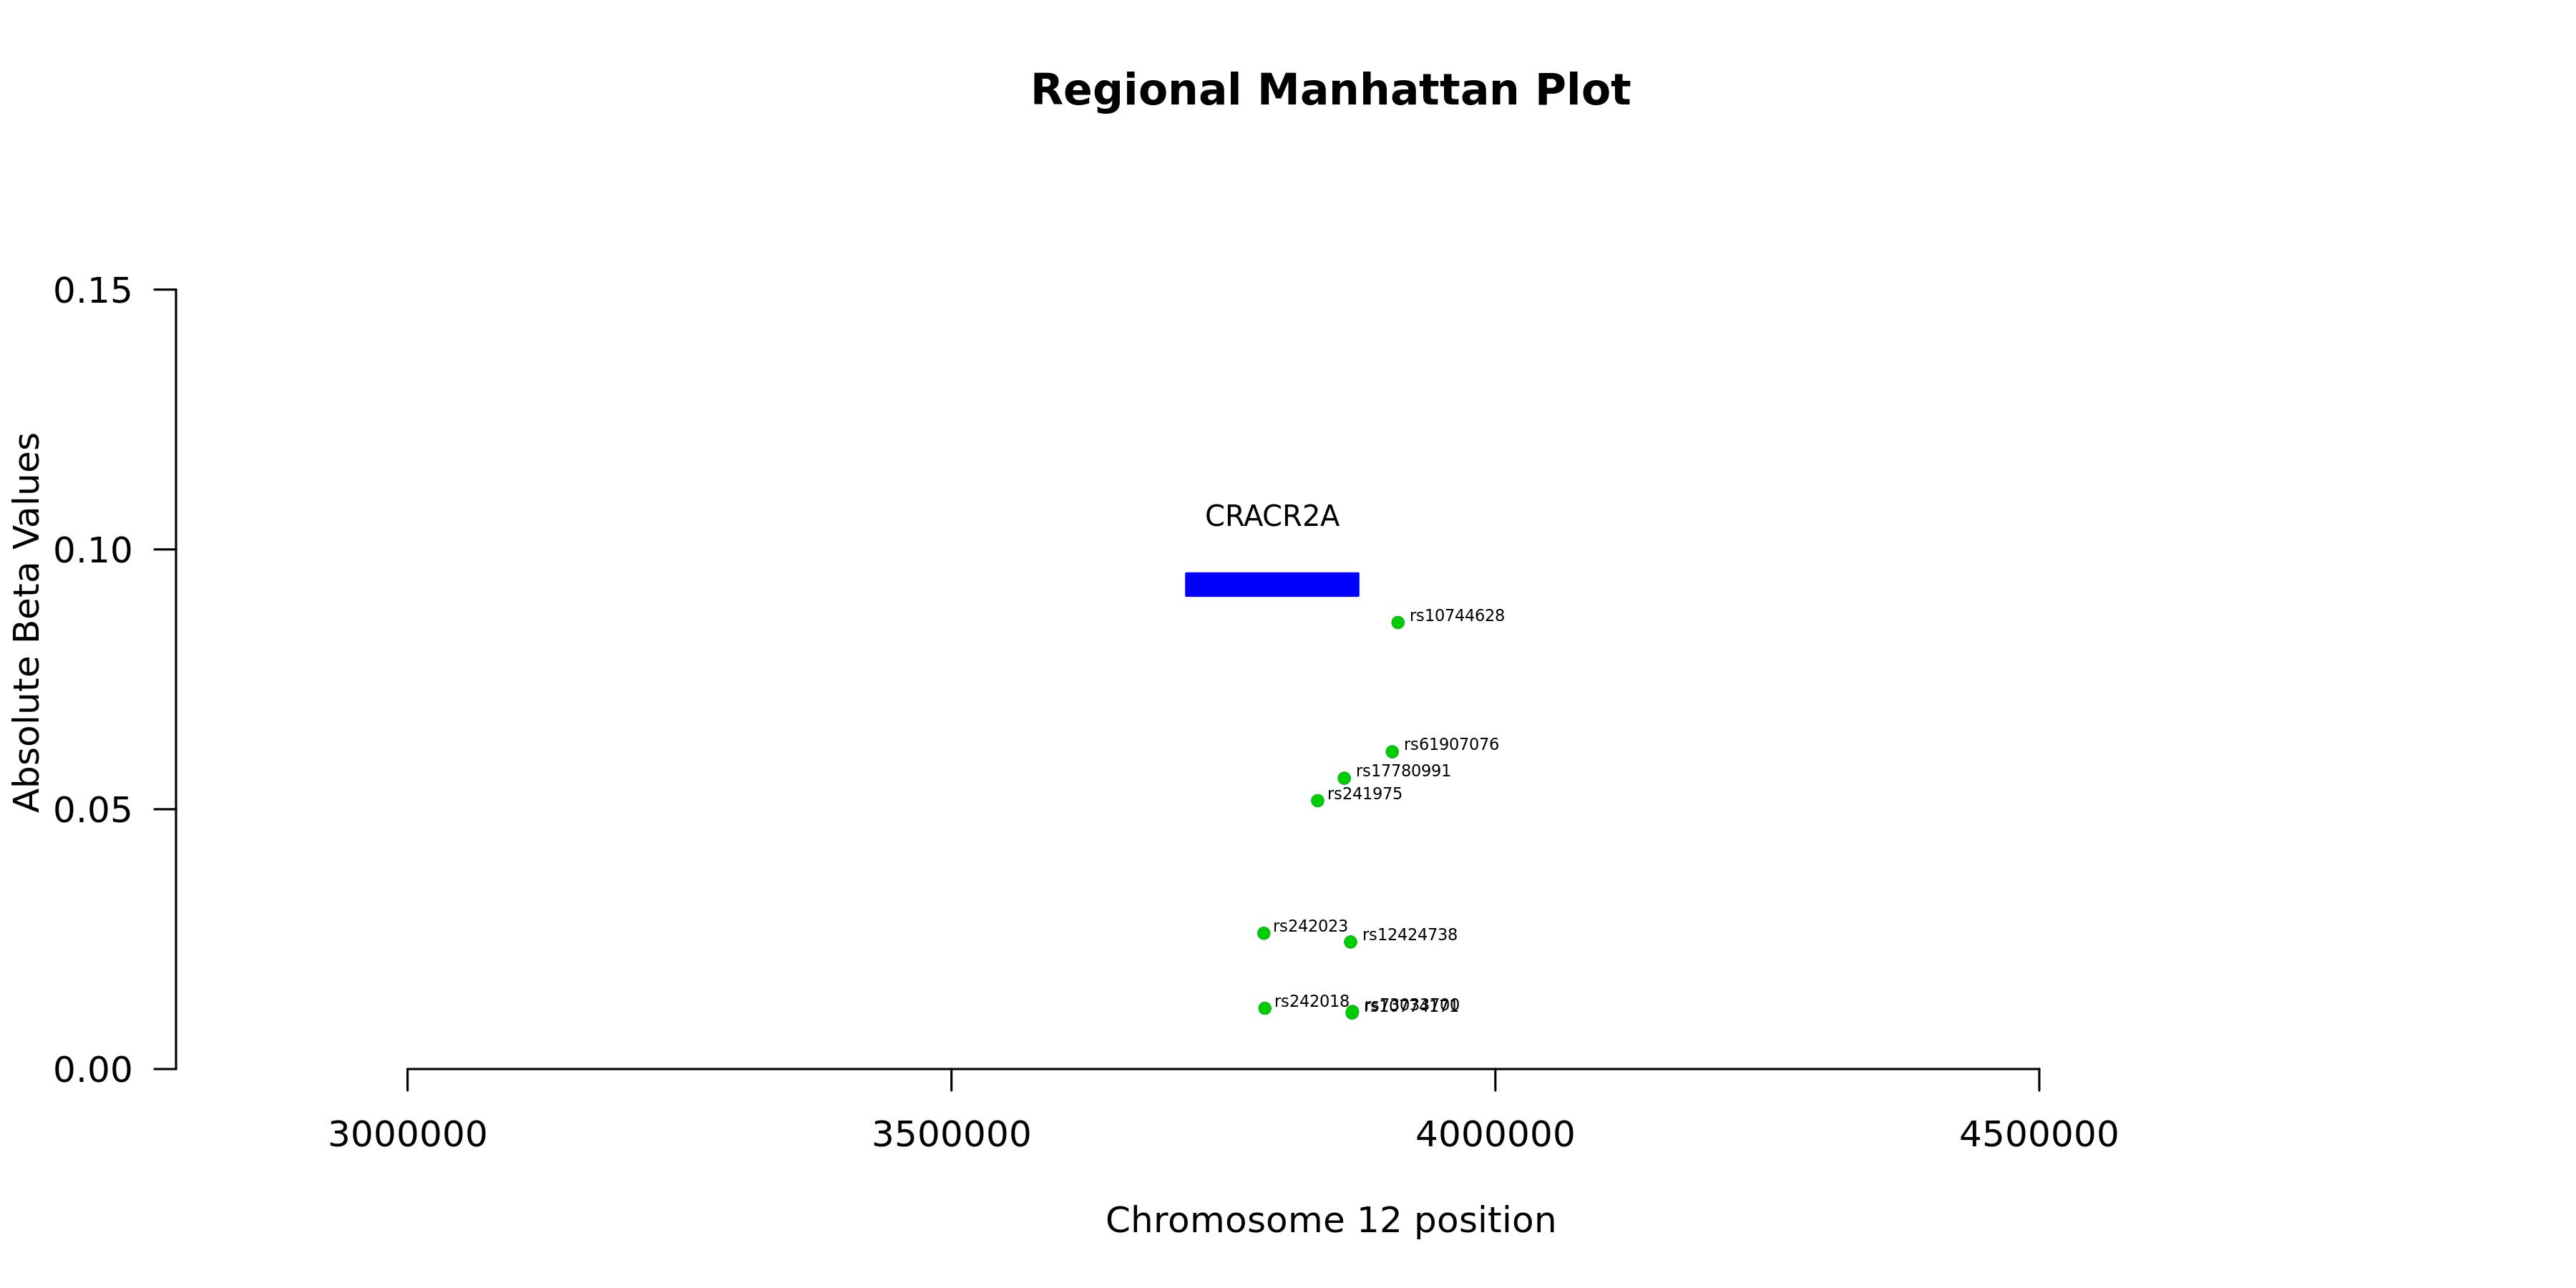
Regional Manhattan Plotenlarge ⤢
Model record
Field
Value
Gene
CRACR2A
test_n
10538
sparsity
59
pearson_coefficent
0.157374952987432
SE
0.00987390825347091
P_corr
1.69479660300808e-56
R2 Covariate Model
0.0011
R2 Full Model
0.026
P
2.26520861614605e-59
P_full
2.4734317267672e-168
n_cis_pqtl
11
max_cis_pqtl
rs10744628
rank_max_cis_pqtl
1
mean_pqtl_beta
0.0317688935565869
mean_nopqtl_beta
0.00955620346835872
percentage_pqtl
0.186440677966102
percentage_nopqtl
0.813559322033898
cis and genome-wide metrics
Field
Value
Gene
CRACR2A
test_n_genomewide
10538
sparsity_genomewide
59
pearson_coefficent_genomewide
0.157374952987432
SE_genomewide
0.00987390825347091
P_corr_genomewide
1.69479660300808e-56
R2_covariate_model_genomewide
0.00114098689305908
R2_full_model_genomewide
0.0260082446567246
P_genomewide
2.26520861614605e-59
P_full_genomewide
2.4734317267672e-168
n_cis_pqtl
11
max_cis_pqtl
rs10744628
rank_max_cis_pqtl
1
mean_pqtl_beta
0.0317688935565869
mean_nopqtl_beta
0.00955620346835872
percentage_pqtl
0.186440677966102
percentage_nopqtl
0.813559322033898
test_n_cis
10538
sparsity_cis
11
pearson_coefficent_cis
0.125742580045478
SE_cis
0.00991914127065879
P_corr_cis
1.51858264802935e-36
R2_covariate_model_cis
0.00114098689305908
R2_full_model_cis
0.0175481740641874
P_cis
1.64365850269569e-40
P_full_cis
6.83625668541436e-108