CPLX2
Olink Explore plasma protein · SNPBoost PRS model
R2 Full Model
9.00e-4
pearson_coefficent
0.0117
sparsity
1
n_cis_pqtl
0
max_cis_pqtl
—
Diagnostics
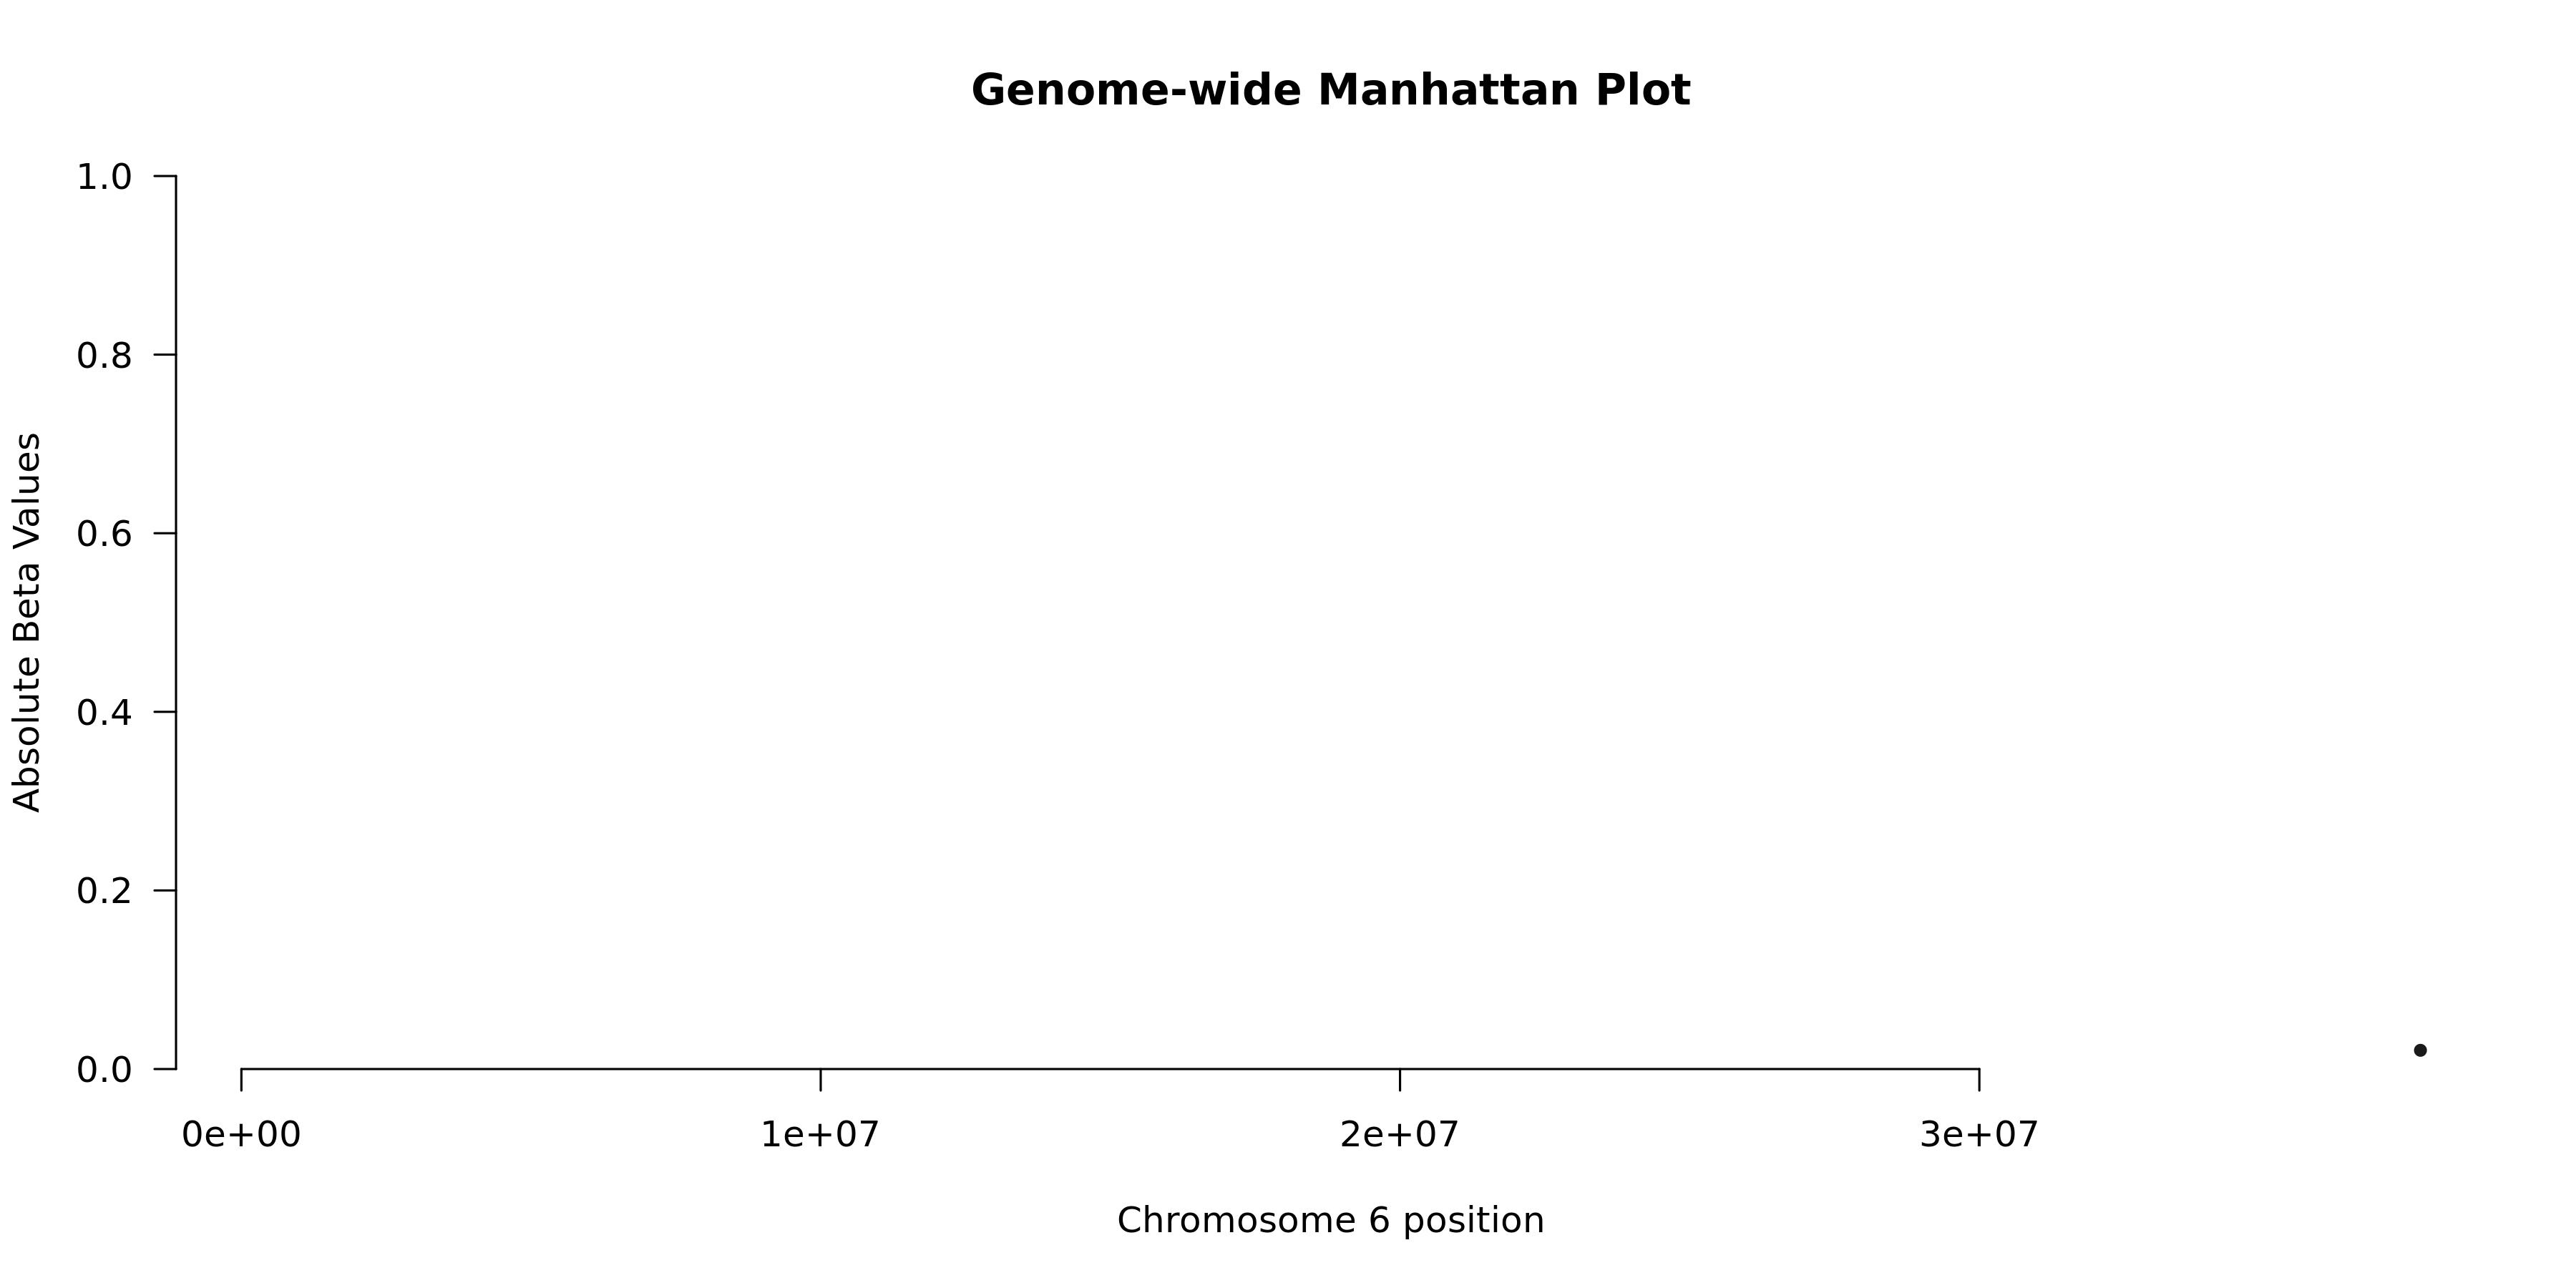
Genome-wide Manhattan Plotenlarge ⤢
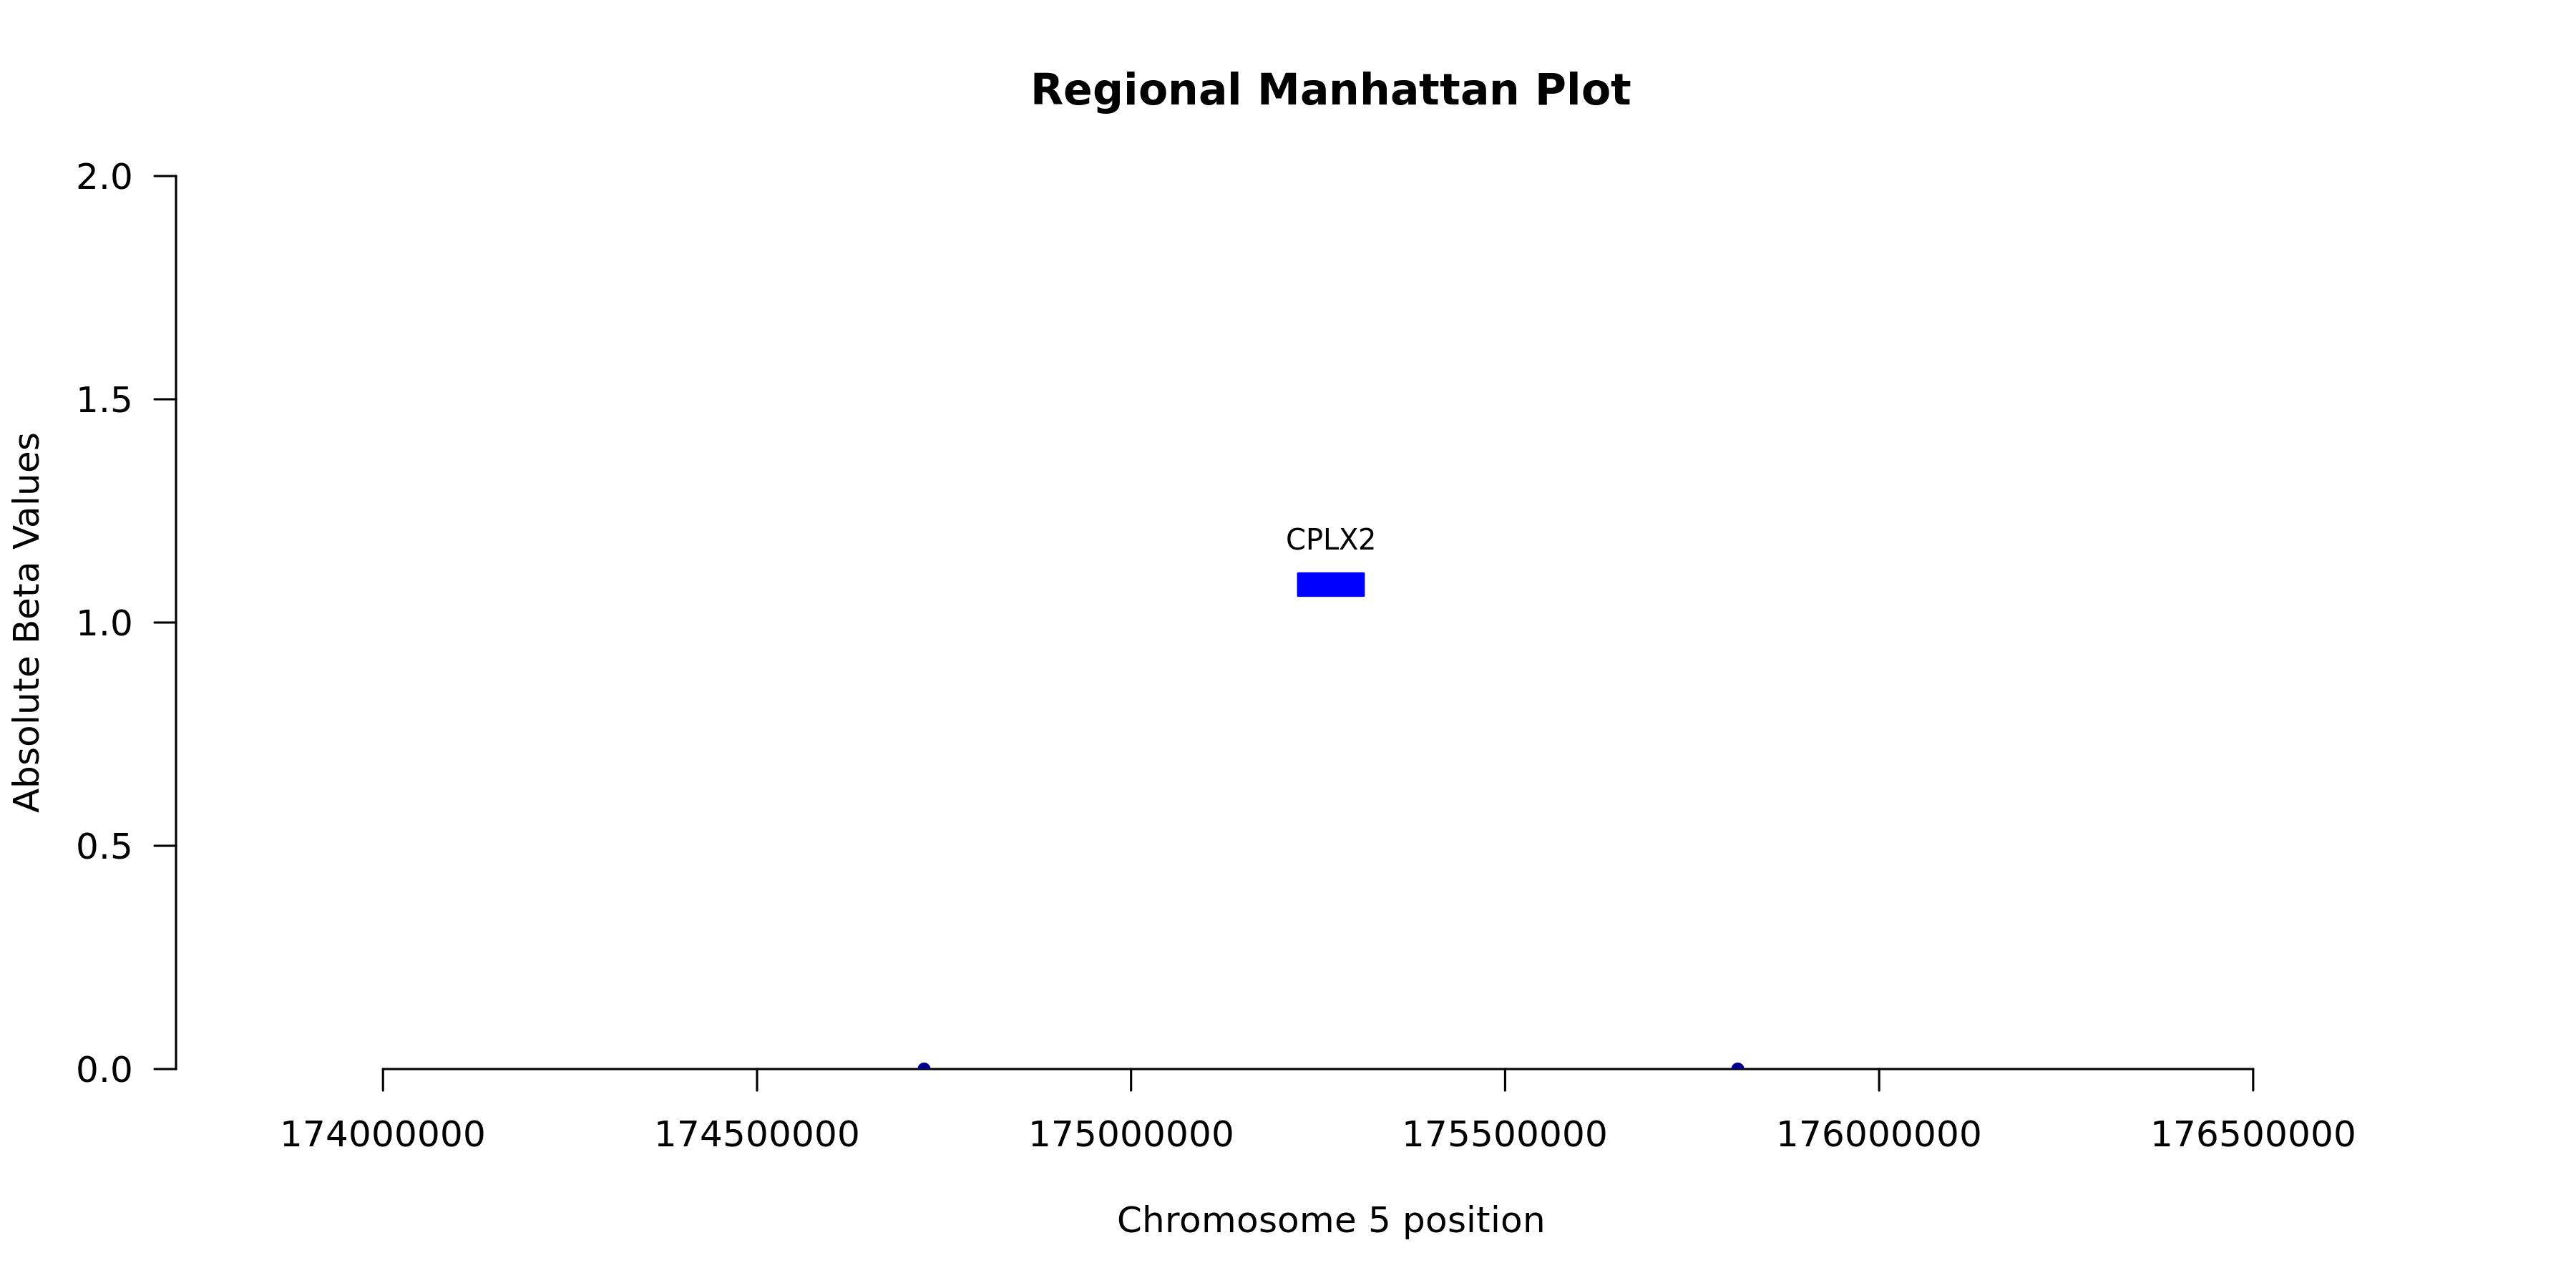
Regional Manhattan Plotenlarge ⤢
Model record
Field
Value
Gene
CPLX2
test_n
10538
sparsity
1
pearson_coefficent
0.0117478926245778
SE
0.0109375196278162
P_corr
0.282812855101182
R2 Covariate Model
0.0012
R2 Full Model
9e-04
P
0.00275884463412647
P_full
2.46915586439839e-08
n_cis_pqtl
0
max_cis_pqtl
—
rank_max_cis_pqtl
—
mean_pqtl_beta
—
mean_nopqtl_beta
0.0209769444152799
percentage_pqtl
0
percentage_nopqtl
1
cis and genome-wide metrics
Field
Value
Gene
CPLX2
test_n_genomewide
10538
sparsity_genomewide
1
pearson_coefficent_genomewide
0.0117478926245778
SE_genomewide
0.0109375196278162
P_corr_genomewide
0.282812855101182
R2_covariate_model_genomewide
0.00115937619077711
R2_full_model_genomewide
0.000949949775881809
P_genomewide
0.00275884463412647
P_full_genomewide
2.46915586439839e-08
n_cis_pqtl
0
max_cis_pqtl
NA
rank_max_cis_pqtl
NA
mean_pqtl_beta
NA
mean_nopqtl_beta
0.0209769444152799
percentage_pqtl
0
percentage_nopqtl
1
test_n_cis
NA
sparsity_cis
NA
pearson_coefficent_cis
NA
SE_cis
NA
P_corr_cis
NA
R2_covariate_model_cis
NA
R2_full_model_cis
NA
P_cis
NA
P_full_cis
NA