CD14
Olink Explore plasma protein · SNPBoost PRS model
R2 Full Model
0.1543
pearson_coefficent
0.3303
sparsity
612
n_cis_pqtl
20
max_cis_pqtl
rs147288996
Diagnostics
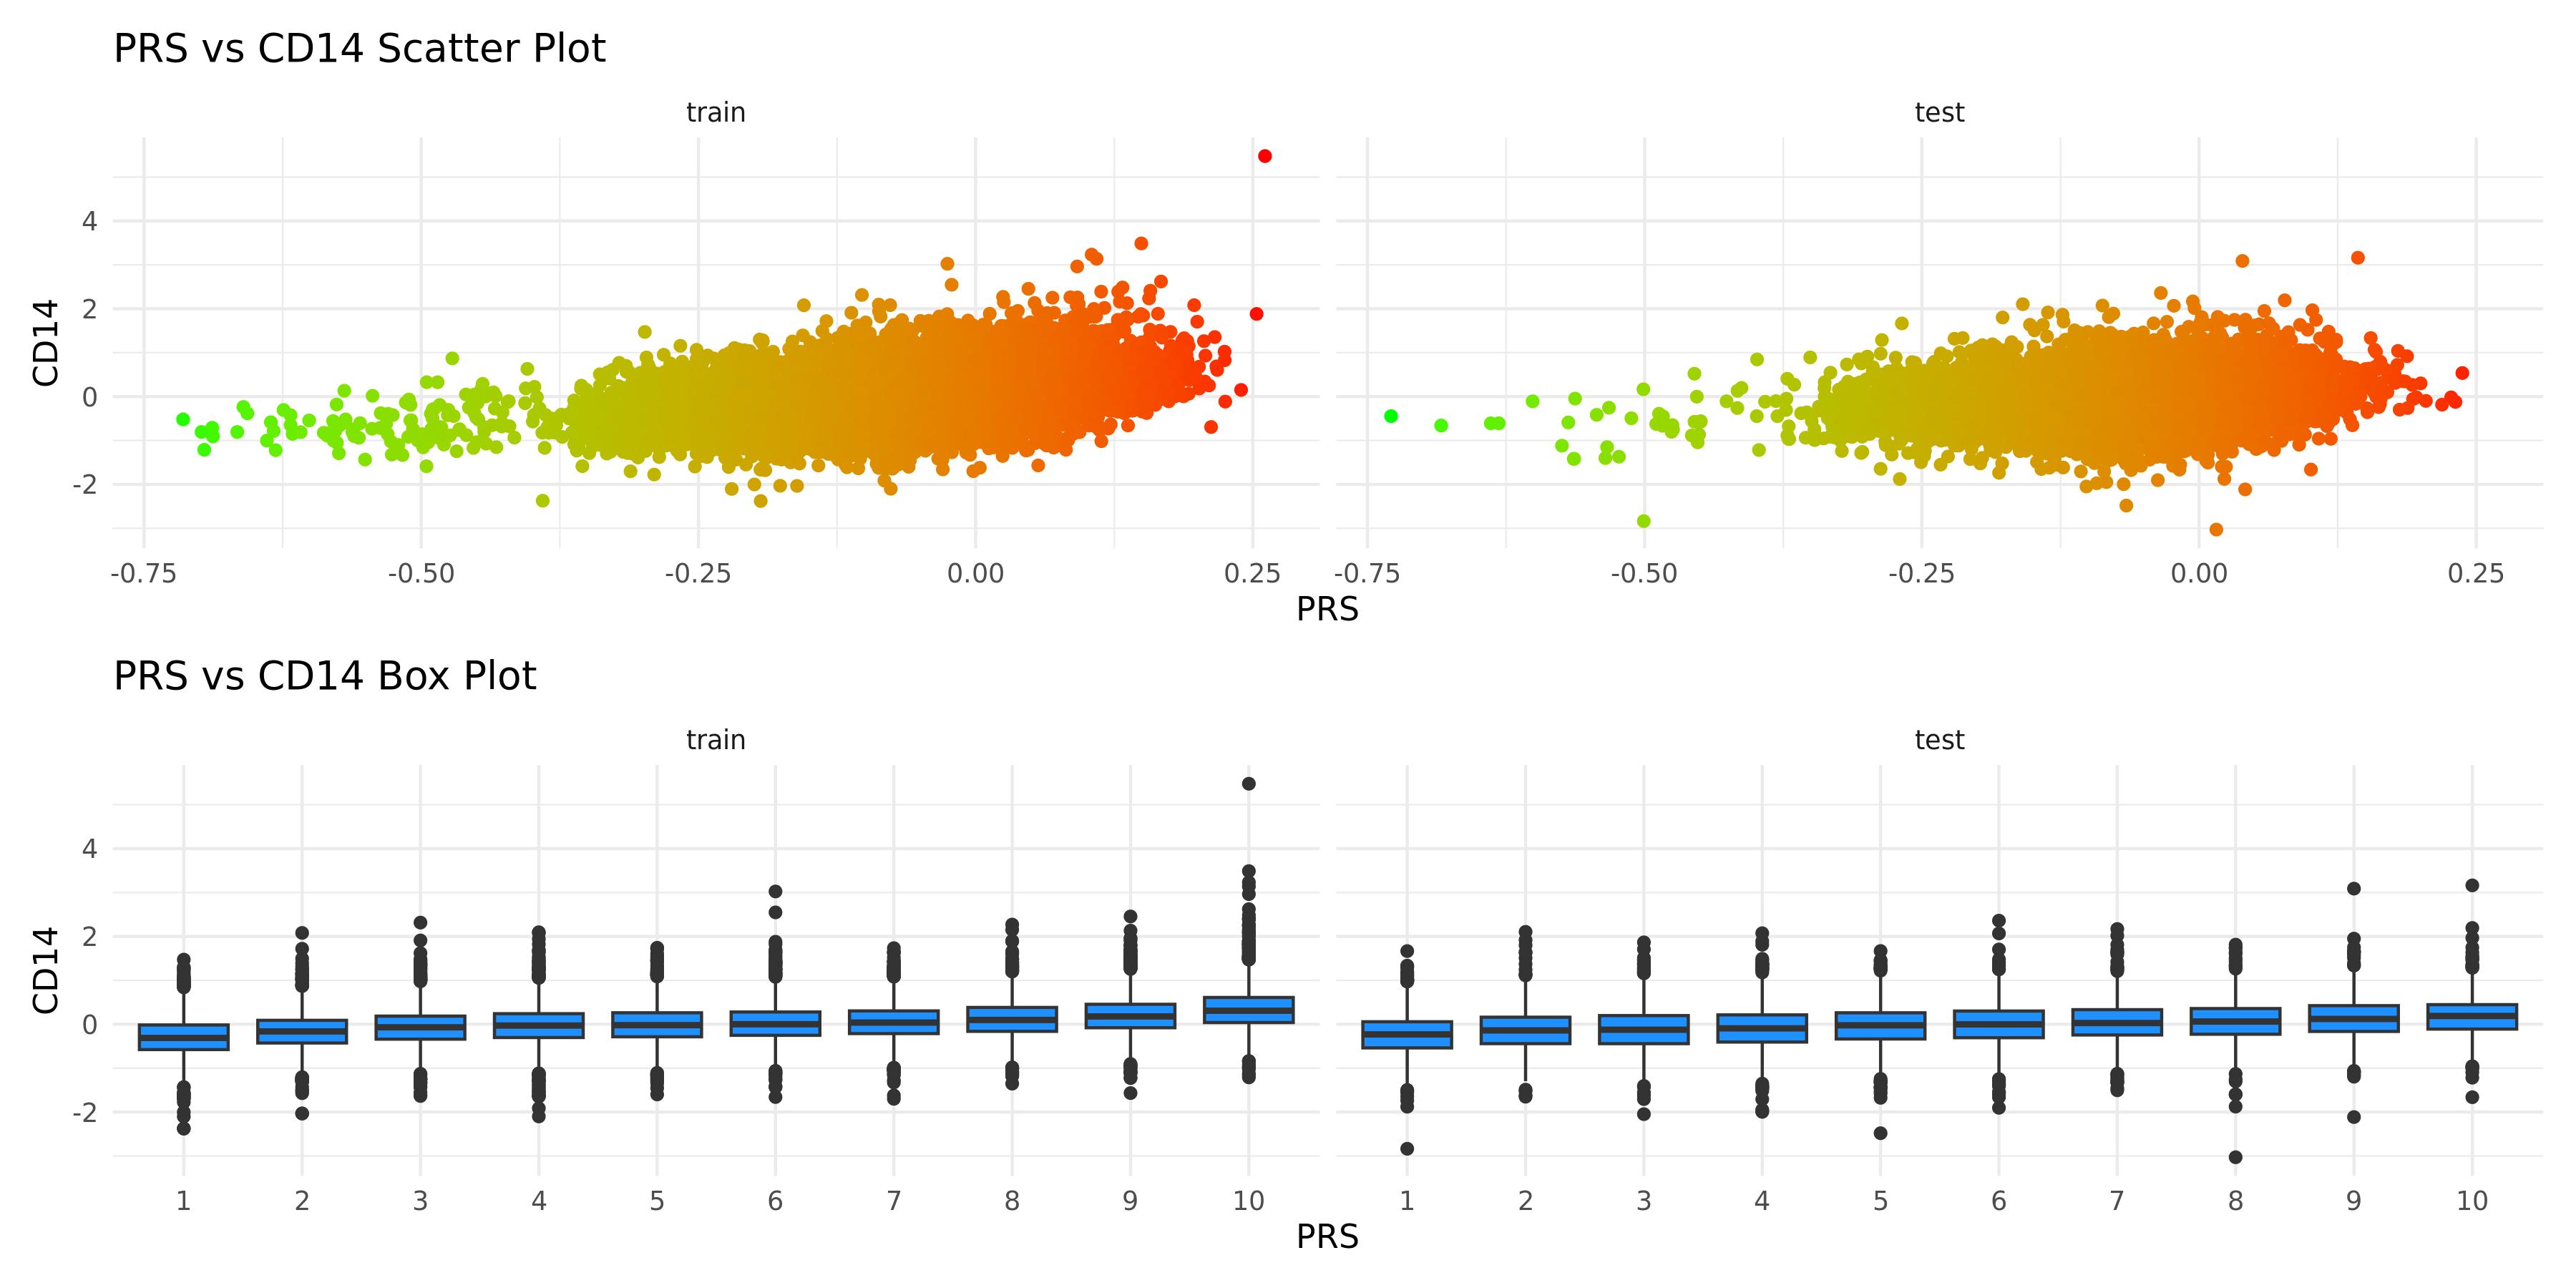
PRS scatter and box plotsenlarge ⤢
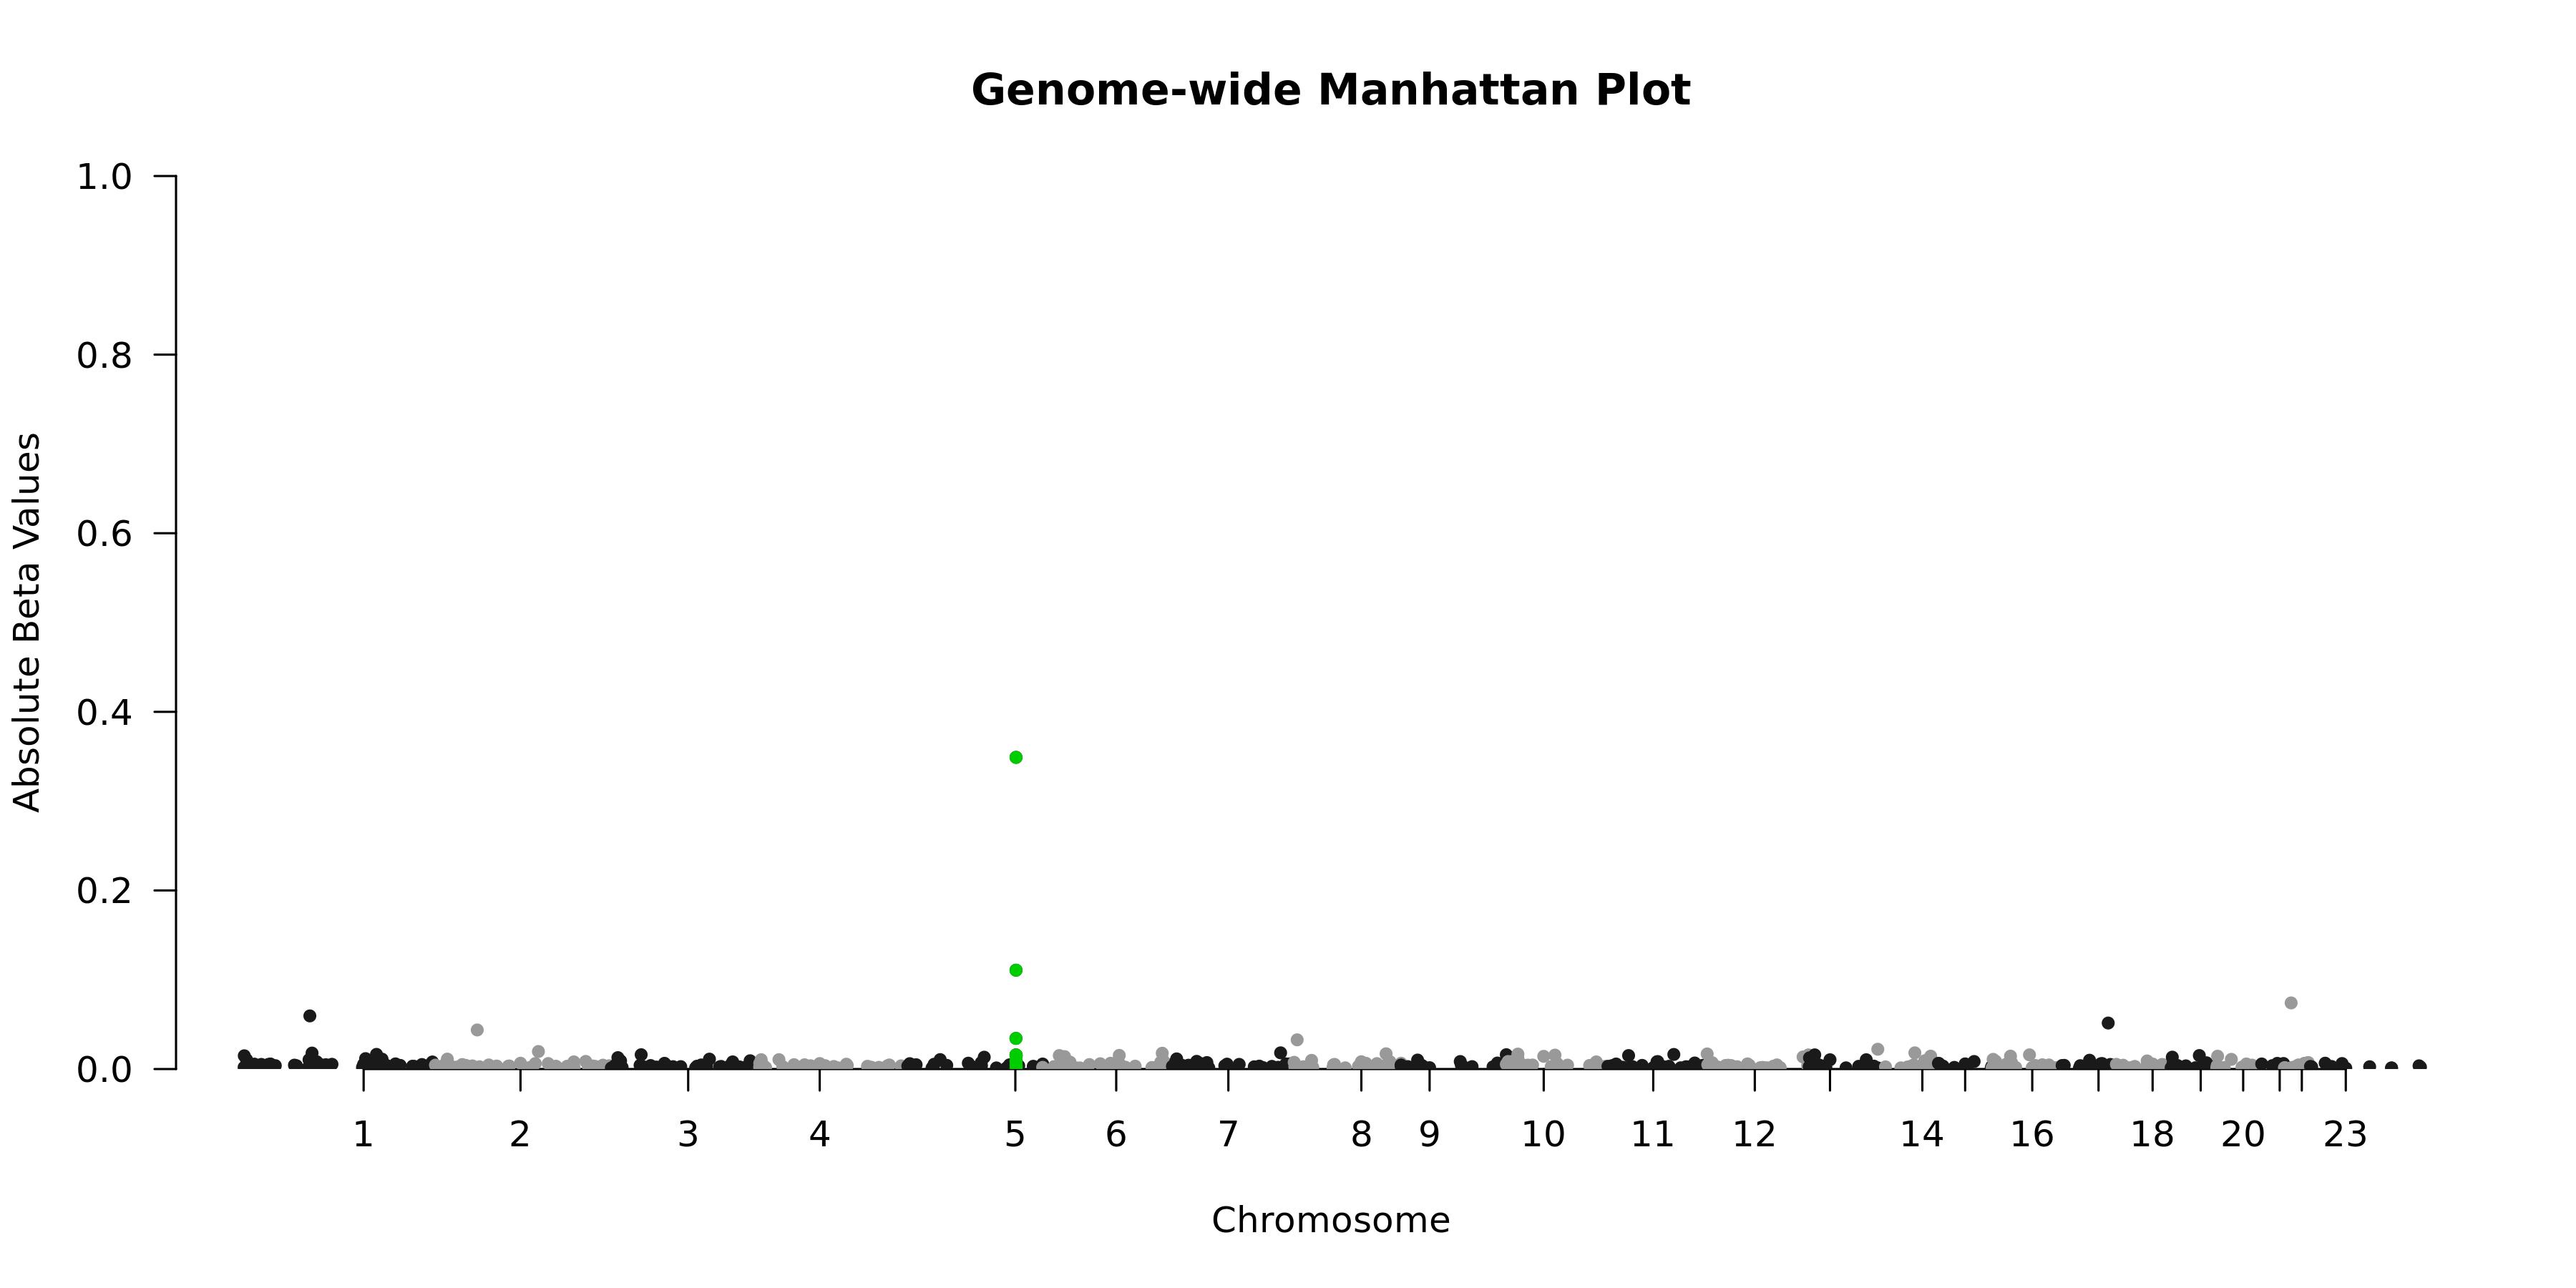
Genome-wide Manhattan Plotenlarge ⤢
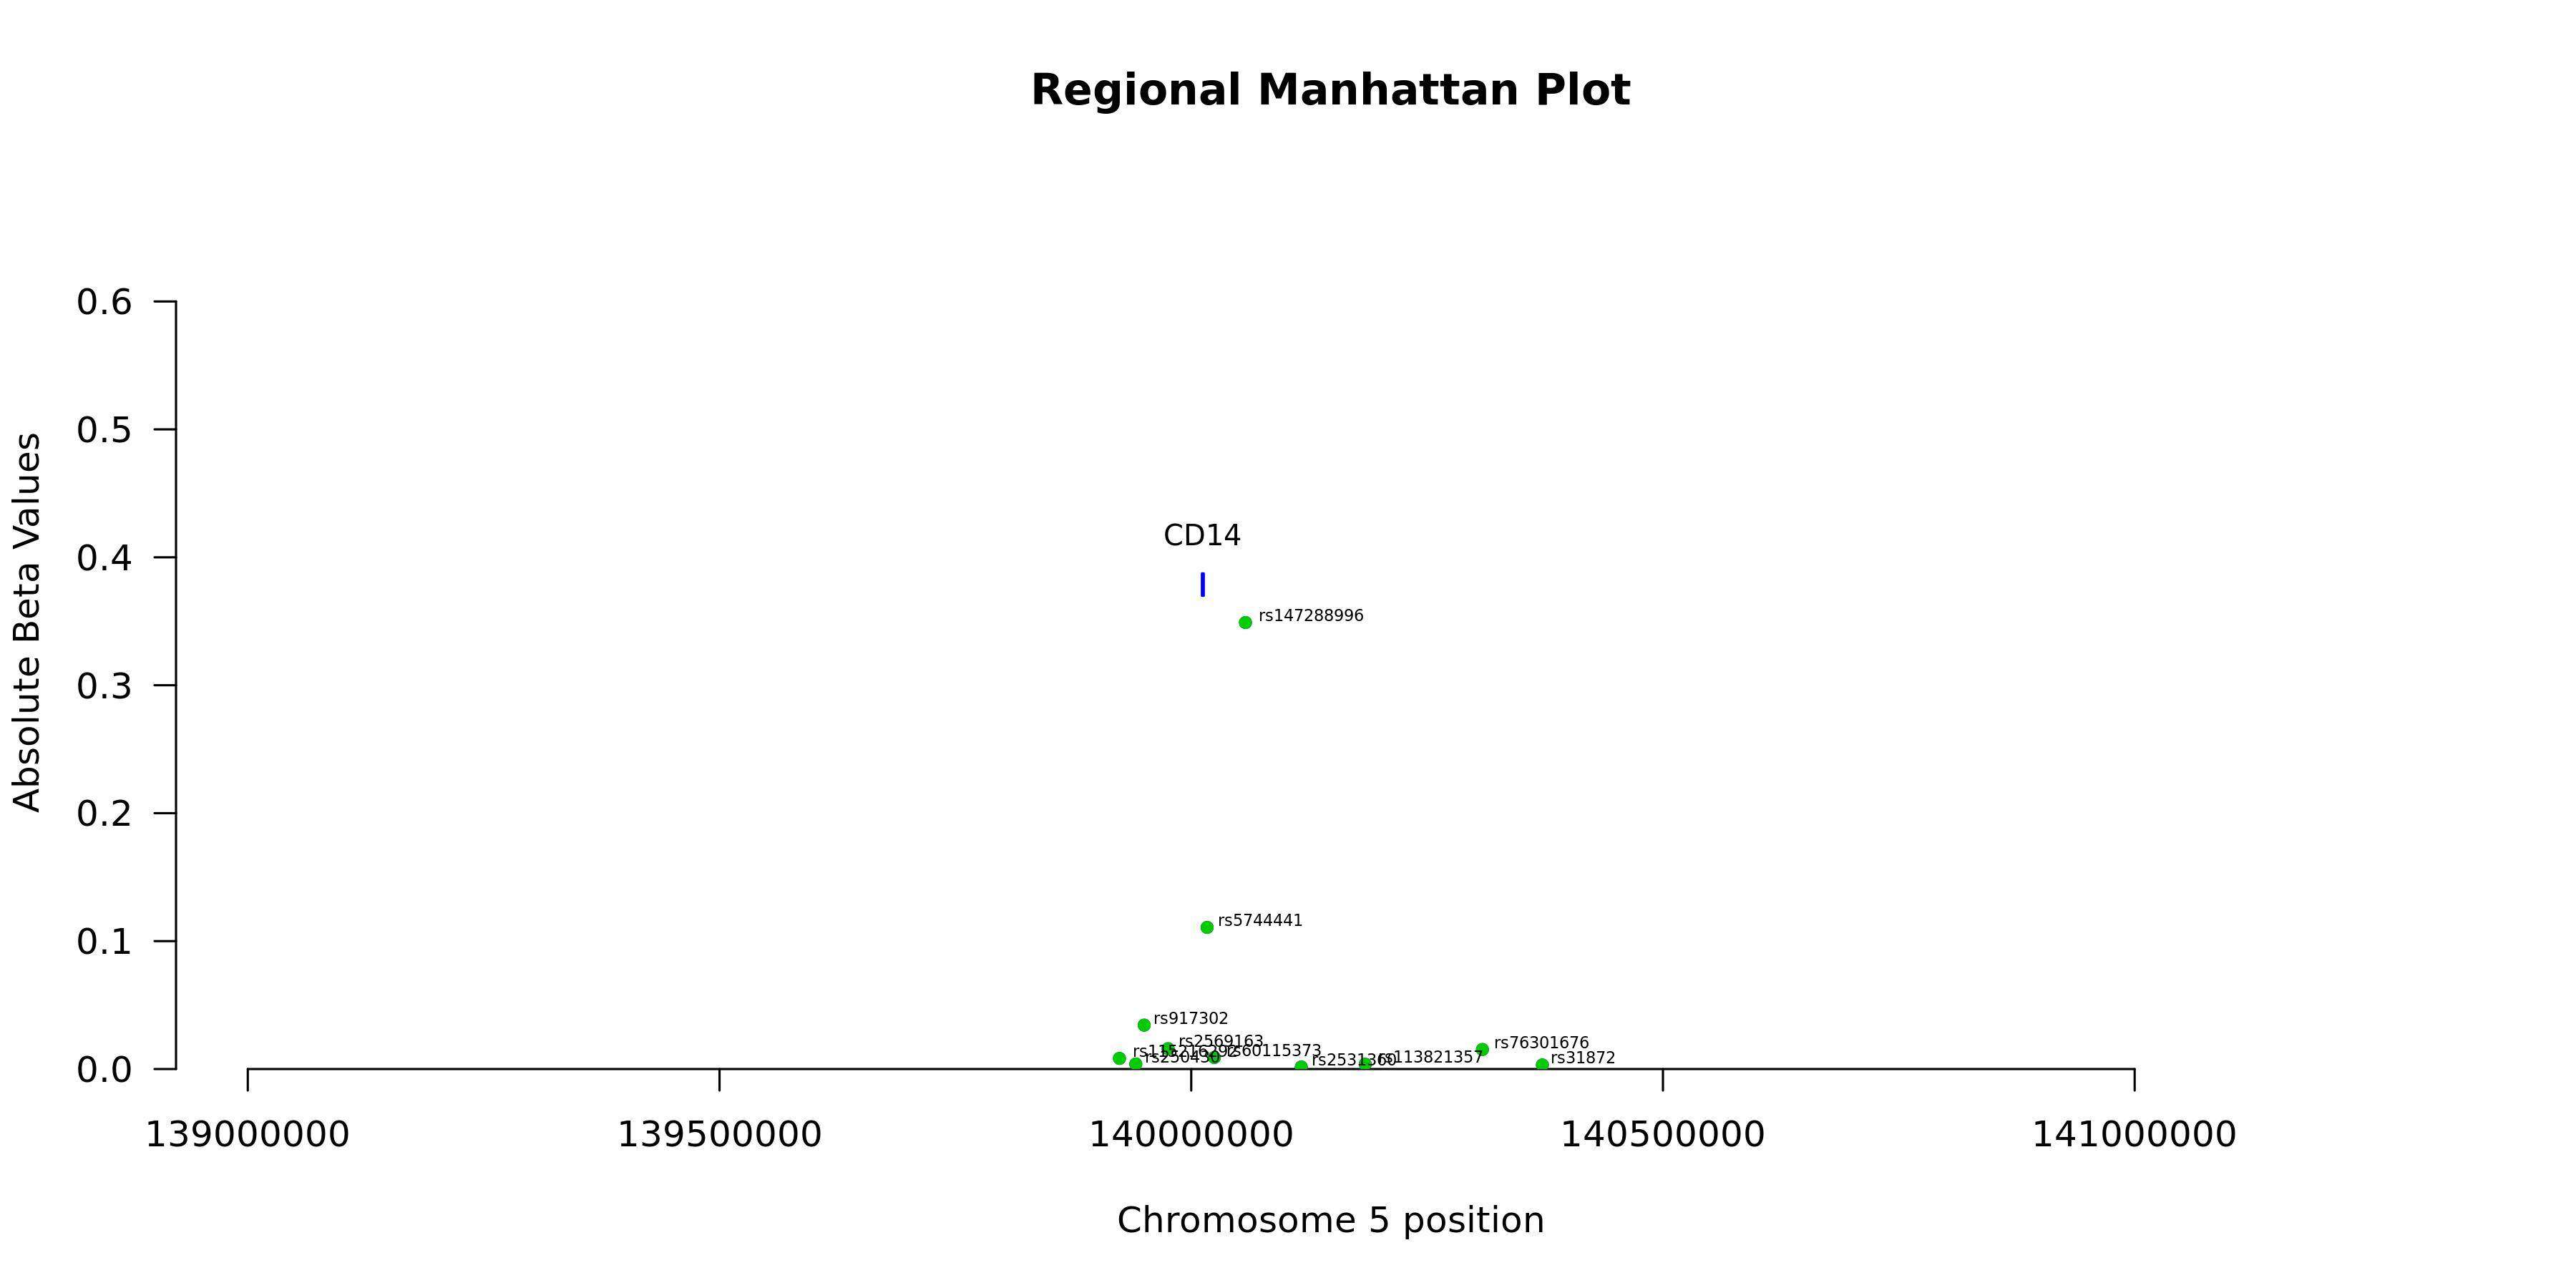
Regional Manhattan Plotenlarge ⤢
Model record
Field
Value
Gene
CD14
test_n
10538
sparsity
612
pearson_coefficent
0.330325866181399
SE
0.00942266457785756
P_corr
4.33175096091019e-254
R2 Covariate Model
0.0521
R2 Full Model
0.1543
P
0
P_full
0
n_cis_pqtl
20
max_cis_pqtl
rs147288996
rank_max_cis_pqtl
1
mean_pqtl_beta
0.0292083448416541
mean_nopqtl_beta
0.00471559919354315
percentage_pqtl
0.0326797385620915
percentage_nopqtl
0.967320261437908
cis and genome-wide metrics
Field
Value
Gene
CD14
test_n_genomewide
10538
sparsity_genomewide
612
pearson_coefficent_genomewide
0.330325866181399
SE_genomewide
0.00942266457785756
P_corr_genomewide
4.33175096091019e-254
R2_covariate_model_genomewide
0.0520614622424689
R2_full_model_genomewide
0.15432024105813
P_genomewide
0
P_full_genomewide
0
n_cis_pqtl
20
max_cis_pqtl
rs147288996
rank_max_cis_pqtl
1
mean_pqtl_beta
0.0292083448416541
mean_nopqtl_beta
0.00471559919354315
percentage_pqtl
0.0326797385620915
percentage_nopqtl
0.967320261437908
test_n_cis
10538
sparsity_cis
20
pearson_coefficent_cis
0.205266918734491
SE_cis
0.00977046459900915
P_corr_cis
6.20455292082898e-96
R2_covariate_model_cis
0.052061462242469
R2_full_model_cis
0.0963800311876183
P_cis
1.26931734143368e-223
P_full_cis
2.56696905990443e-307