APP
Olink Explore plasma protein · SNPBoost PRS model
R2 Full Model
0.1554
pearson_coefficent
0.3862
sparsity
999
n_cis_pqtl
20
max_cis_pqtl
rs2000989
Diagnostics
PRS scatter and box plotsenlarge ⤢

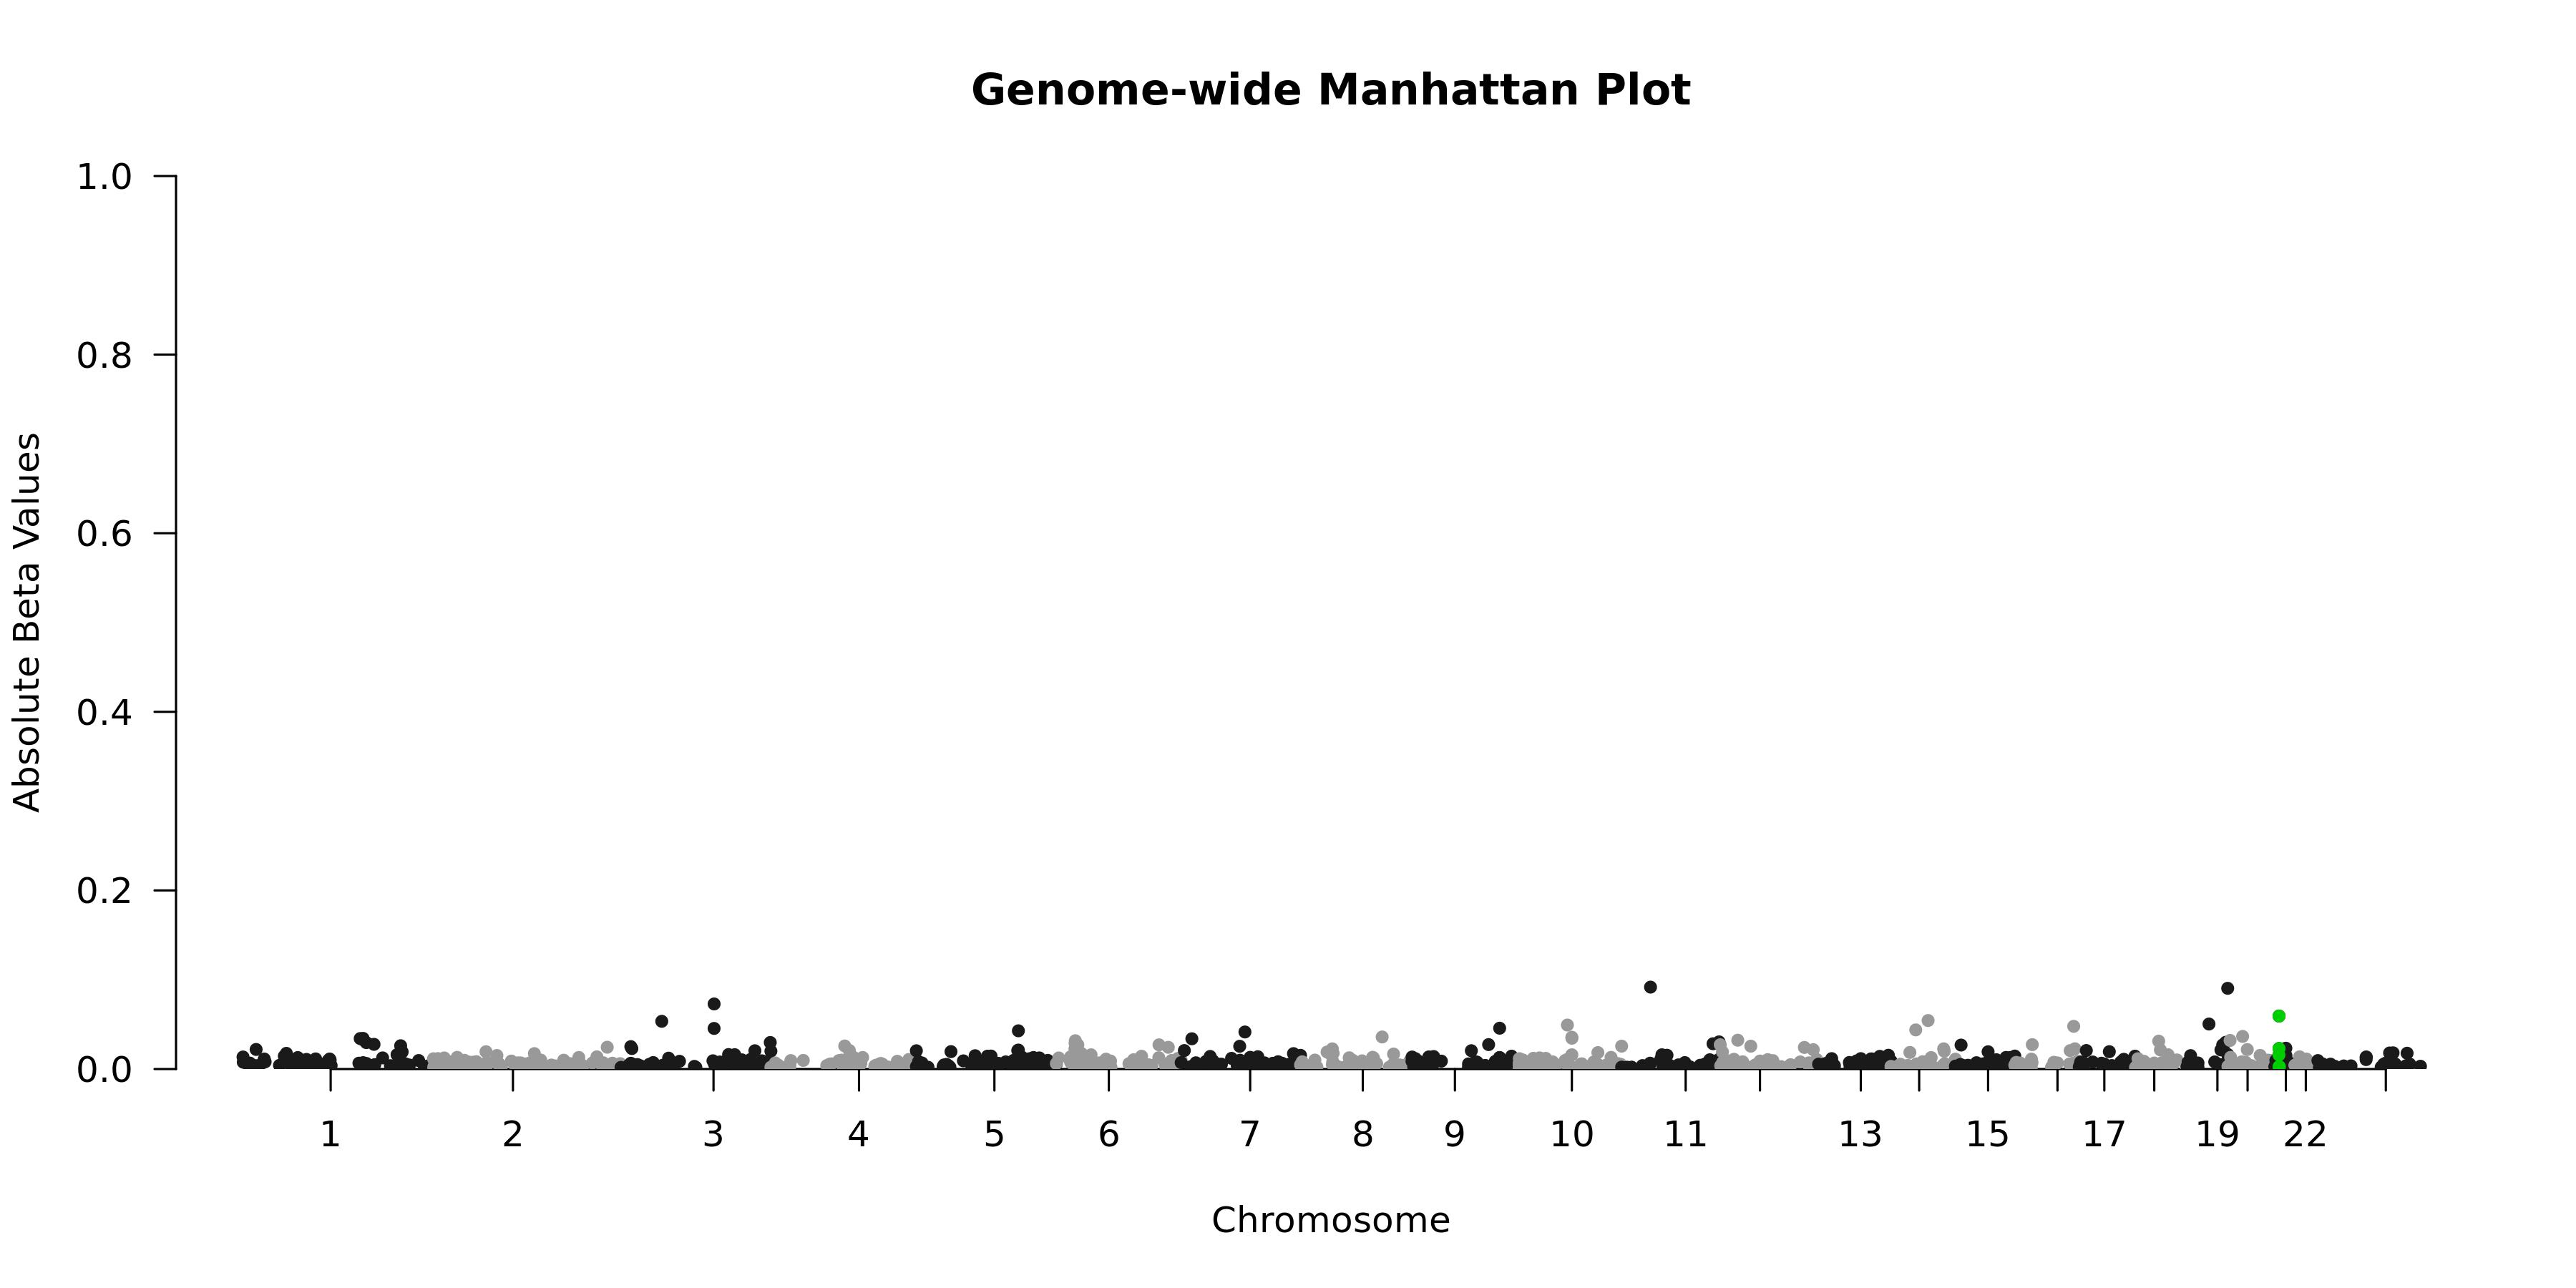
Genome-wide Manhattan Plotenlarge ⤢
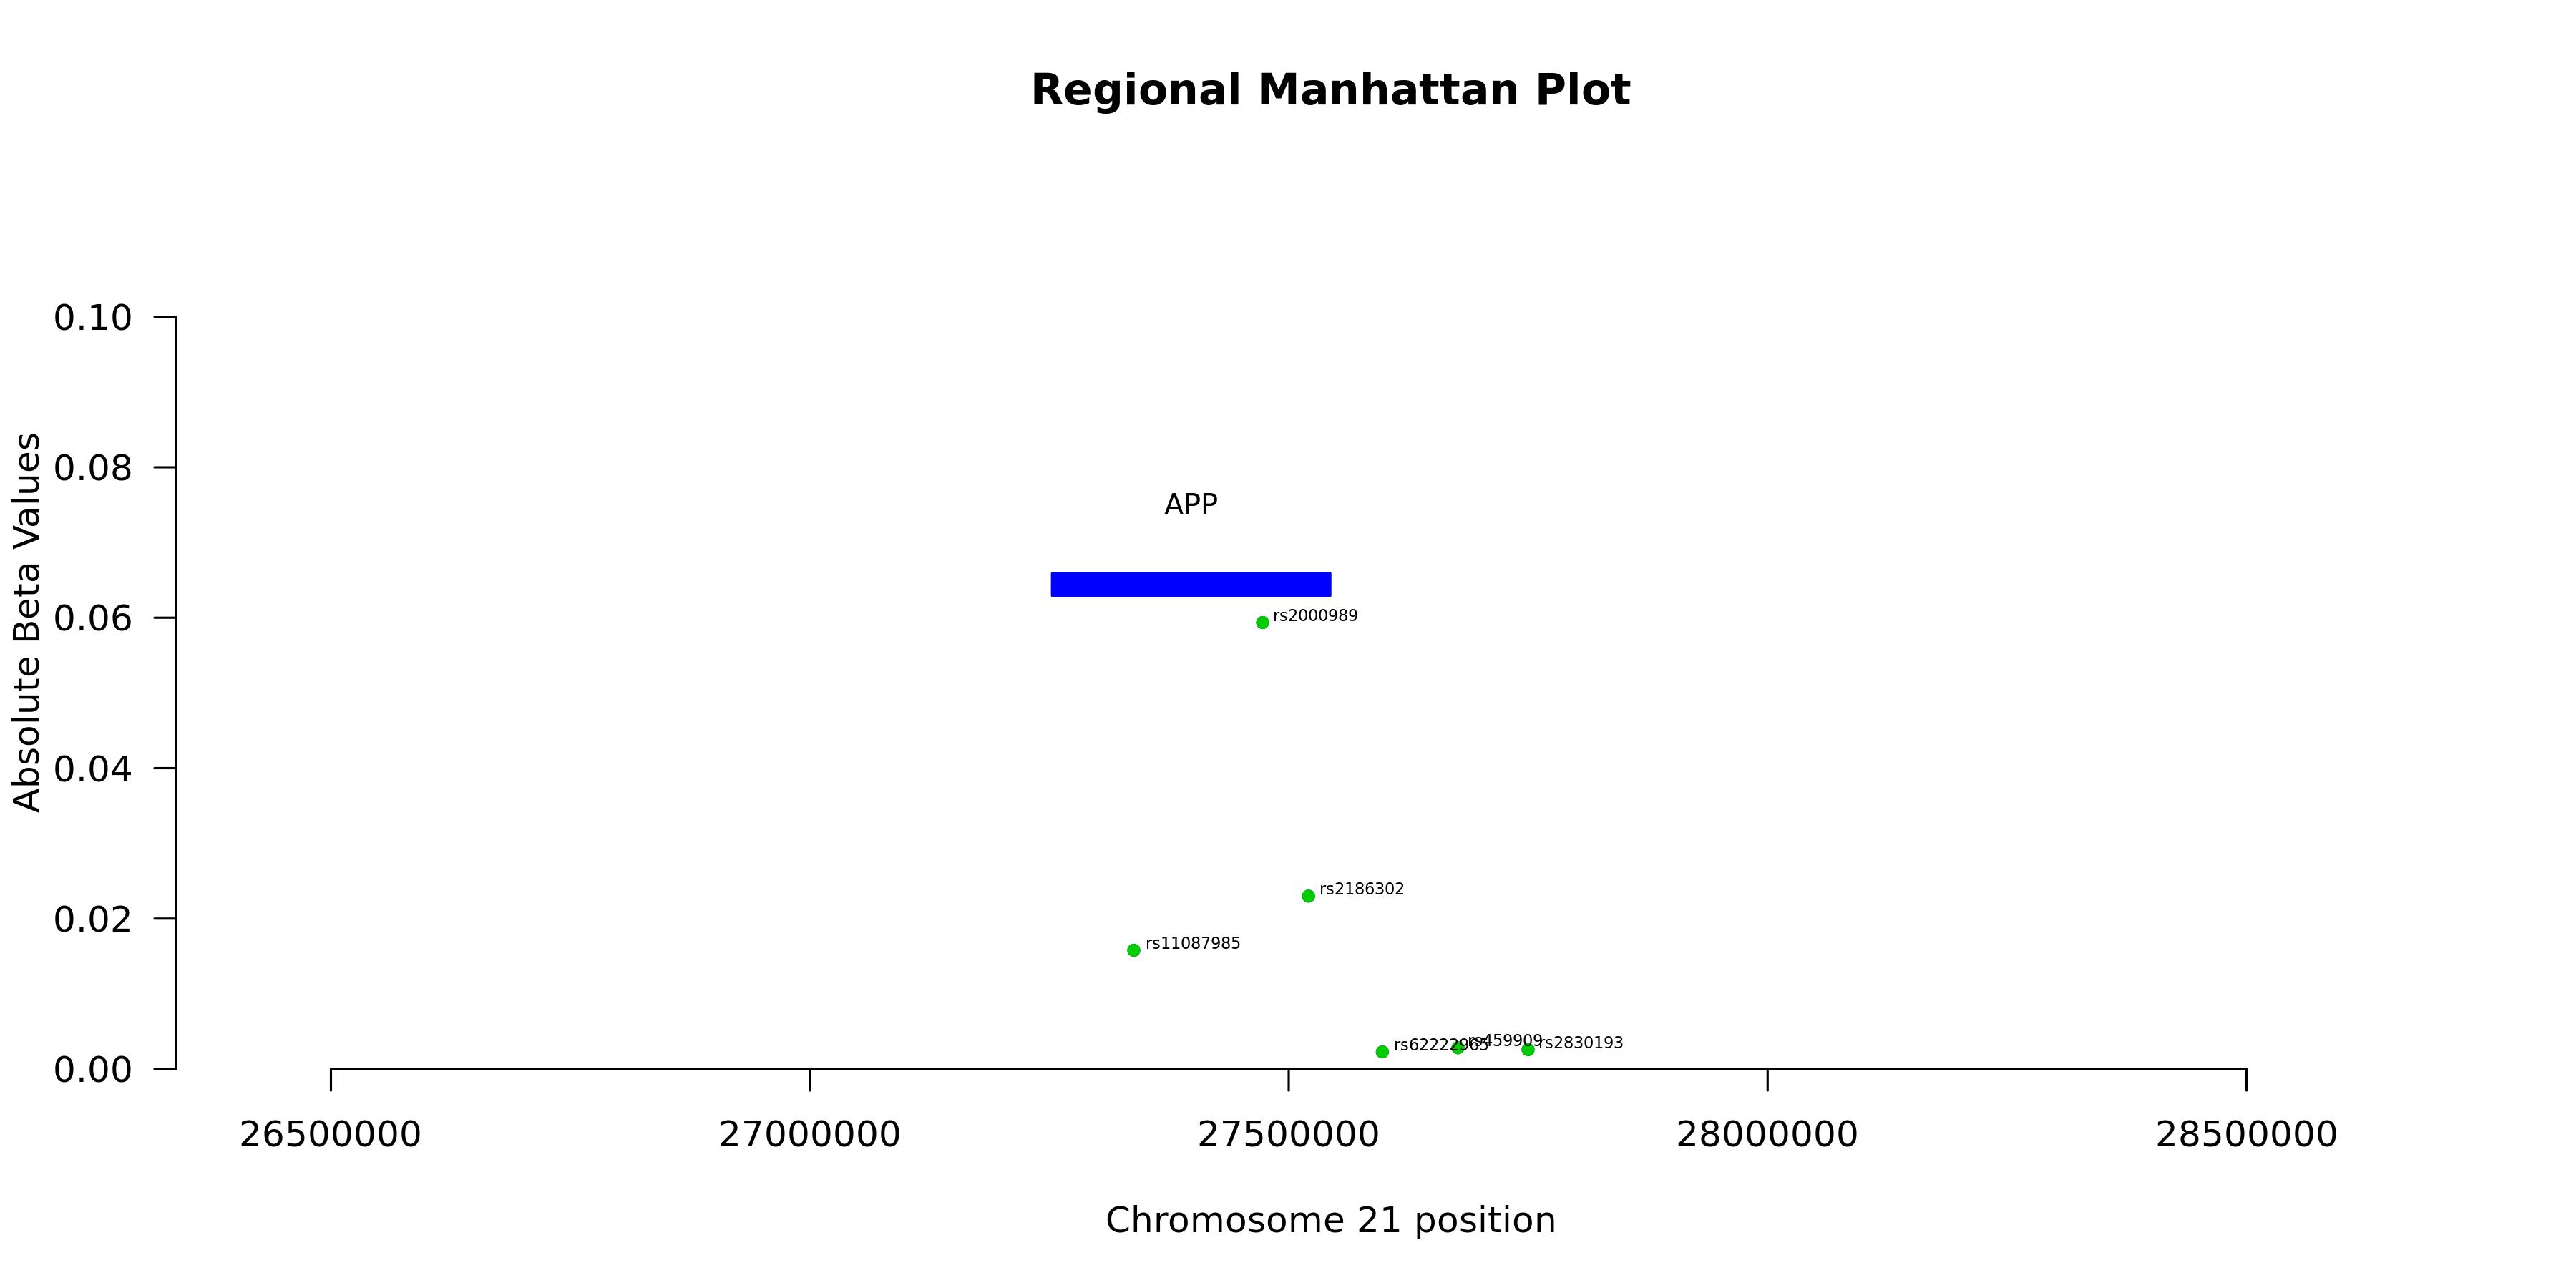
Regional Manhattan Plotenlarge ⤢
Model record
Field
Value
Gene
APP
test_n
10538
sparsity
999
pearson_coefficent
0.386164108013441
SE
0.00911645308800846
P_corr
0
R2 Covariate Model
0.0066
R2 Full Model
0.1554
P
0
P_full
0
n_cis_pqtl
20
max_cis_pqtl
rs2000989
rank_max_cis_pqtl
4
mean_pqtl_beta
0.00978403469775939
mean_nopqtl_beta
0.00773779886948564
percentage_pqtl
0.02002002002002
percentage_nopqtl
0.97997997997998
cis and genome-wide metrics
Field
Value
Gene
APP
test_n_genomewide
10538
sparsity_genomewide
999
pearson_coefficent_genomewide
0.386164108013441
SE_genomewide
0.00911645308800846
P_corr_genomewide
0
R2_covariate_model_genomewide
0.00659967633847303
R2_full_model_genomewide
0.15536234908998
P_genomewide
0
P_full_genomewide
0
n_cis_pqtl
20
max_cis_pqtl
rs2000989
rank_max_cis_pqtl
4
mean_pqtl_beta
0.00978403469775939
mean_nopqtl_beta
0.00773779886948564
percentage_pqtl
0.02002002002002
percentage_nopqtl
0.97997997997998
test_n_cis
10538
sparsity_cis
20
pearson_coefficent_cis
0.0763316840613576
SE_cis
0.00985424879834081
P_corr_cis
1.0375636425006e-14
R2_covariate_model_cis
0.00659967633847314
R2_full_model_cis
0.0135068600733208
P_cis
3.93855824185016e-35
P_full_cis
1.03376026523422e-41