AGRN
Olink Explore plasma protein · SNPBoost PRS model
R2 Full Model
0.1756
pearson_coefficent
0.3588
sparsity
648
n_cis_pqtl
73
max_cis_pqtl
rs142620337
Diagnostics
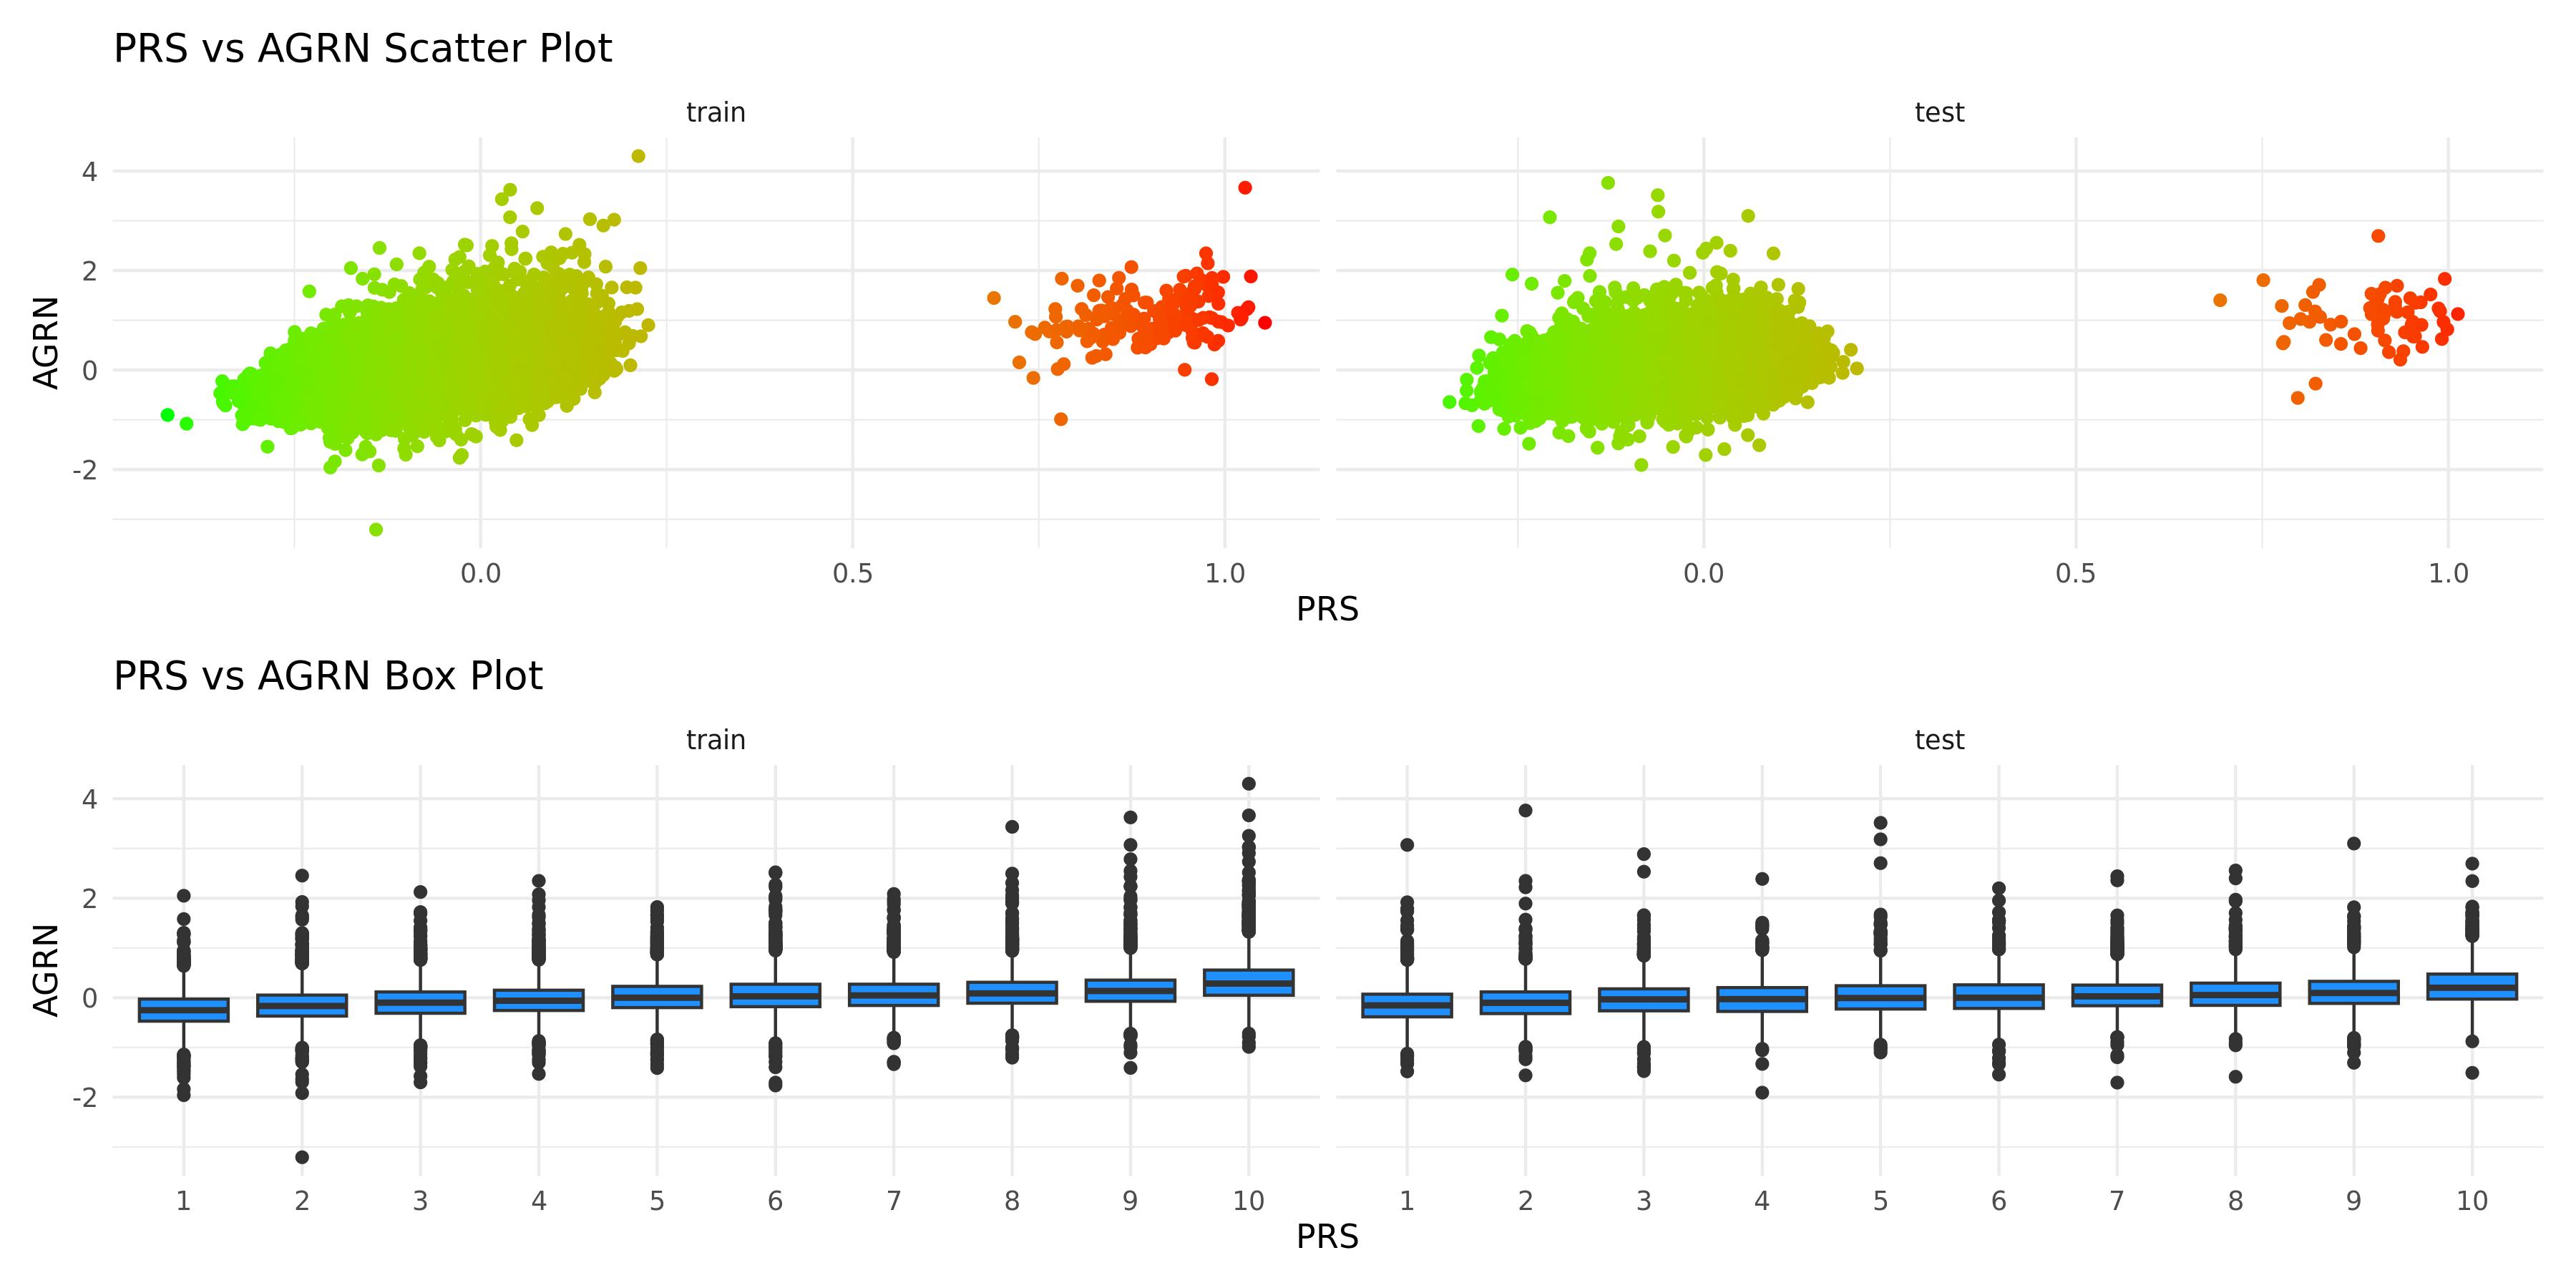
PRS scatter and box plotsenlarge ⤢
Genome-wide Manhattan Plotenlarge ⤢

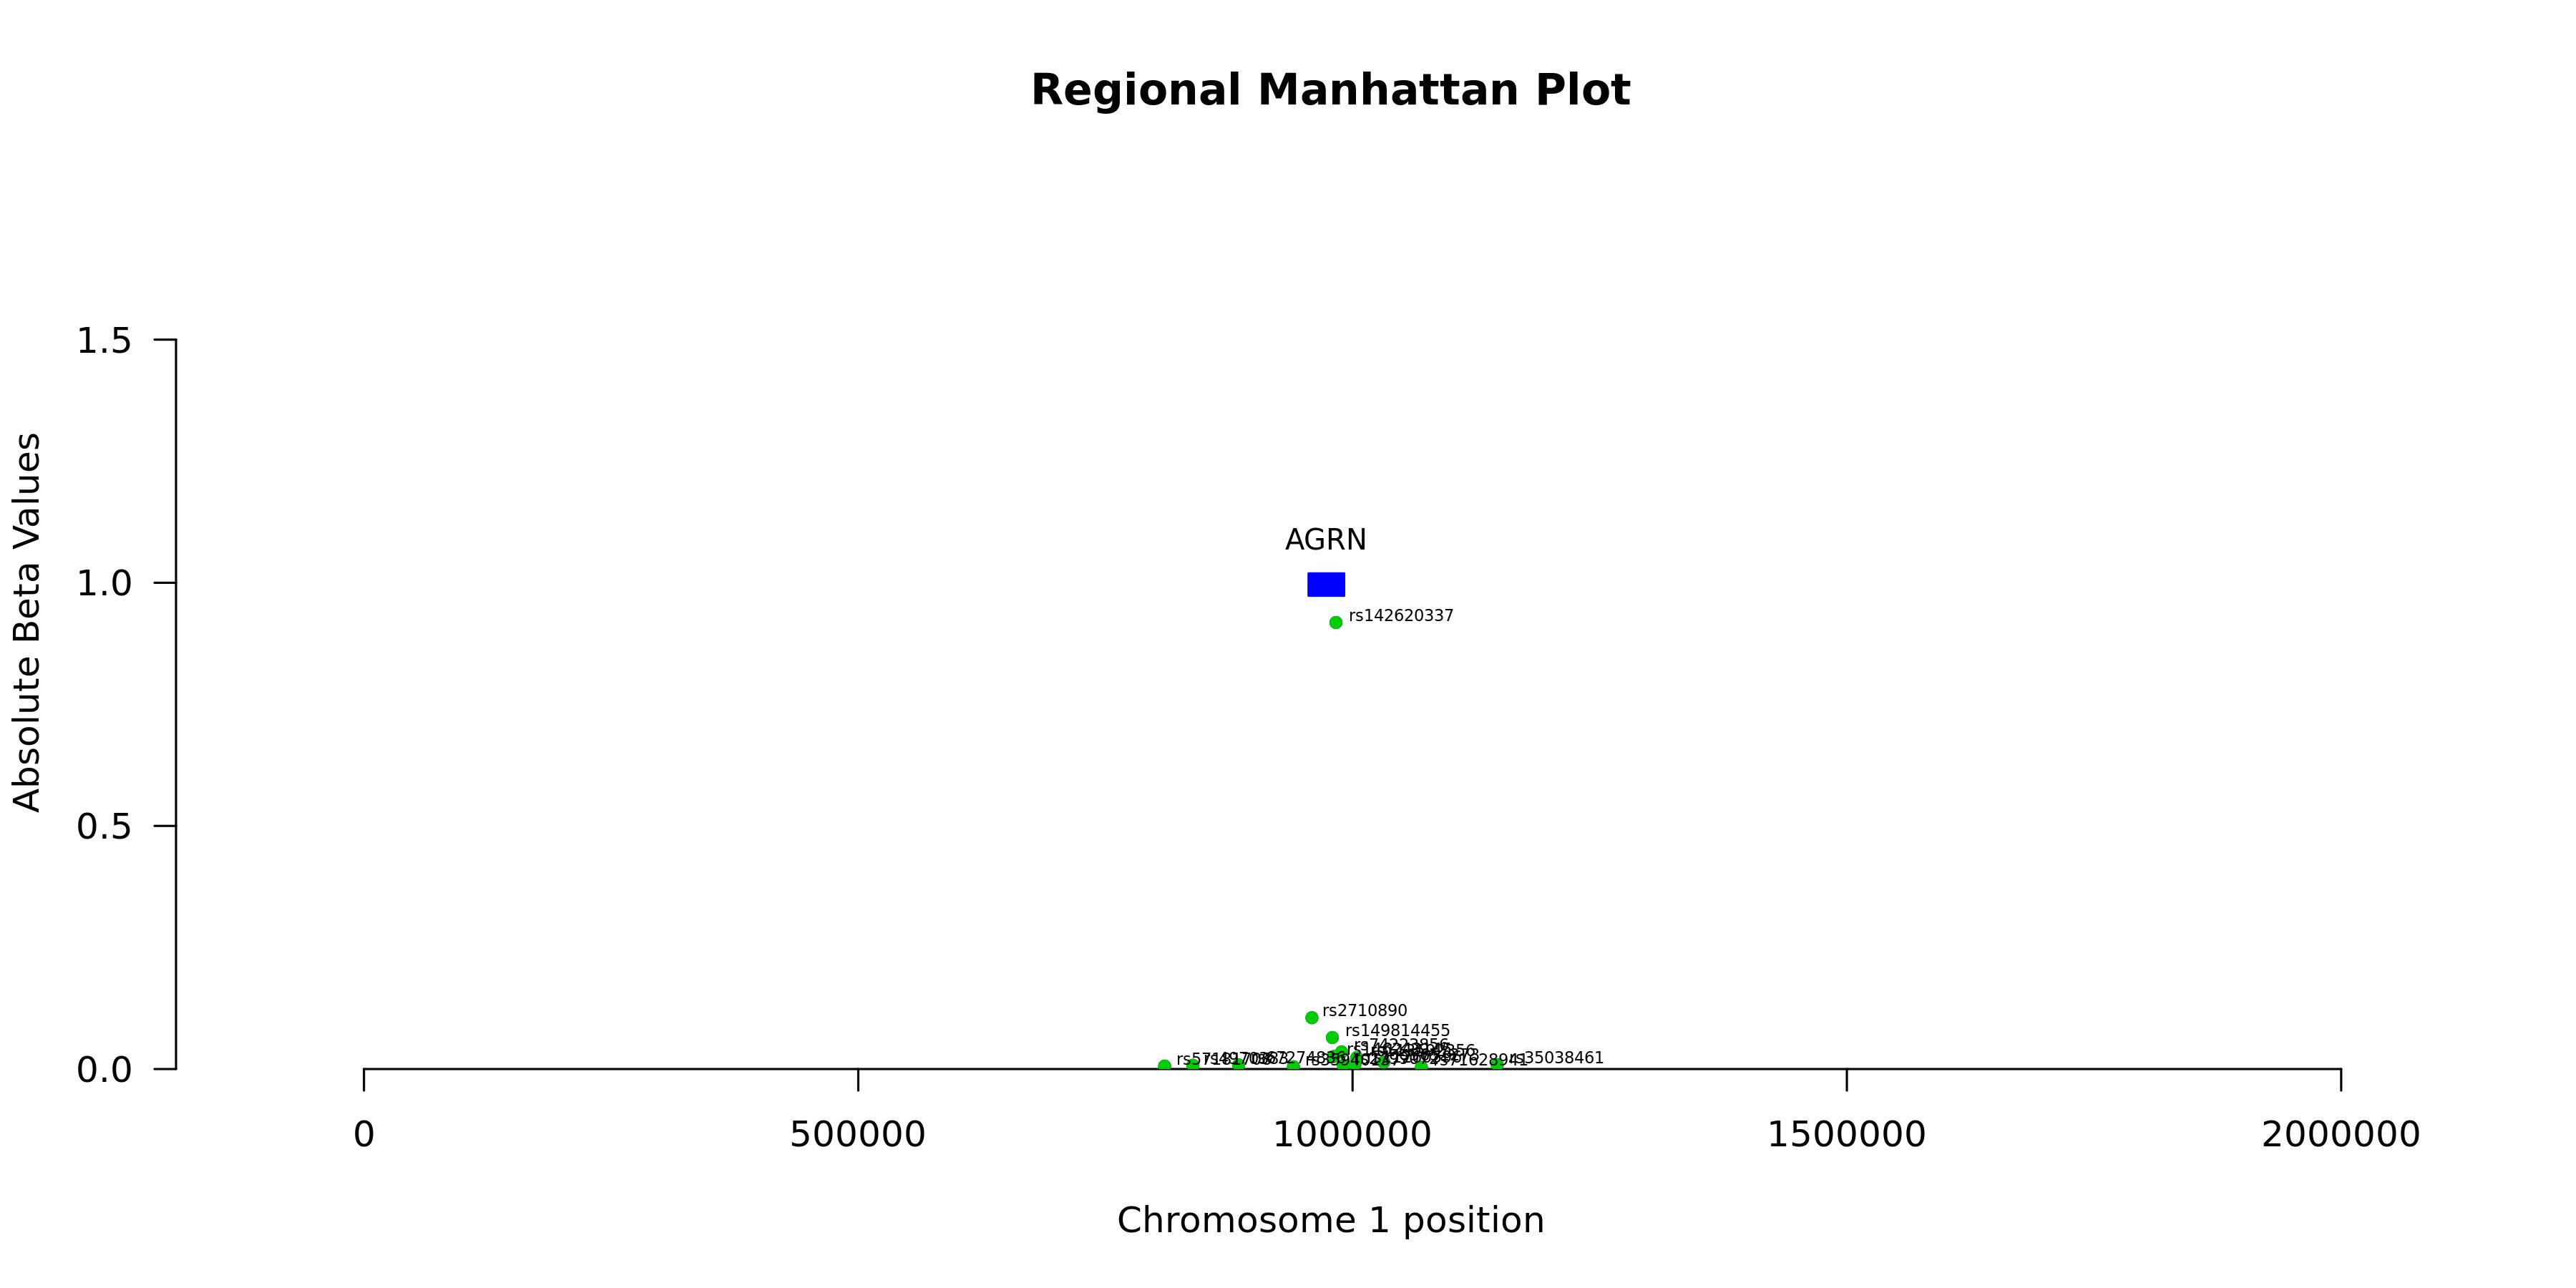
Regional Manhattan Plotenlarge ⤢
Model record
Field
Value
Gene
AGRN
test_n
10538
sparsity
648
pearson_coefficent
0.358830817083447
SE
0.00920468850376531
P_corr
1.67788999188078e-308
R2 Covariate Model
0.0473
R2 Full Model
0.1756
P
0
P_full
0
n_cis_pqtl
73
max_cis_pqtl
rs142620337
rank_max_cis_pqtl
1
mean_pqtl_beta
0.0197034609849685
mean_nopqtl_beta
0.00395453610962166
percentage_pqtl
0.112654320987654
percentage_nopqtl
0.887345679012346
cis and genome-wide metrics
Field
Value
Gene
AGRN
test_n_genomewide
10538
sparsity_genomewide
648
pearson_coefficent_genomewide
0.358830817083447
SE_genomewide
0.00920468850376531
P_corr_genomewide
1.13070612525436e-308
R2_covariate_model_genomewide
0.0472523050145444
R2_full_model_genomewide
0.17557029236822
P_genomewide
0
P_full_genomewide
0
n_cis_pqtl
73
max_cis_pqtl
rs142620337
rank_max_cis_pqtl
1
mean_pqtl_beta
0.0197034609849685
mean_nopqtl_beta
0.00395453610962166
percentage_pqtl
0.112654320987654
percentage_nopqtl
0.887345679012346
test_n_cis
10538
sparsity_cis
73
pearson_coefficent_cis
0.278898963199029
SE_cis
0.00947013695538556
P_corr_cis
4.3199442373609e-183
R2_covariate_model_cis
0.0472523050145444
R2_full_model_cis
0.126583253117471
P_cis
1.91907976171317e-305
P_full_cis
0