ACY3
Olink Explore plasma protein · SNPBoost PRS model
R2 Full Model
0.1157
pearson_coefficent
0.2927
sparsity
325
n_cis_pqtl
17
max_cis_pqtl
rs3758938
Diagnostics
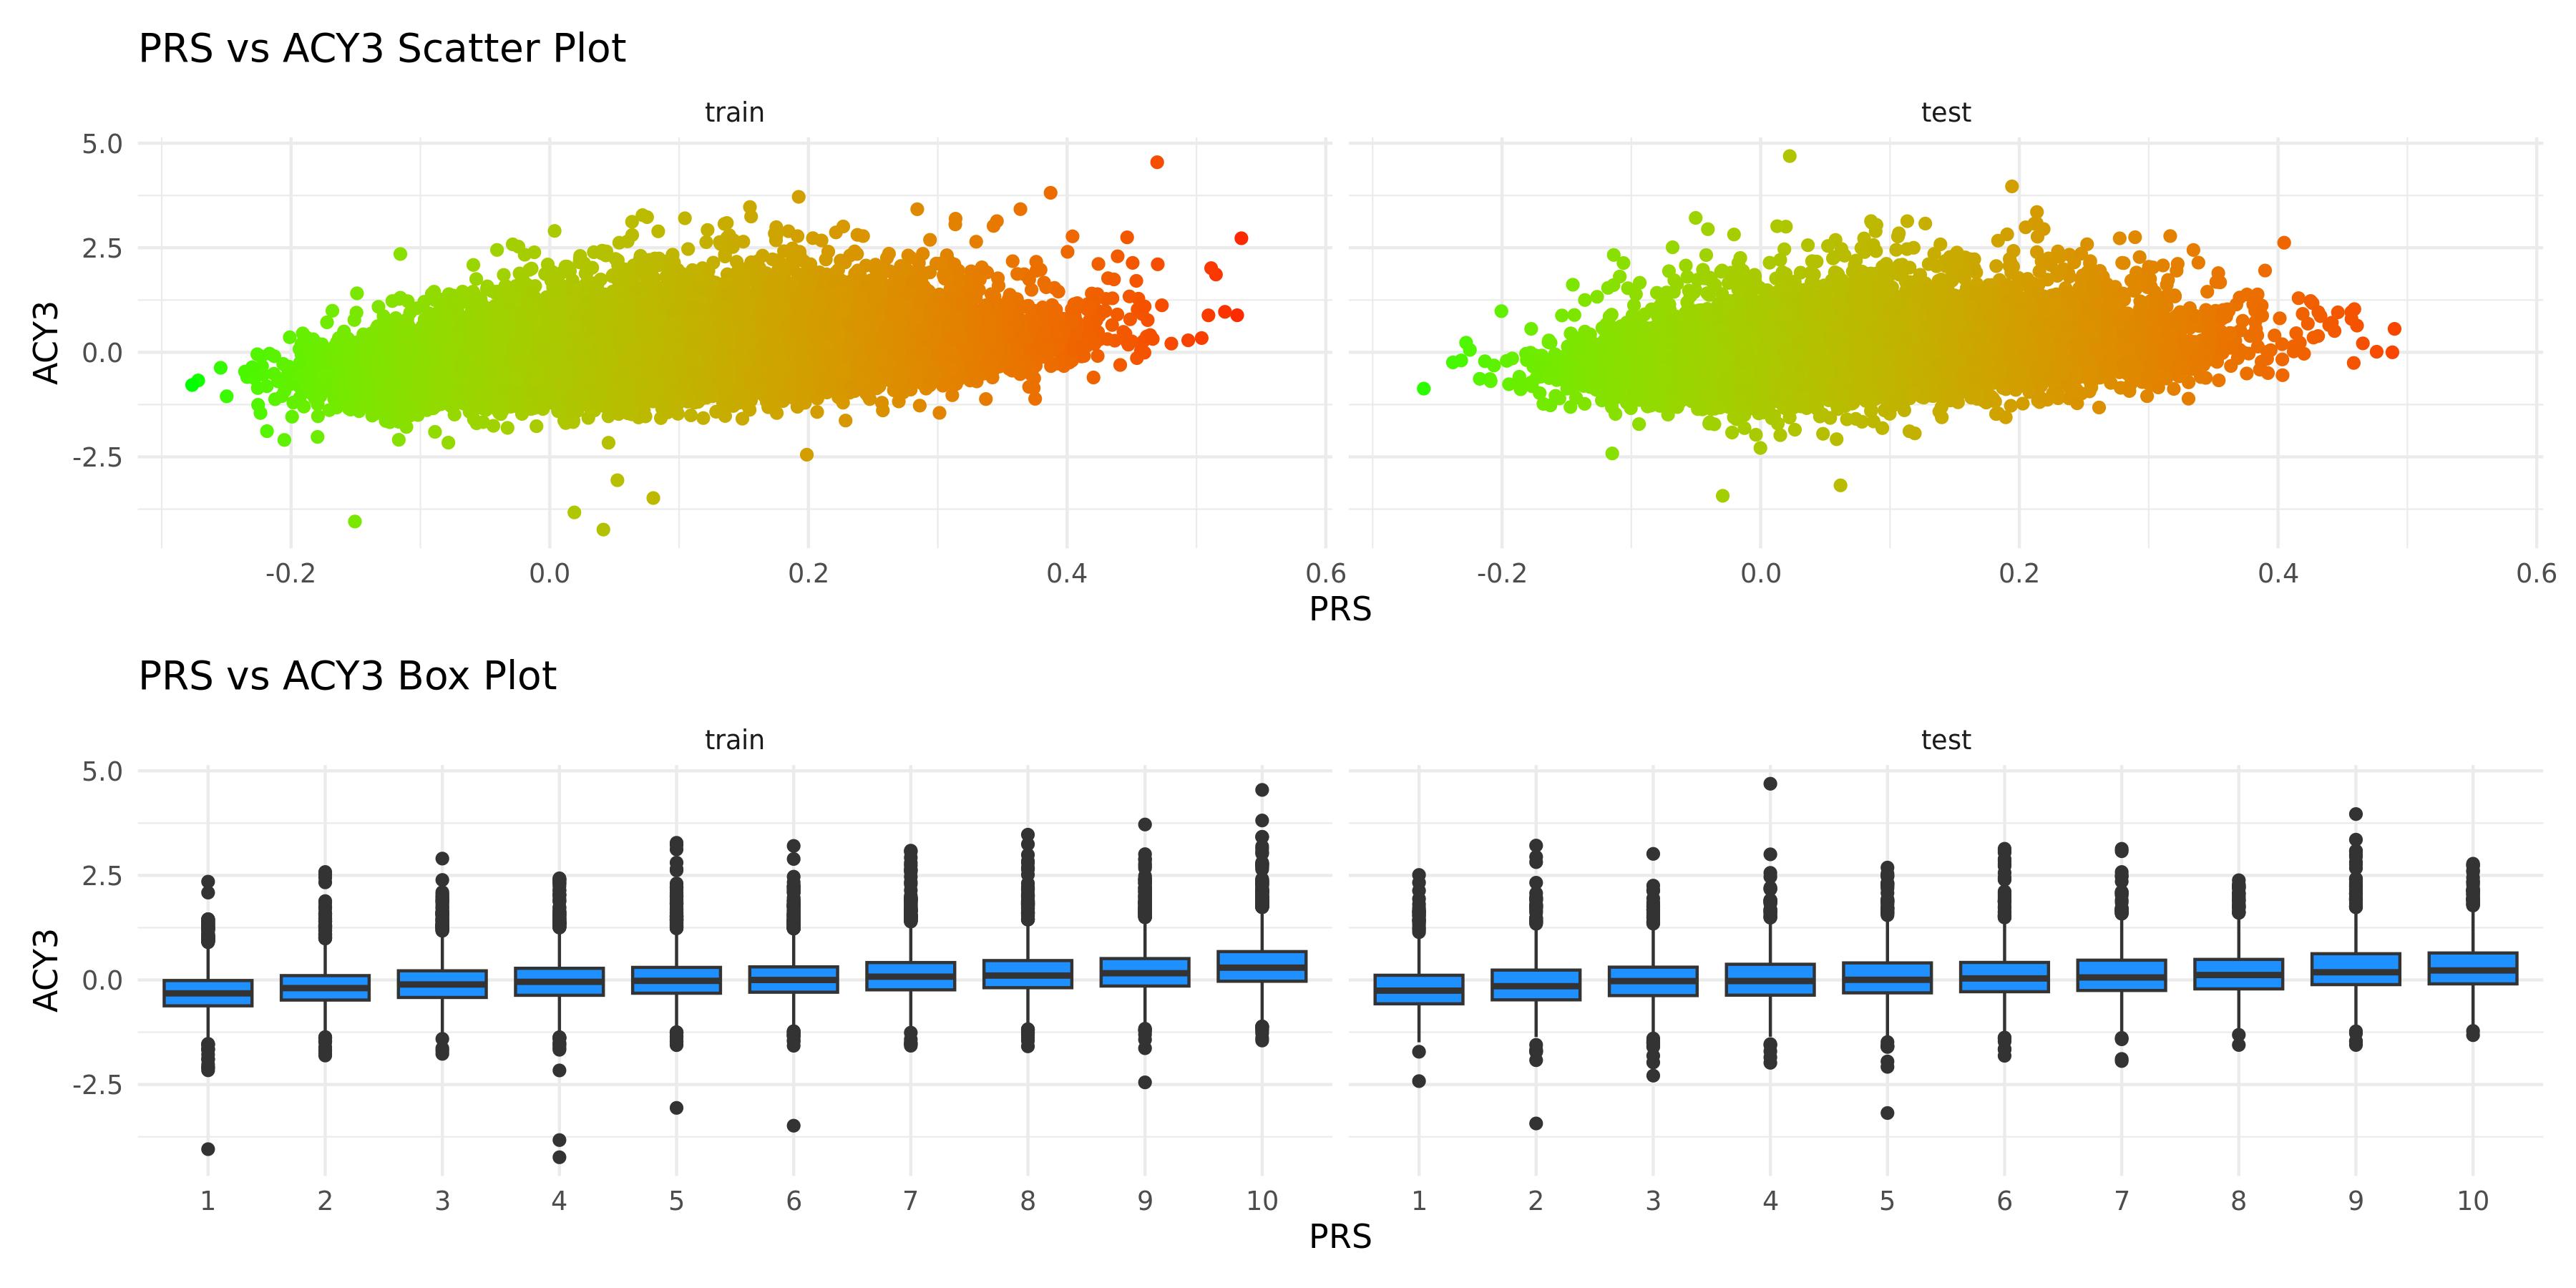
PRS scatter and box plotsenlarge ⤢
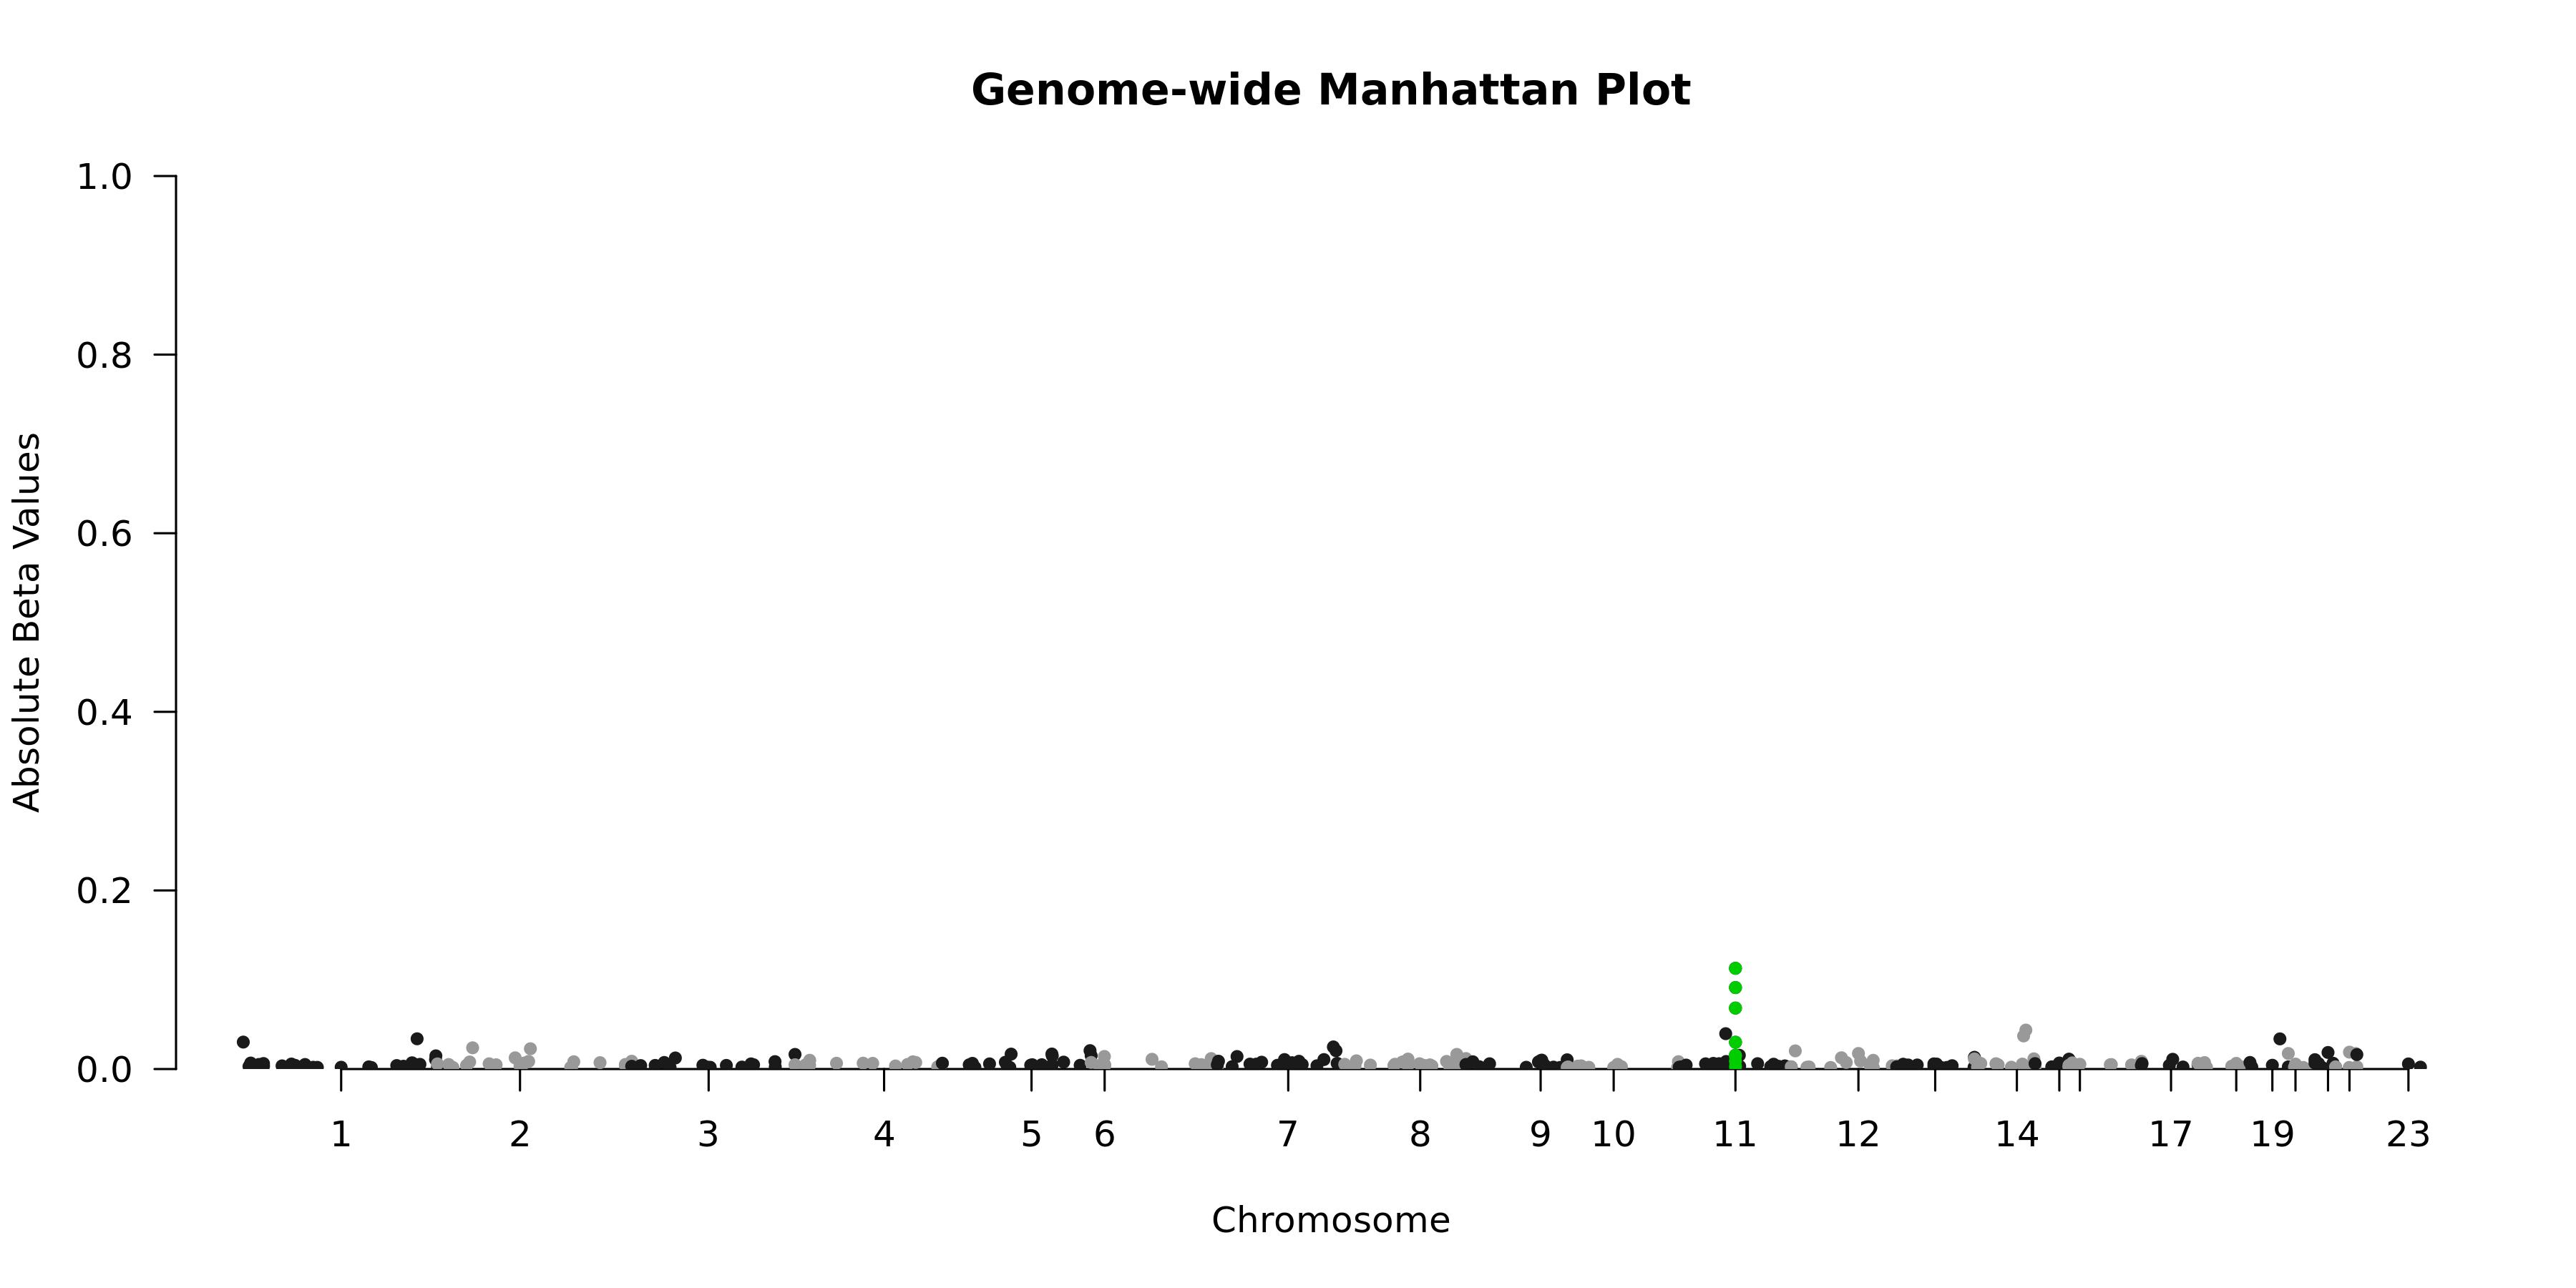
Genome-wide Manhattan Plotenlarge ⤢
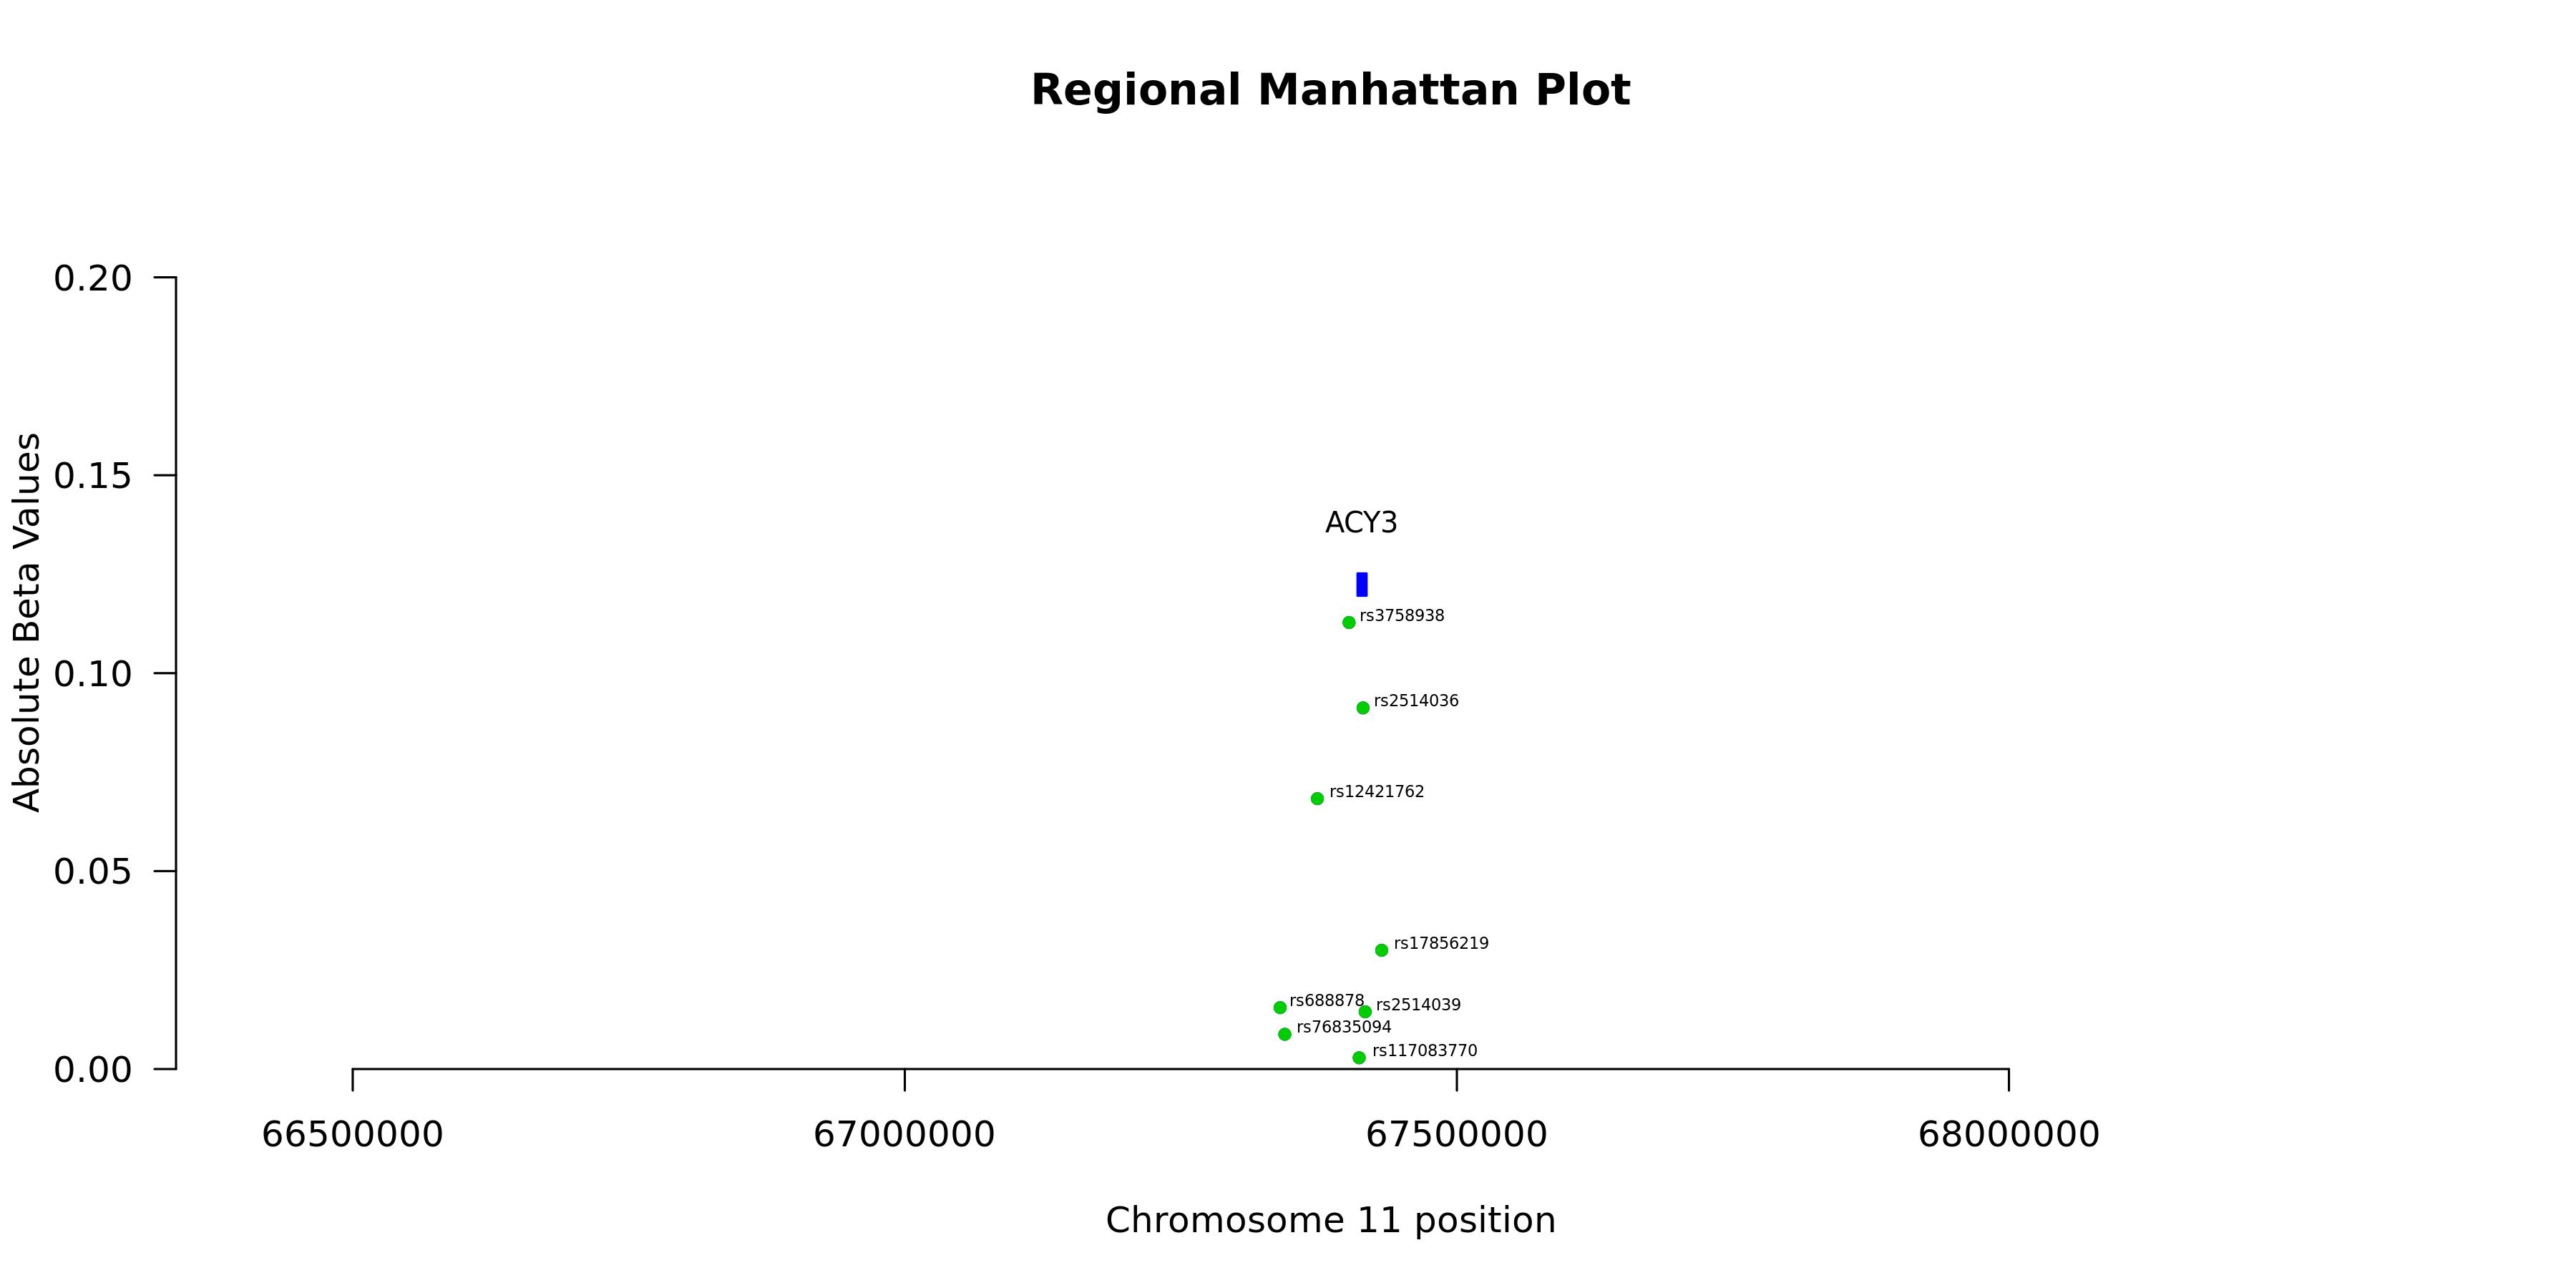
Regional Manhattan Plotenlarge ⤢
Model record
Field
Value
Gene
ACY3
test_n
10538
sparsity
325
pearson_coefficent
0.292668924511247
SE
0.0104412309503643
P_corr
2.44443773717855e-165
R2 Covariate Model
0.0298
R2 Full Model
0.1157
P
1.70006767345136e-226
P_full
0
n_cis_pqtl
17
max_cis_pqtl
rs3758938
rank_max_cis_pqtl
1
mean_pqtl_beta
0.0227895901222053
mean_nopqtl_beta
0.00627641768339361
percentage_pqtl
0.0523076923076923
percentage_nopqtl
0.947692307692308
cis and genome-wide metrics
Field
Value
Gene
ACY3
test_n_genomewide
10538
sparsity_genomewide
325
pearson_coefficent_genomewide
0.292668924511247
SE_genomewide
0.0104412309503643
P_corr_genomewide
2.44443773717855e-165
R2_covariate_model_genomewide
0.029813570234964
R2_full_model_genomewide
0.115690907990242
P_genomewide
1.70006767345136e-226
P_full_genomewide
0
n_cis_pqtl
17
max_cis_pqtl
rs3758938
rank_max_cis_pqtl
1
mean_pqtl_beta
0.0227895901222053
mean_nopqtl_beta
0.00627641768339361
percentage_pqtl
0.0523076923076923
percentage_nopqtl
0.947692307692308
test_n_cis
10538
sparsity_cis
17
pearson_coefficent_cis
0.211680246024203
SE_cis
0.0106719036844997
P_corr_cis
1.32615593675705e-85
R2_covariate_model_cis
0.029813570234964
R2_full_model_cis
0.0765259900470416
P_cis
2.89616142401702e-147
P_full_cis
2.1160801242527e-304