ST13
Olink Explore plasma protein · SNPBoost PRS model
R2 Full Model
0.0293
pearson_coefficent
0.1432
sparsity
98
n_cis_pqtl
1
max_cis_pqtl
rs5758172
Diagnostics
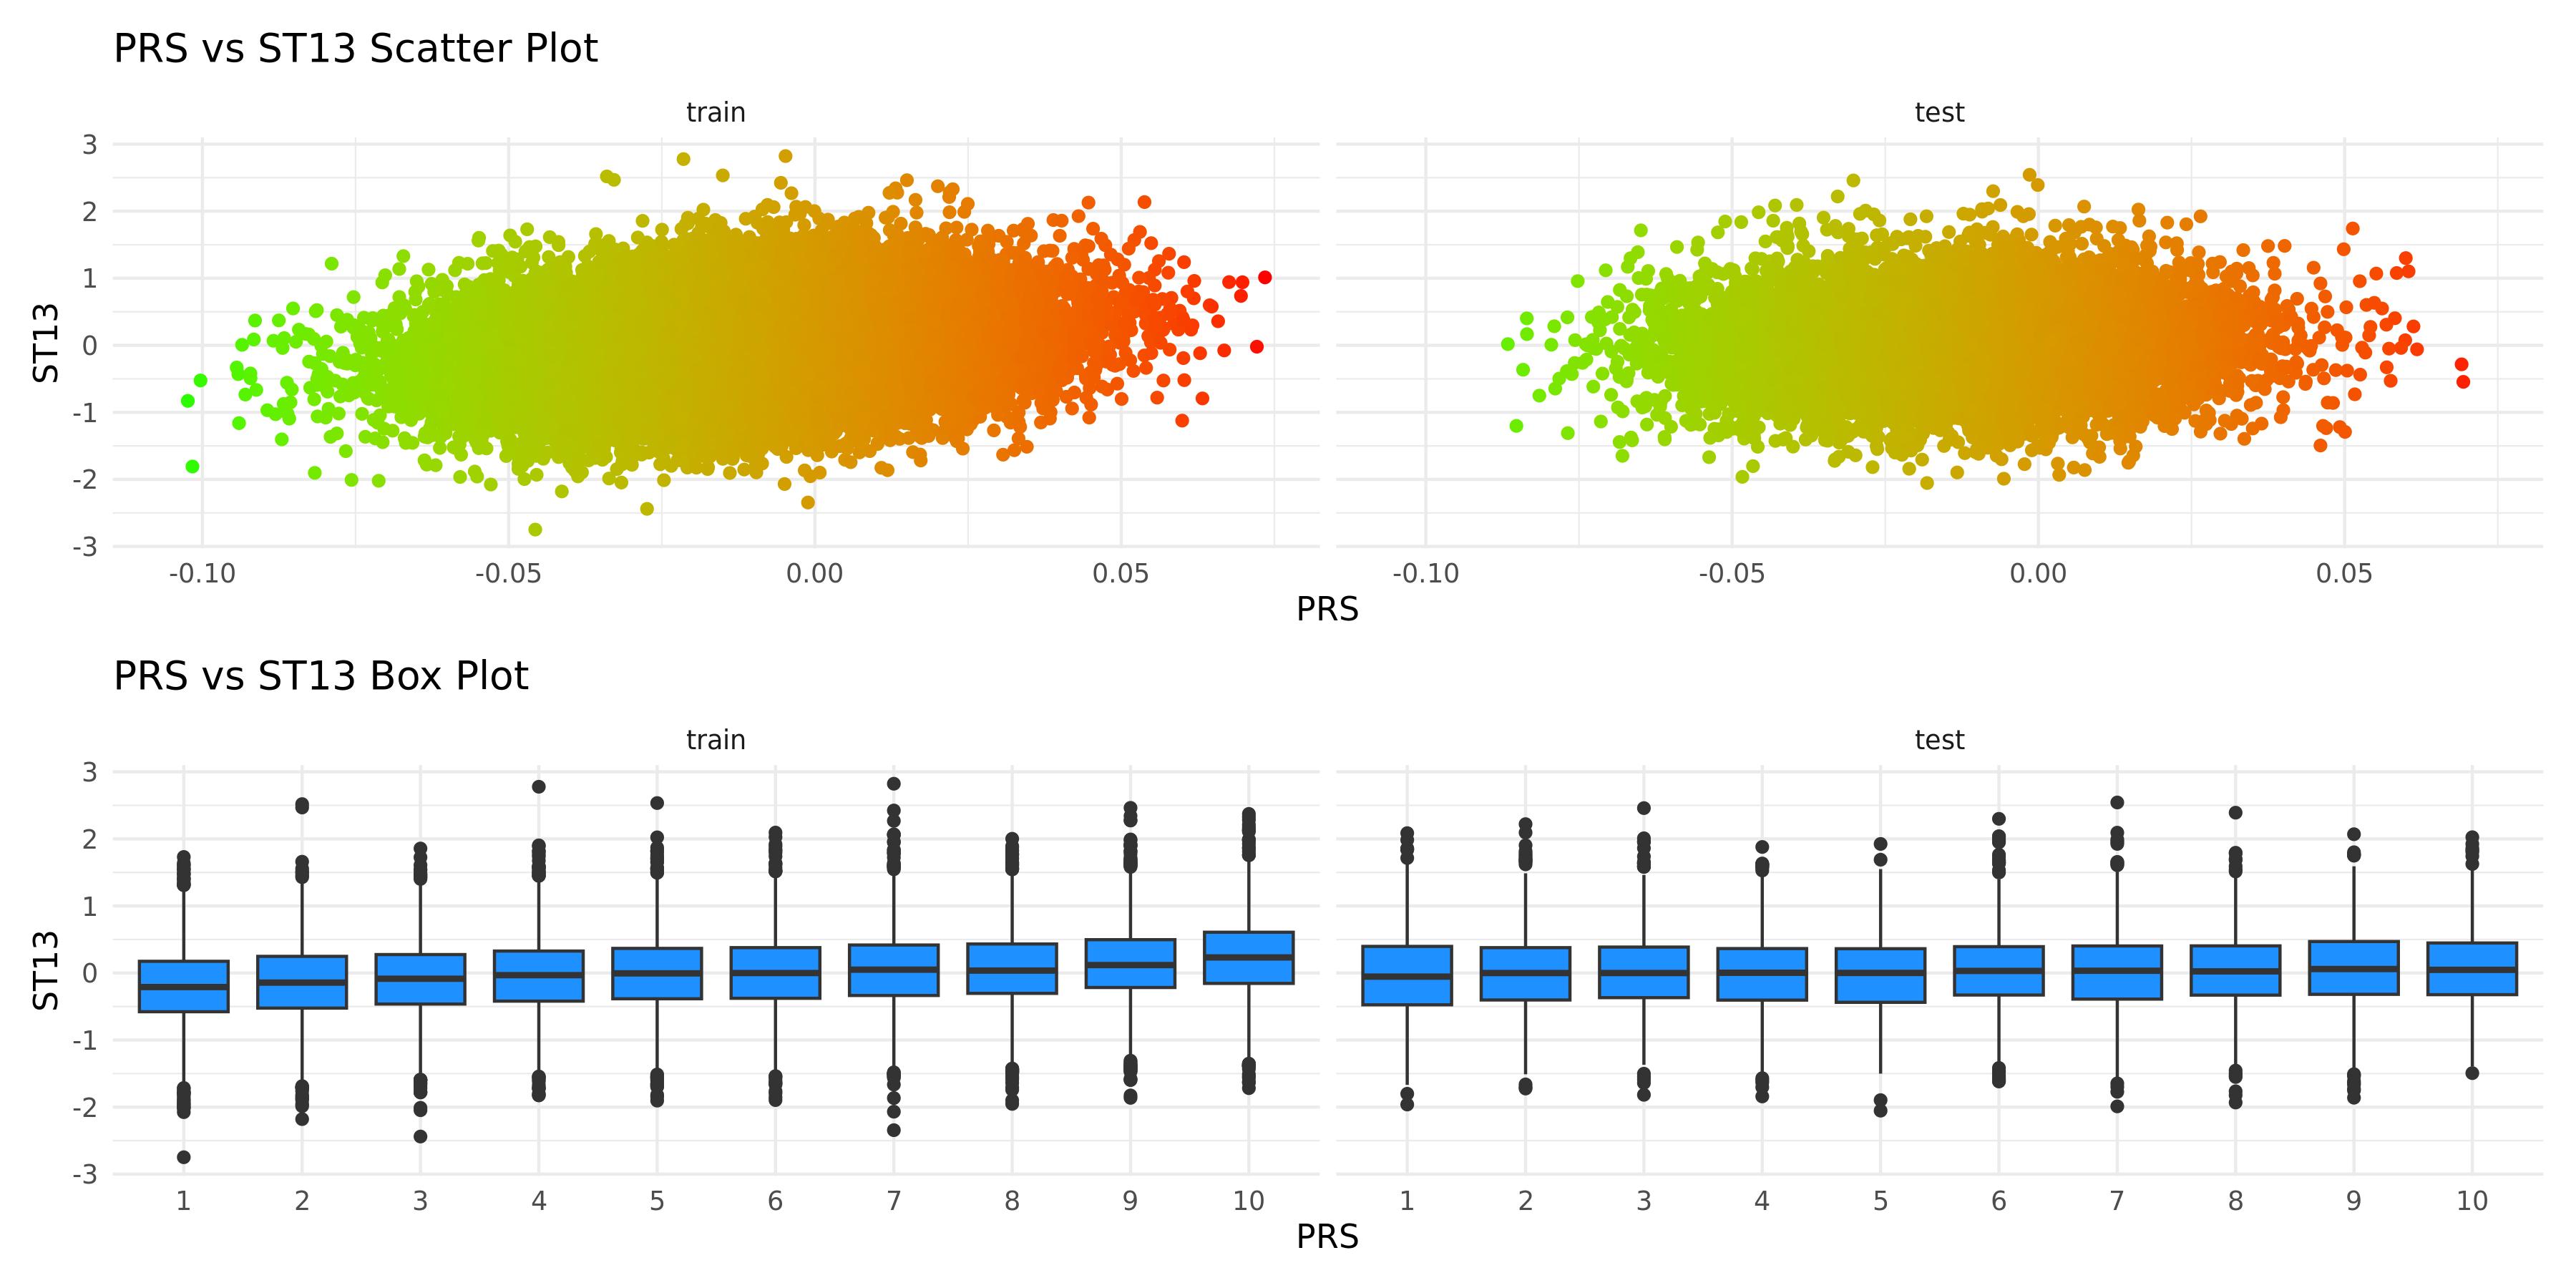
PRS scatter and box plotsenlarge ⤢
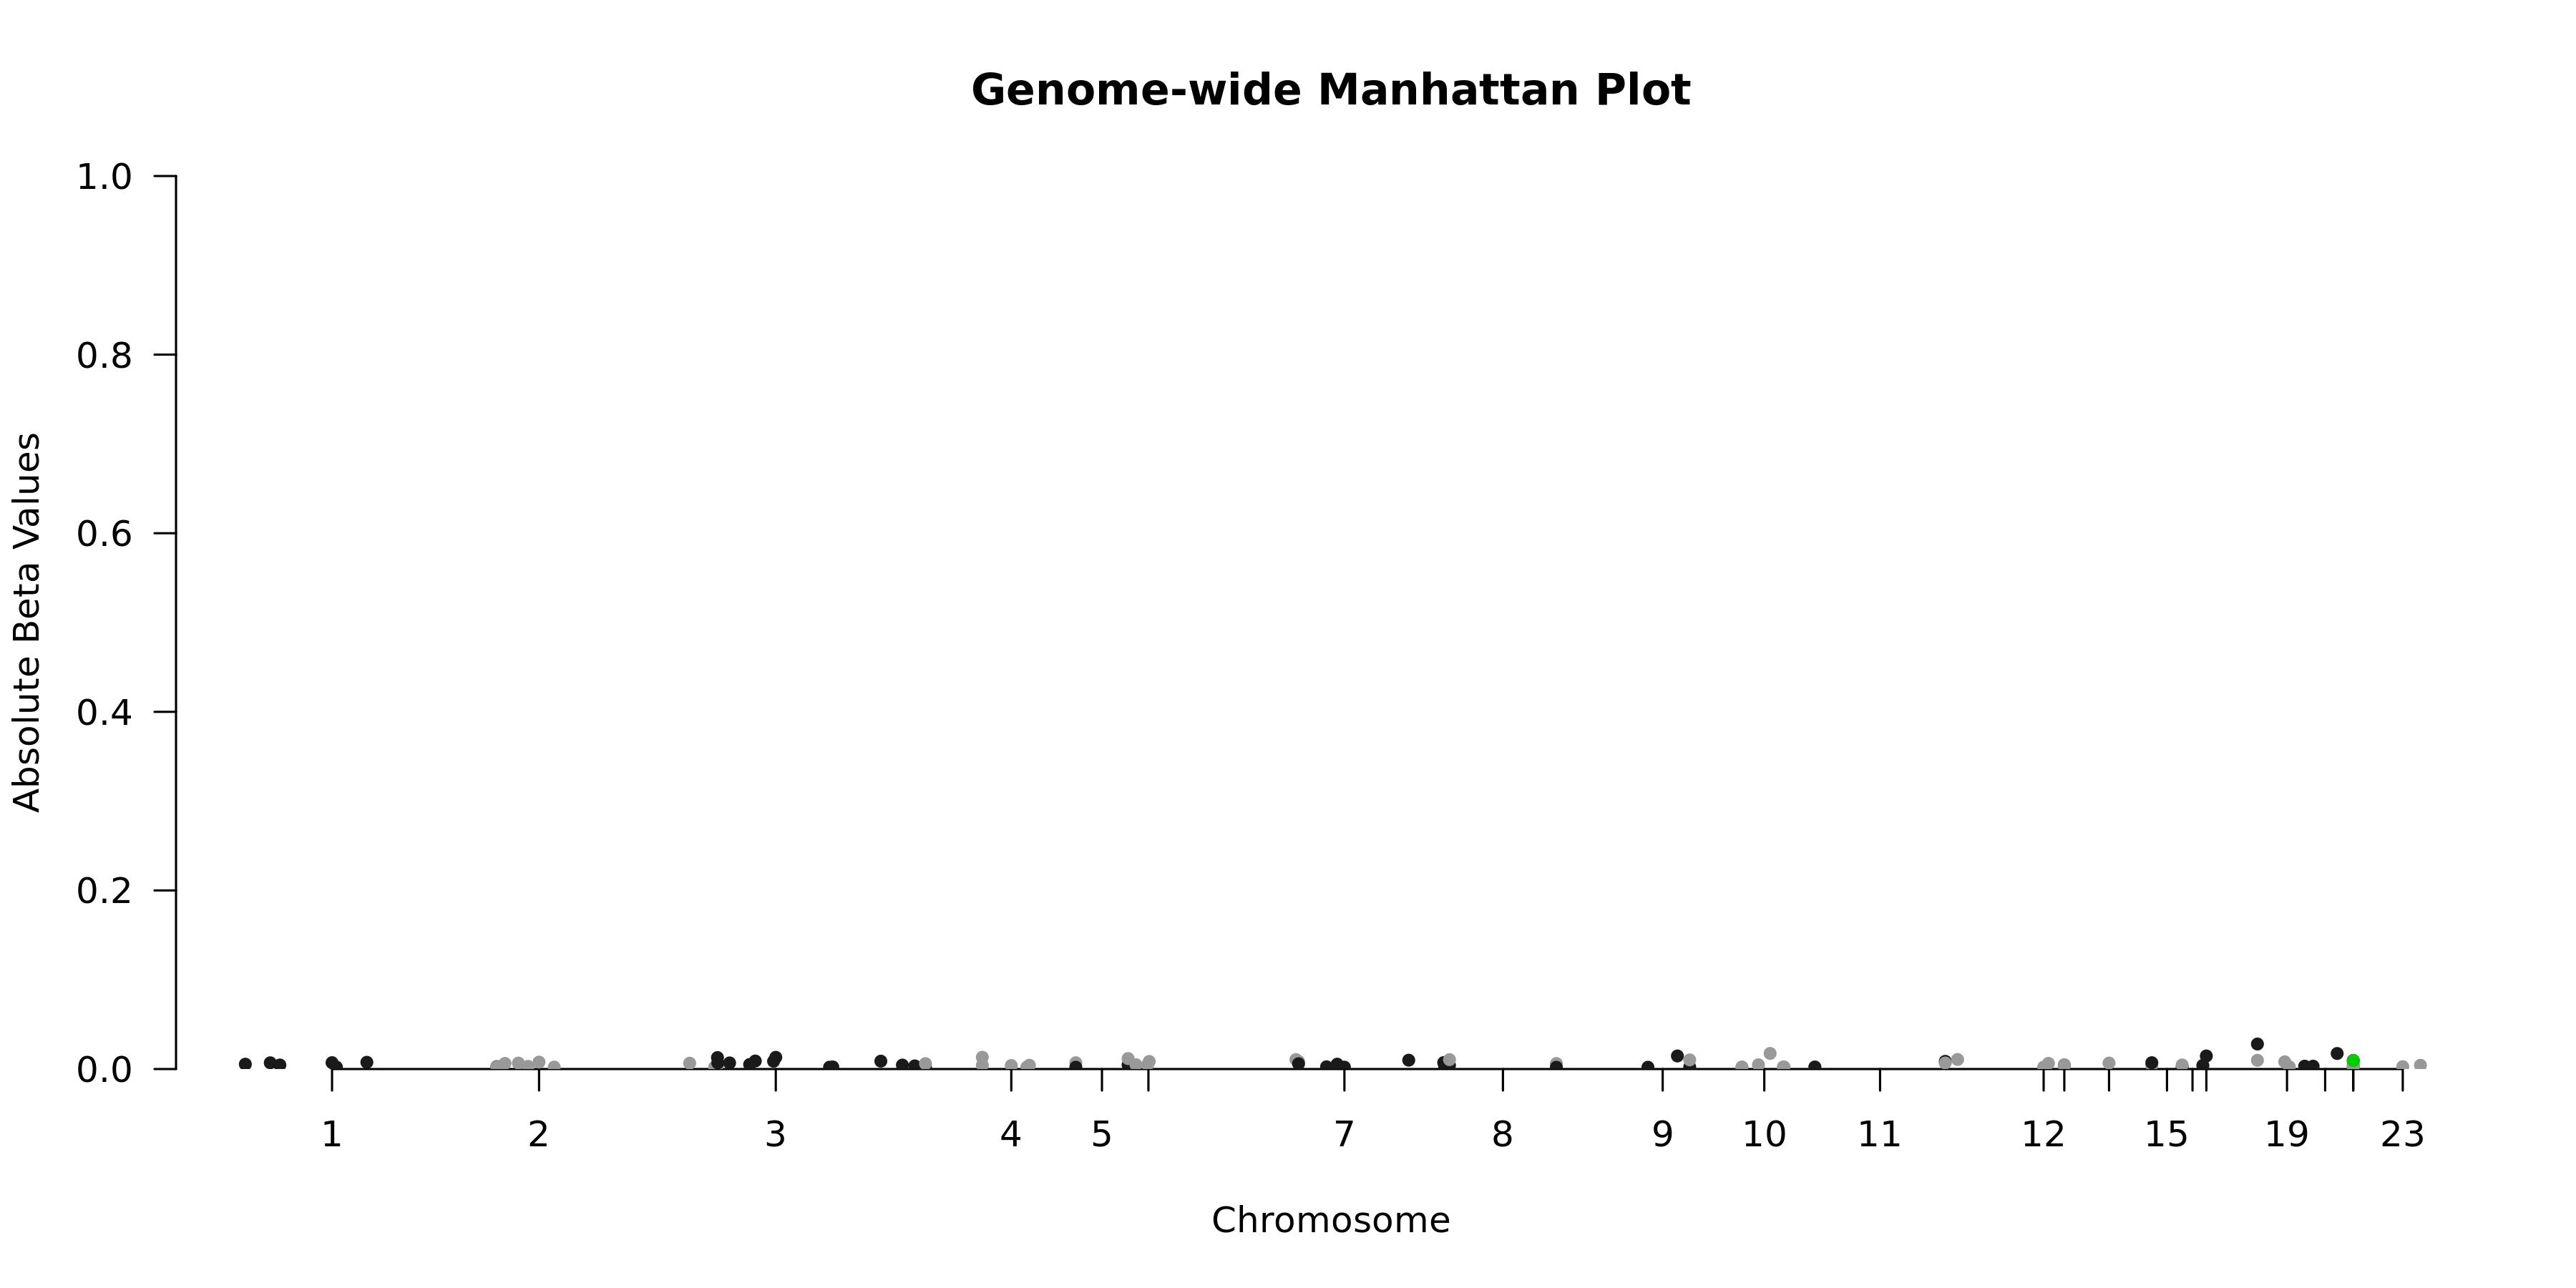
Genome-wide Manhattan Plotenlarge ⤢
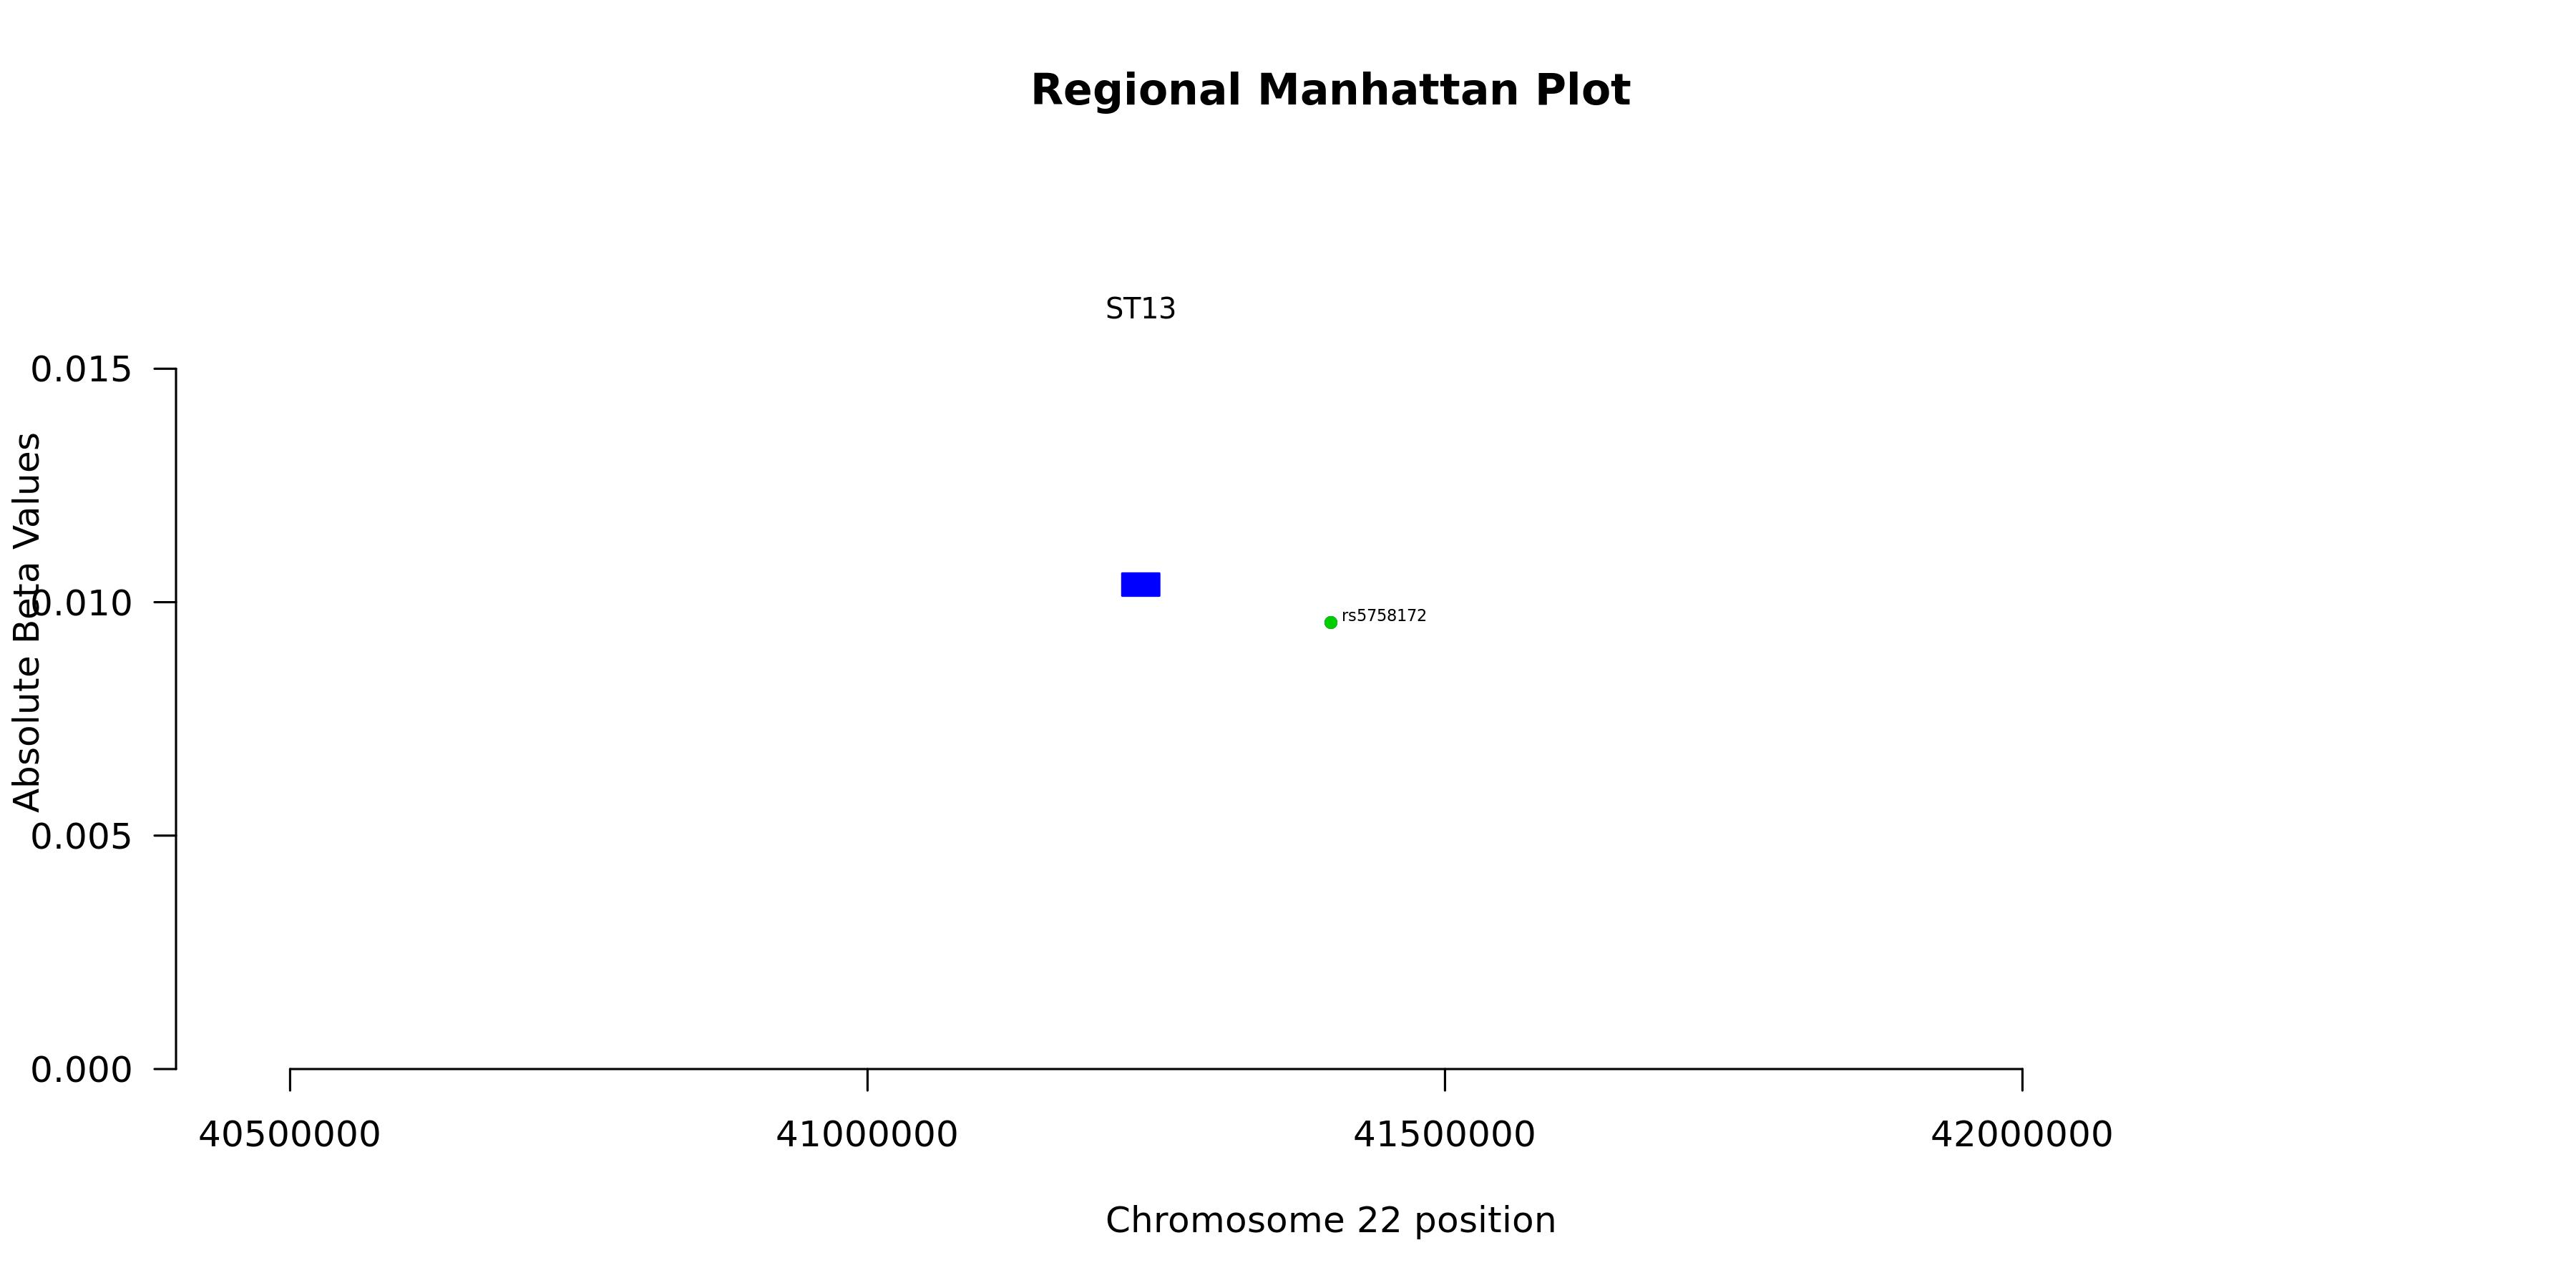
Regional Manhattan Plotenlarge ⤢
Model record
Field
Value
Gene
ST13
test_n
10538
sparsity
98
pearson_coefficent
0.143190429111727
SE
0.0107467689745515
P_corr
4.23767867941247e-40
R2 Covariate Model
0.0087
R2 Full Model
0.0293
P
2.29307059361811e-57
P_full
1.34402899538499e-135
n_cis_pqtl
1
max_cis_pqtl
rs5758172
rank_max_cis_pqtl
16
mean_pqtl_beta
0.009563862357562
mean_nopqtl_beta
0.00589436172778052
percentage_pqtl
0.0102040816326531
percentage_nopqtl
0.989795918367347
cis and genome-wide metrics
Field
Value
Gene
ST13
test_n_genomewide
10538
sparsity_genomewide
98
pearson_coefficent_genomewide
0.143190429111727
SE_genomewide
0.0107467689745515
P_corr_genomewide
4.23767867941247e-40
R2_covariate_model_genomewide
0.00865055536022608
R2_full_model_genomewide
0.0292690028927497
P_genomewide
2.29307059361811e-57
P_full_genomewide
1.34402899538499e-135
n_cis_pqtl
1
max_cis_pqtl
rs5758172
rank_max_cis_pqtl
16
mean_pqtl_beta
0.009563862357562
mean_nopqtl_beta
0.00589436172778052
percentage_pqtl
0.0102040816326531
percentage_nopqtl
0.989795918367347
test_n_cis
10538
sparsity_cis
1
pearson_coefficent_cis
0.0233012570976802
SE_cis
0.0108557175875754
P_corr_cis
0.0318653597327364
R2_covariate_model_cis
0.00865055536022597
R2_full_model_cis
0.00901227089929002
P_cis
1.93781769504413e-19
P_full_cis
2.76747306651465e-10