SFRP1
Olink Explore plasma protein · SNPBoost PRS model
R2 Full Model
0.1618
pearson_coefficent
0.2825
sparsity
325
n_cis_pqtl
32
max_cis_pqtl
rs78272154
Diagnostics
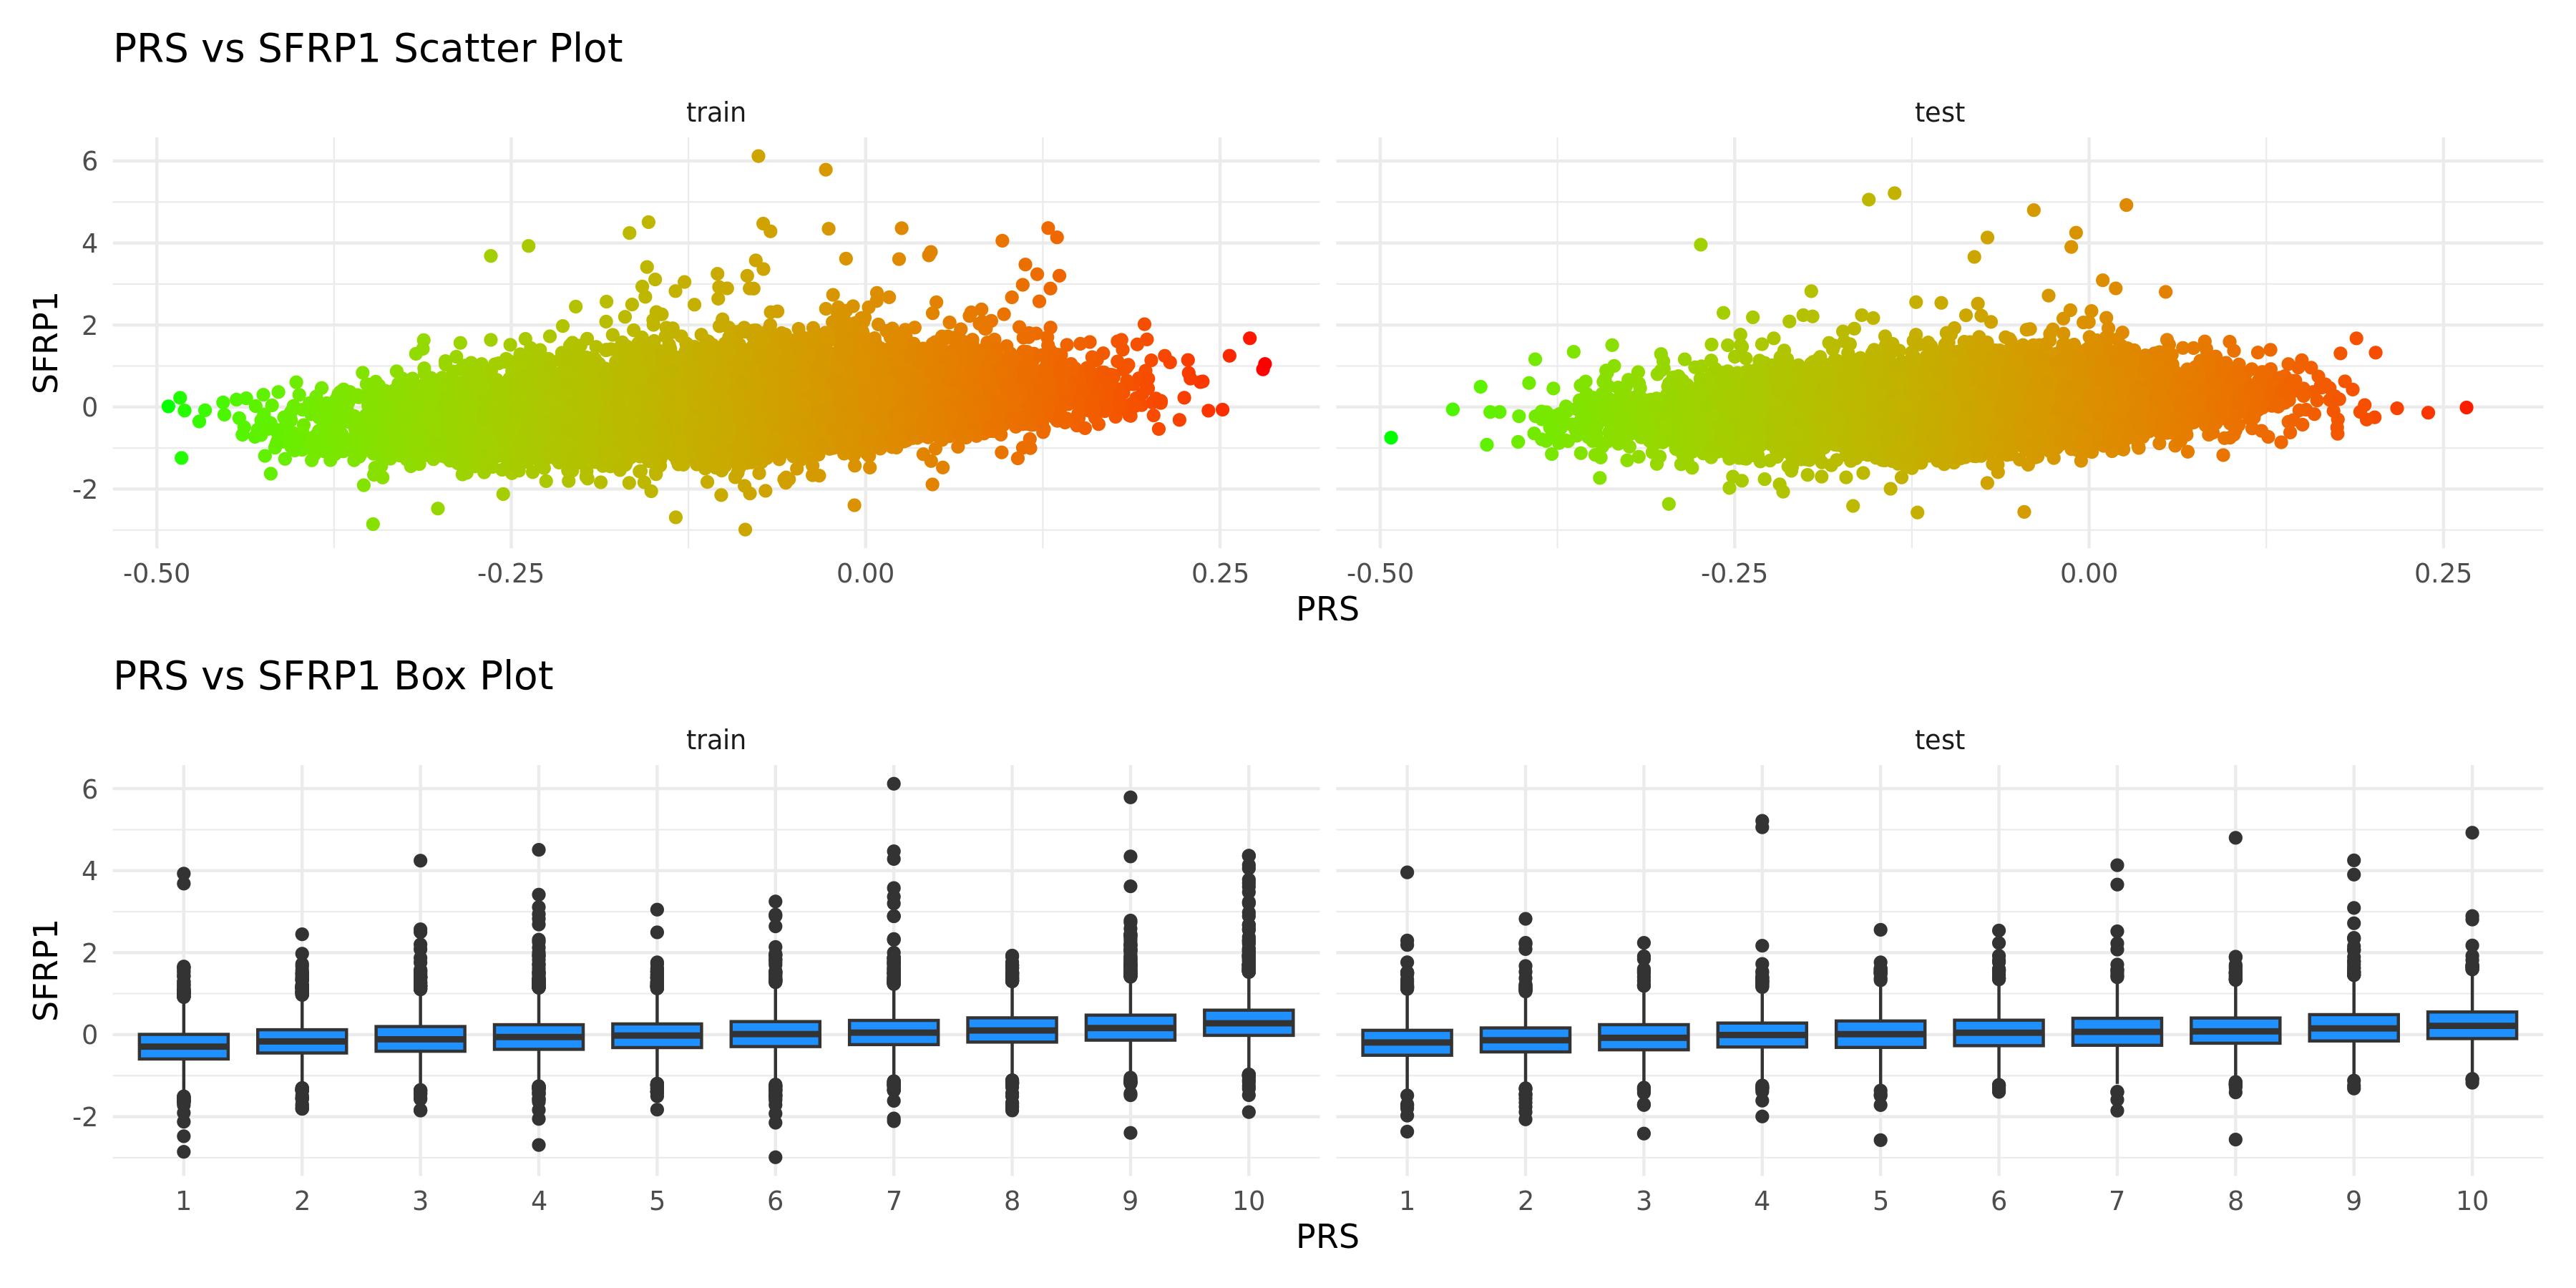
PRS scatter and box plotsenlarge ⤢
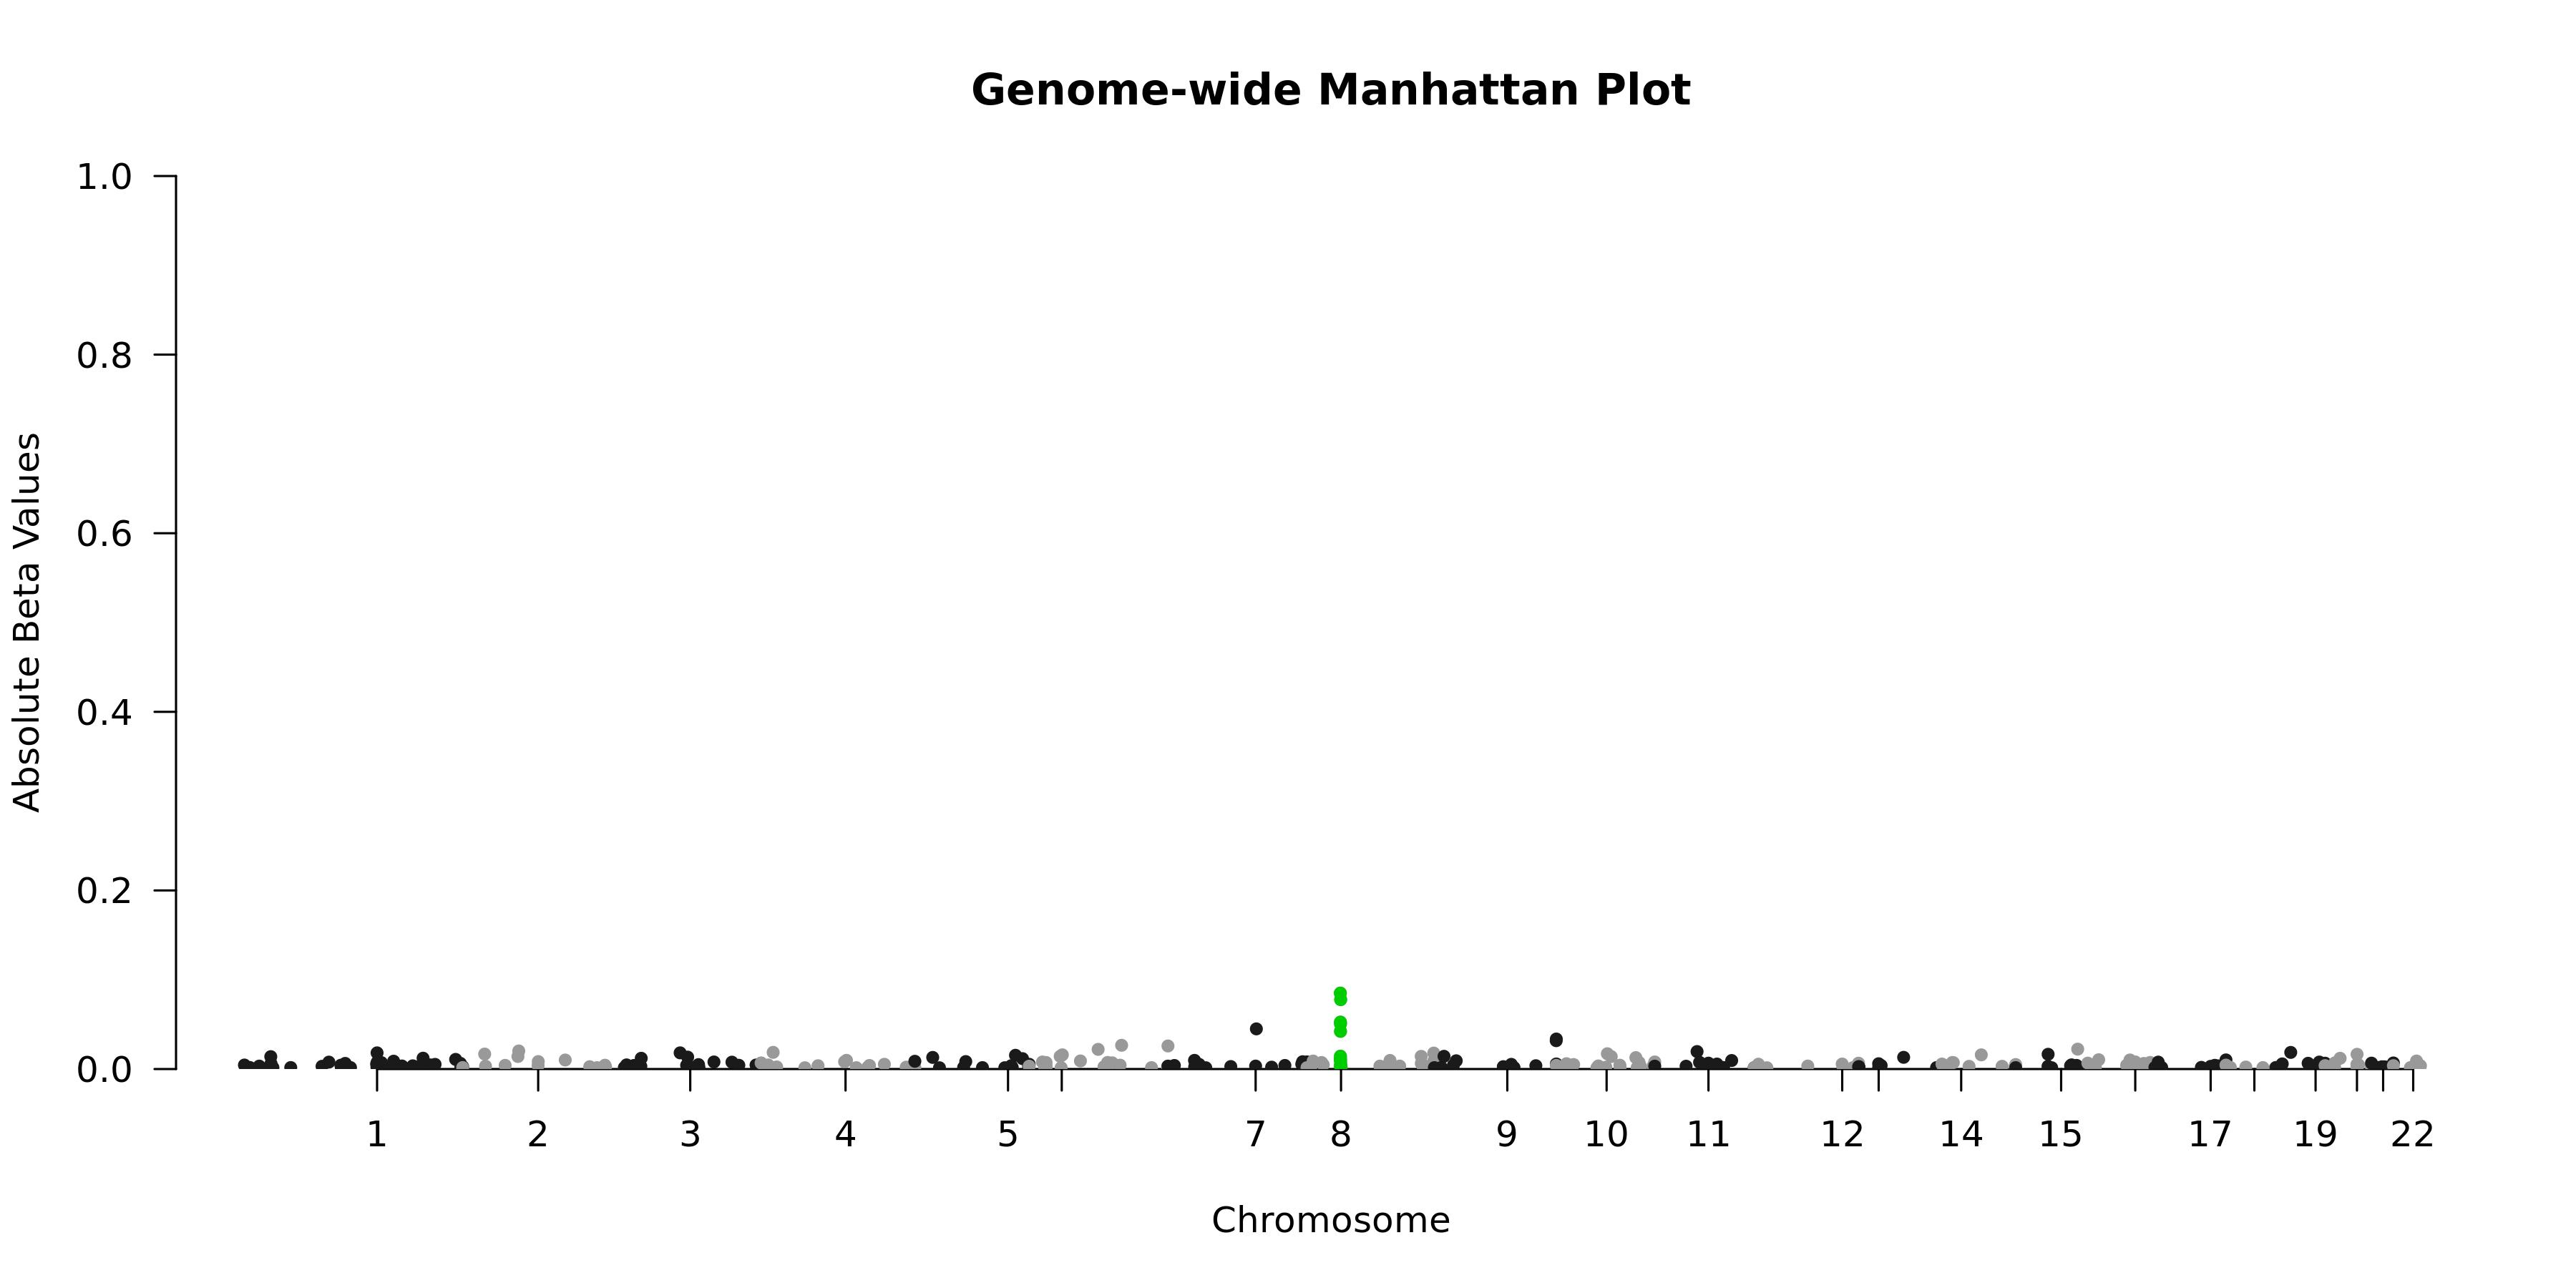
Genome-wide Manhattan Plotenlarge ⤢
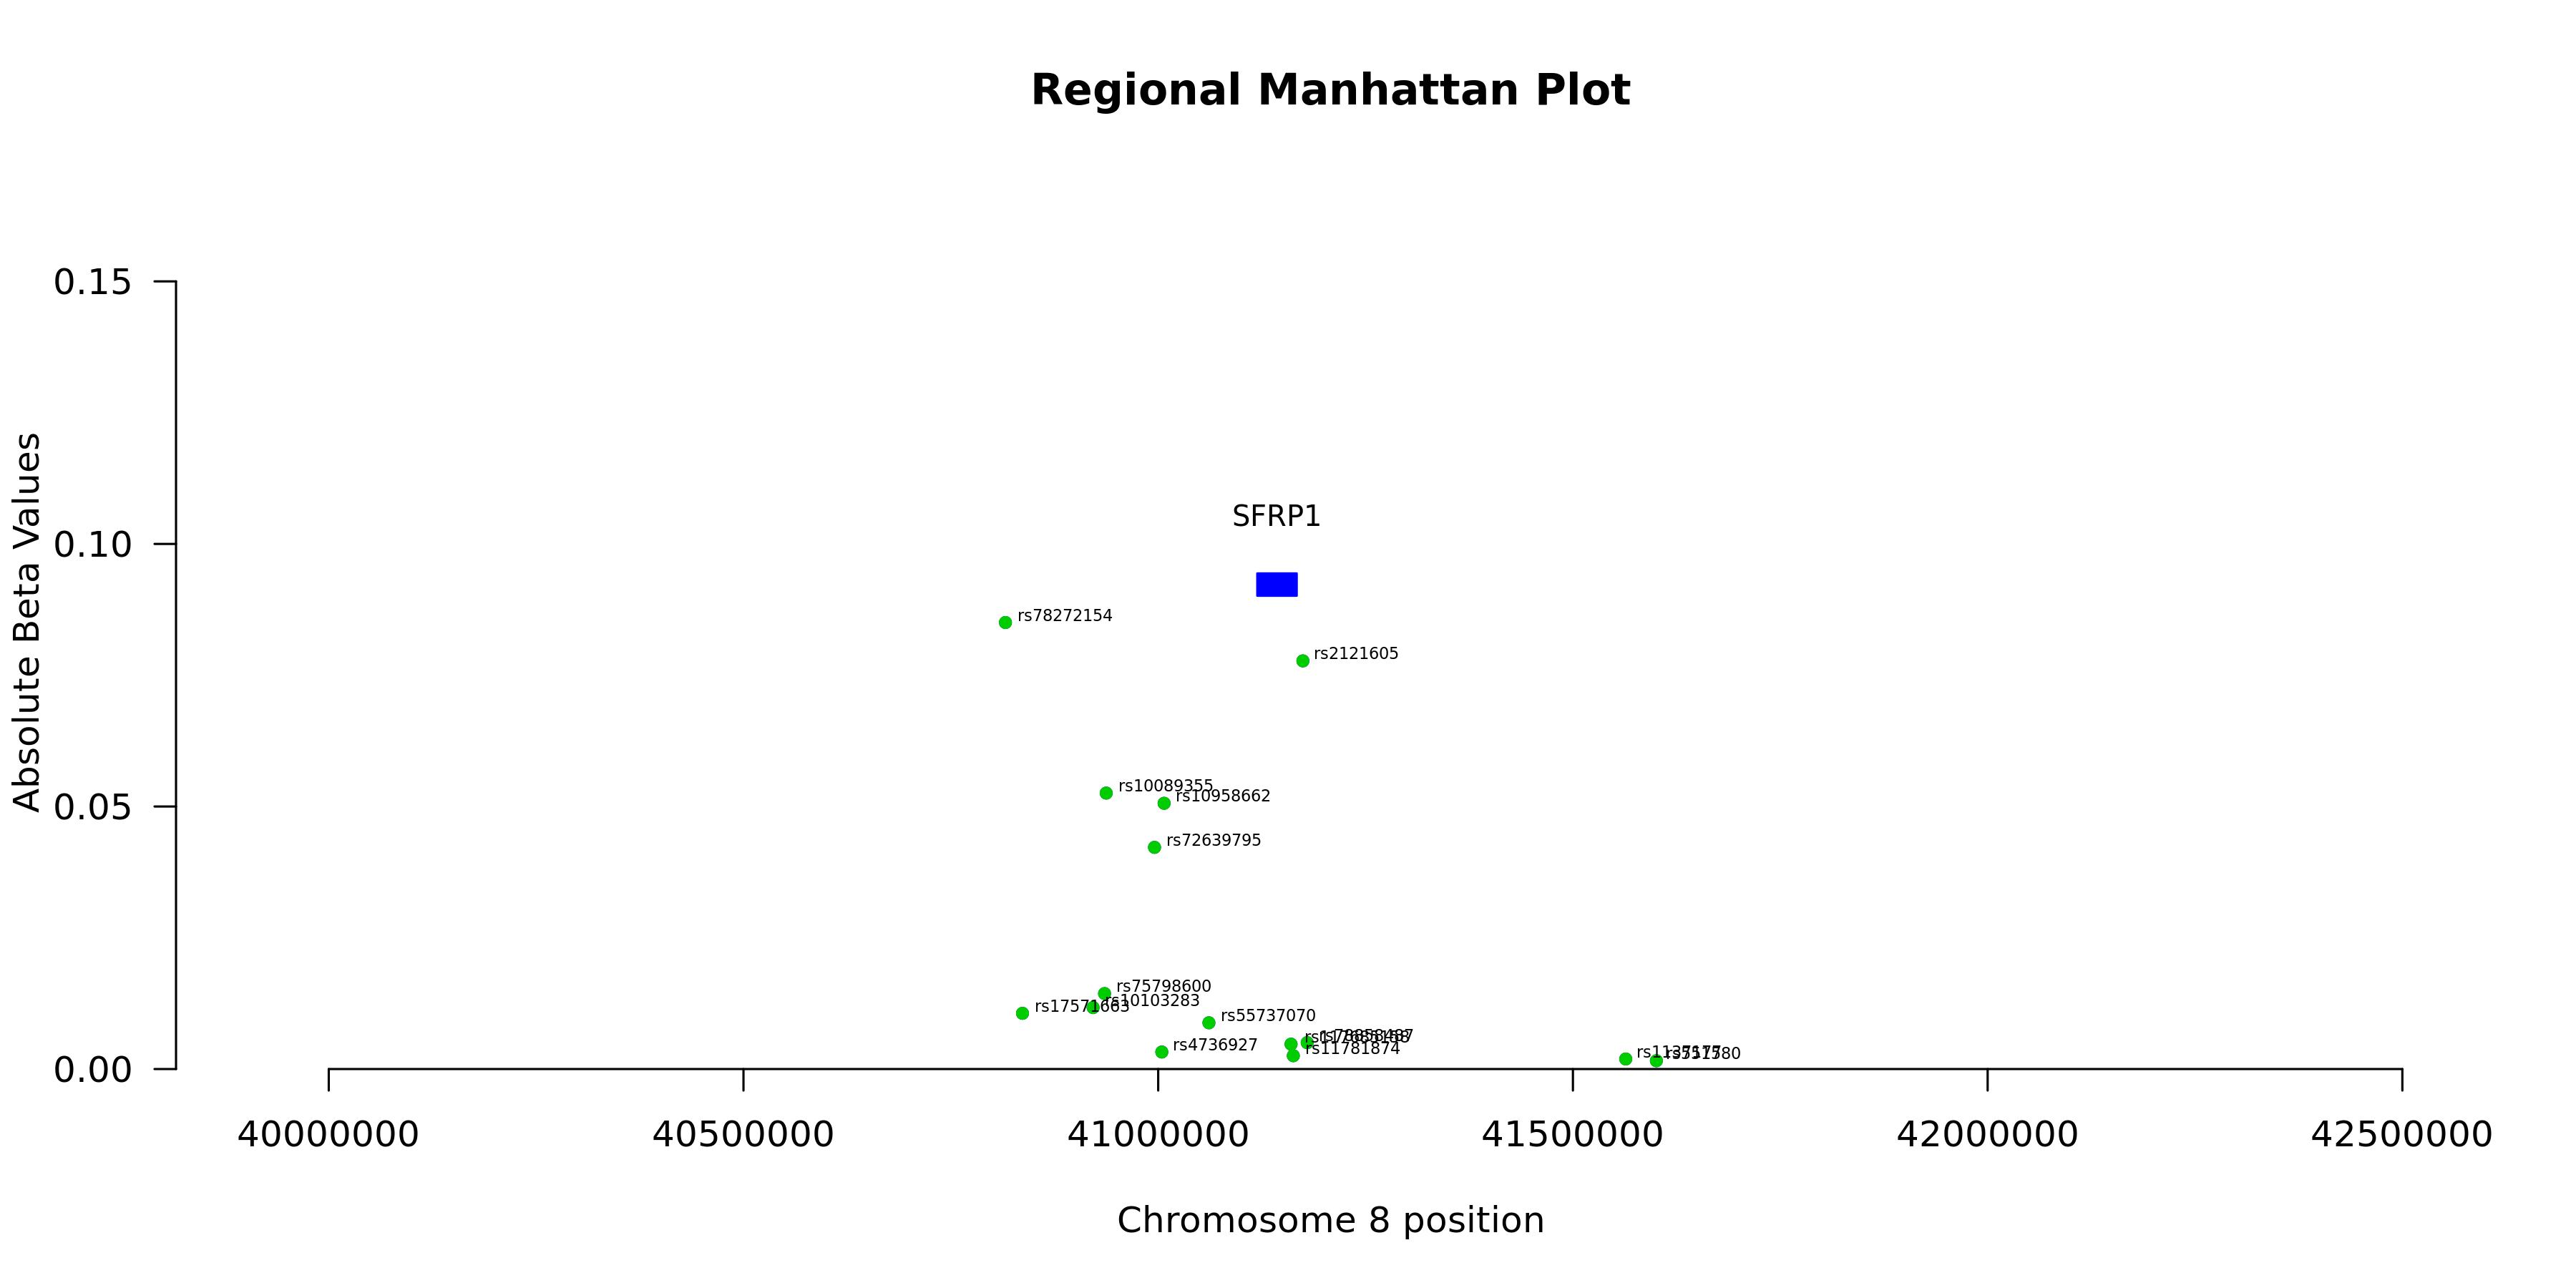
Regional Manhattan Plotenlarge ⤢
Model record
Field
Value
Gene
SFRP1
test_n
10538
sparsity
325
pearson_coefficent
0.282451216432203
SE
0.00952073196290768
P_corr
1.46037286486742e-185
R2 Covariate Model
0.0881
R2 Full Model
0.1618
P
0
P_full
0
n_cis_pqtl
32
max_cis_pqtl
rs78272154
rank_max_cis_pqtl
1
mean_pqtl_beta
0.0149156065231644
mean_nopqtl_beta
0.00554660571298945
percentage_pqtl
0.0984615384615385
percentage_nopqtl
0.901538461538462
cis and genome-wide metrics
Field
Value
Gene
SFRP1
test_n_genomewide
10538
sparsity_genomewide
325
pearson_coefficent_genomewide
0.282451216432203
SE_genomewide
0.00952073196290768
P_corr_genomewide
1.46037286486742e-185
R2_covariate_model_genomewide
0.0880805084166526
R2_full_model_genomewide
0.161801214757942
P_genomewide
0
P_full_genomewide
0
n_cis_pqtl
32
max_cis_pqtl
rs78272154
rank_max_cis_pqtl
1
mean_pqtl_beta
0.0149156065231644
mean_nopqtl_beta
0.00554660571298945
percentage_pqtl
0.0984615384615385
percentage_nopqtl
0.901538461538462
test_n_cis
10538
sparsity_cis
32
pearson_coefficent_cis
0.215614691445904
SE_cis
0.00969140830225806
P_corr_cis
4.16664765050897e-107
R2_covariate_model_cis
0.0880805084166525
R2_full_model_cis
0.132700036770045
P_cis
1.11253694102507e-308
P_full_cis
0