RARRES1
Olink Explore plasma protein · SNPBoost PRS model
R2 Full Model
0.1104
pearson_coefficent
0.3048
sparsity
136
n_cis_pqtl
20
max_cis_pqtl
rs78028437
Diagnostics
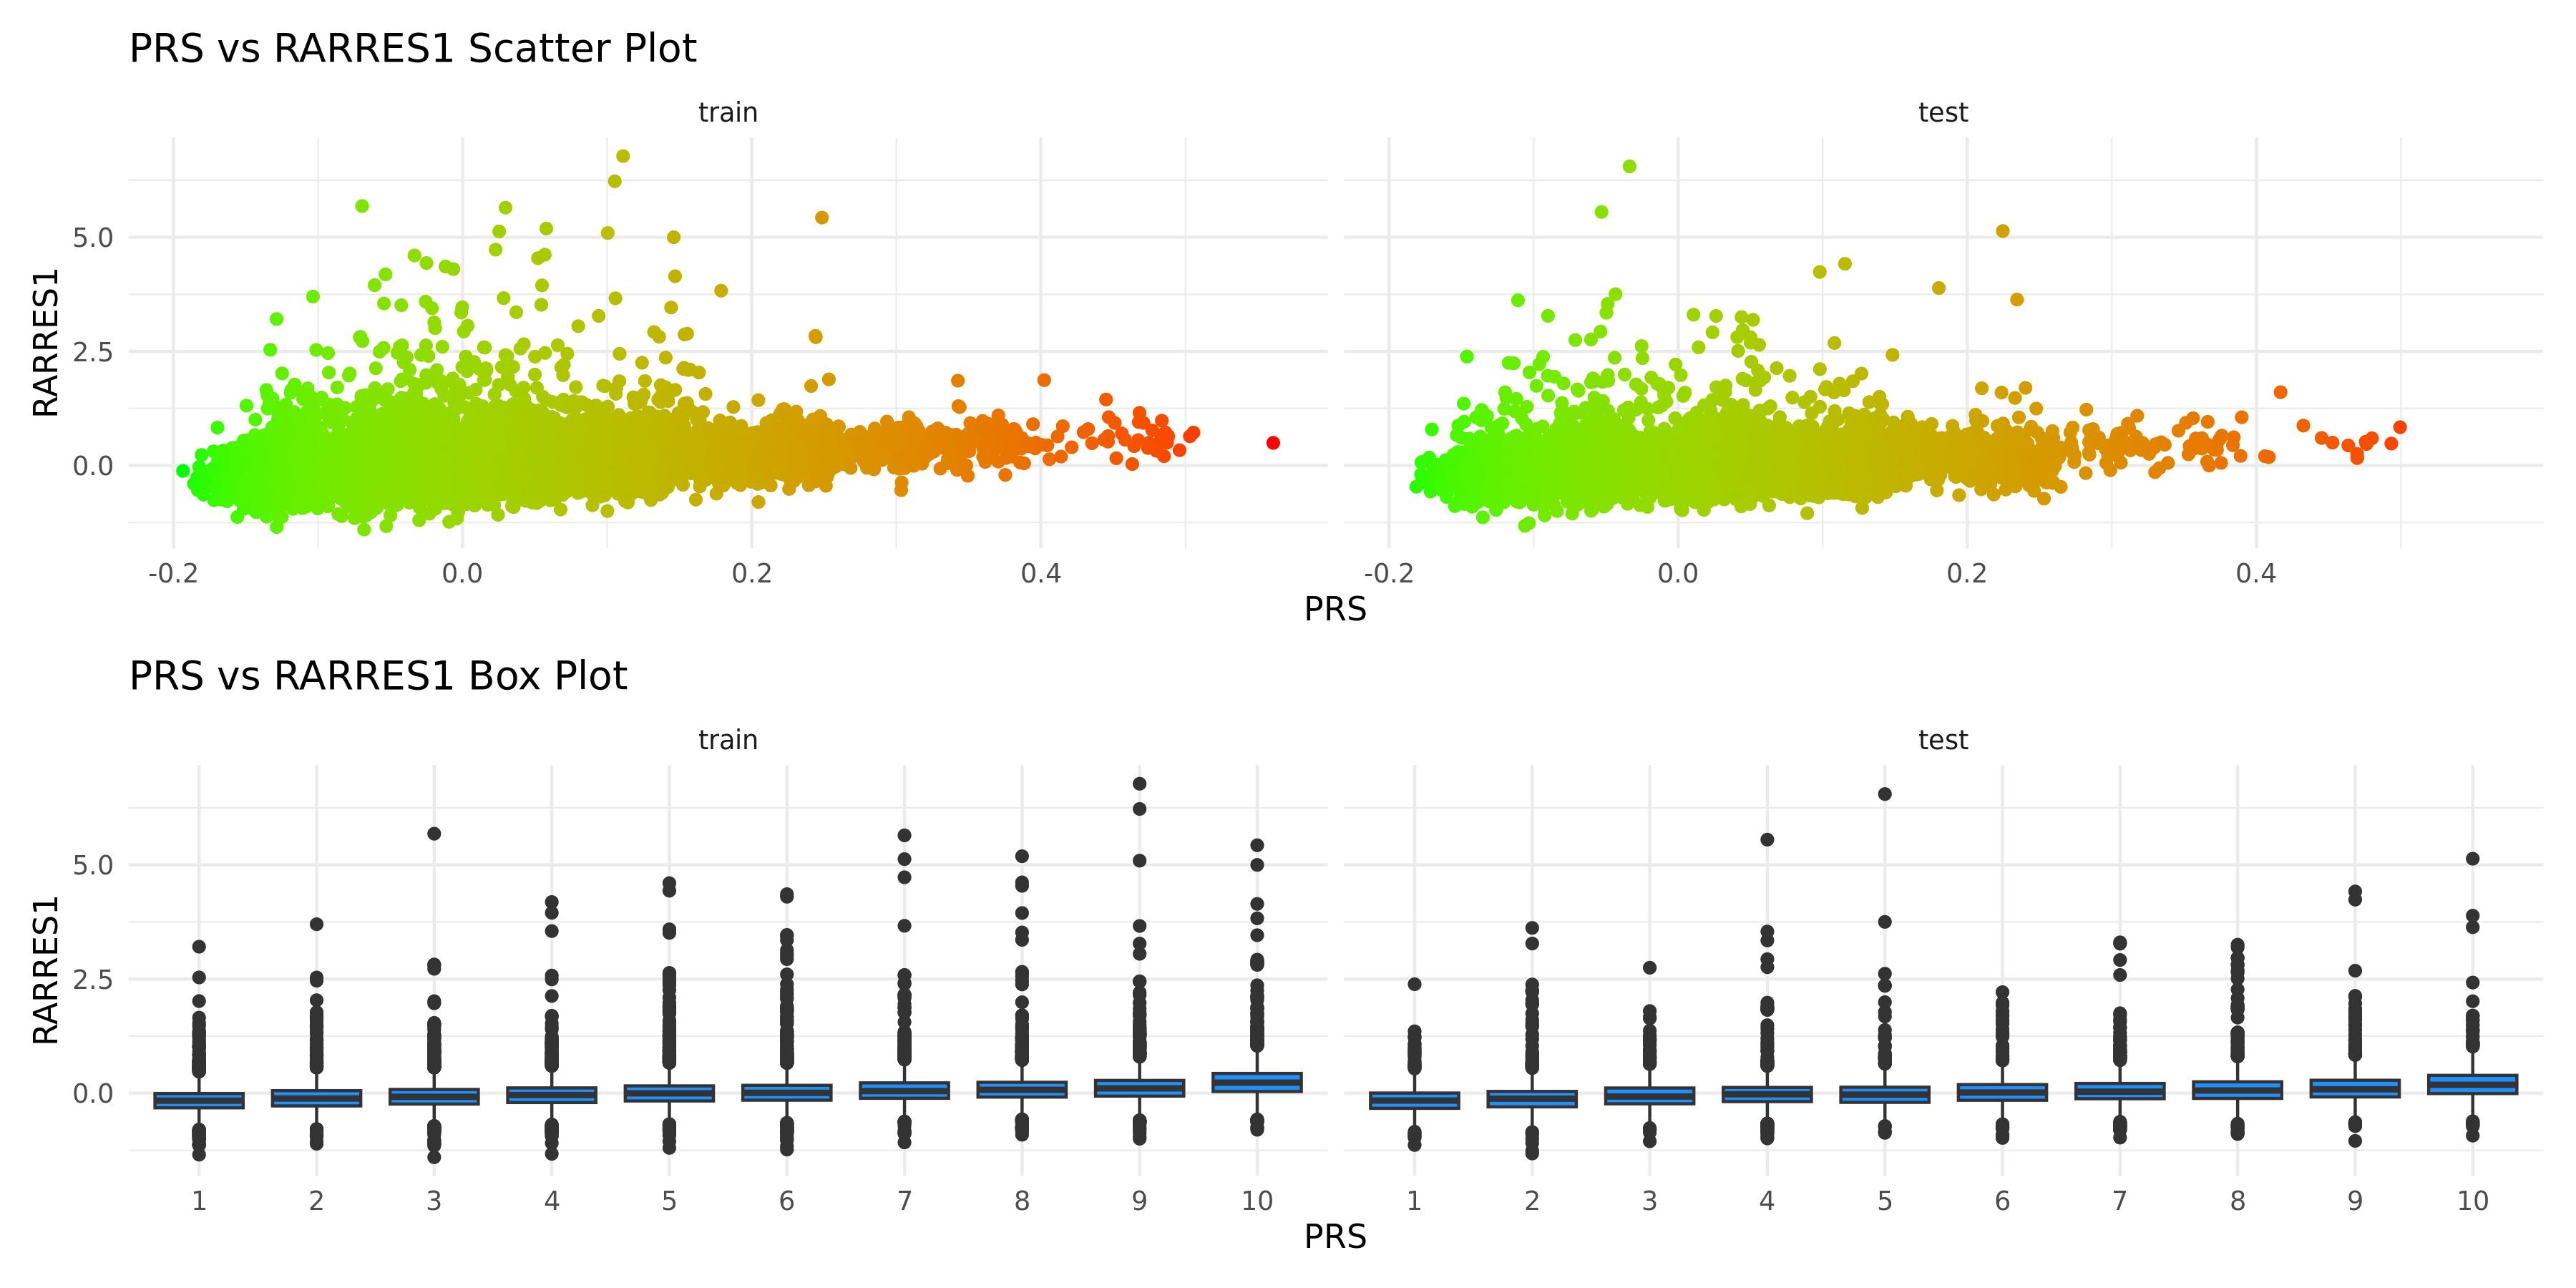
PRS scatter and box plotsenlarge ⤢
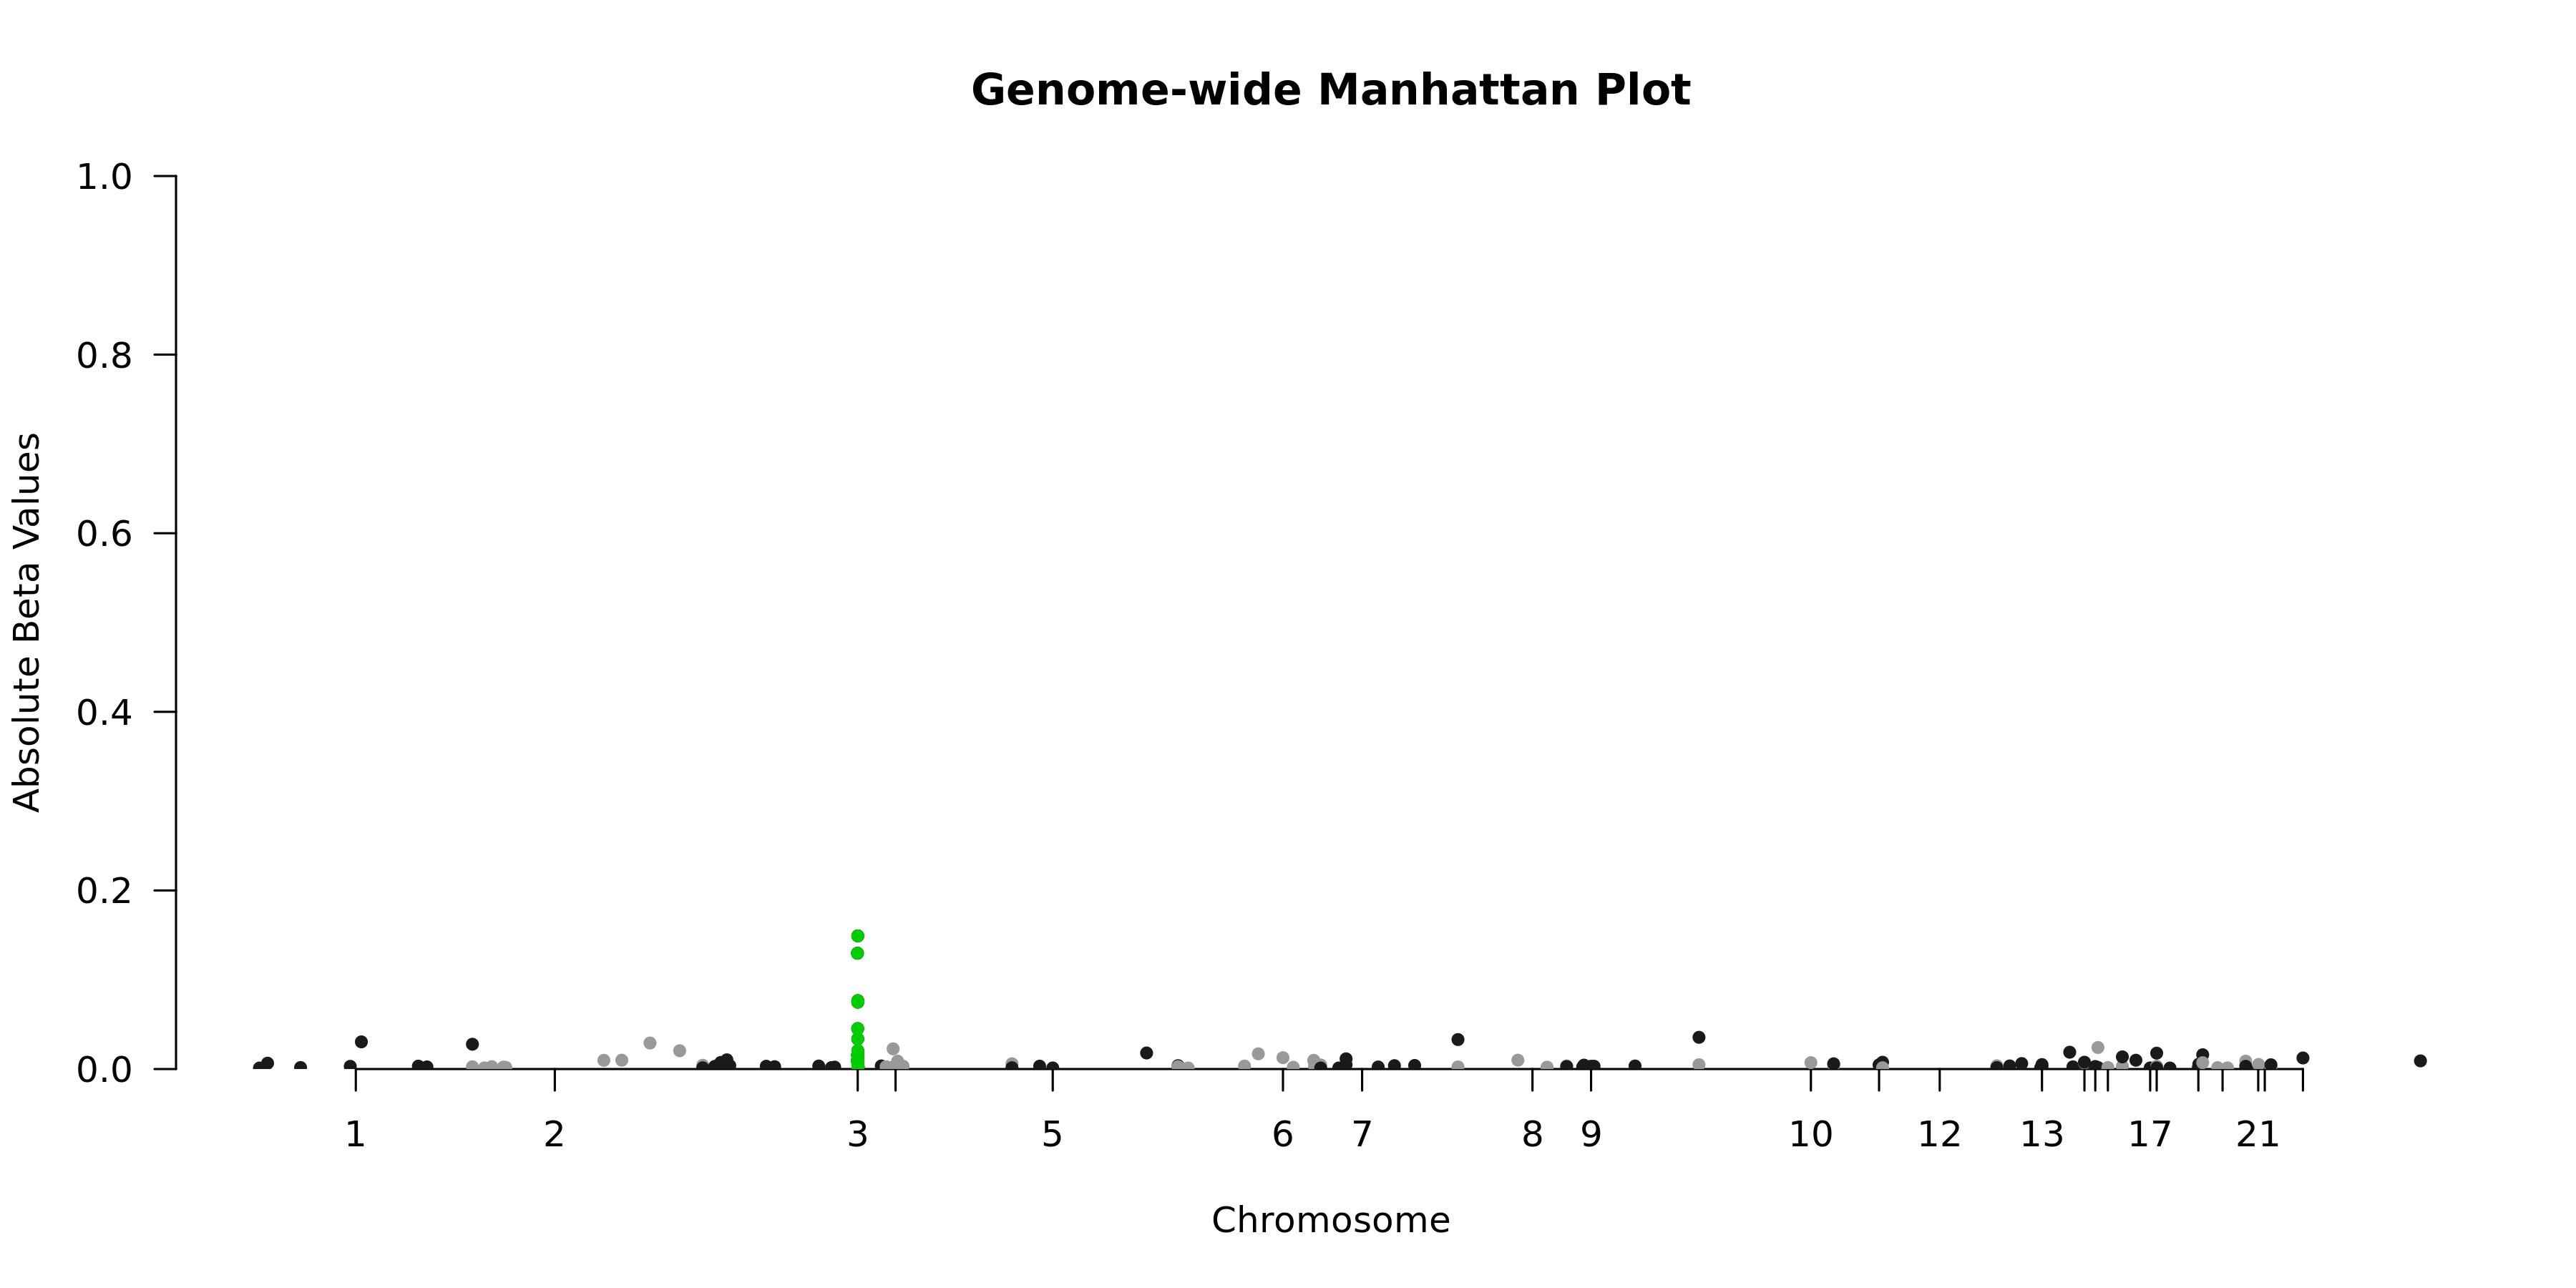
Genome-wide Manhattan Plotenlarge ⤢
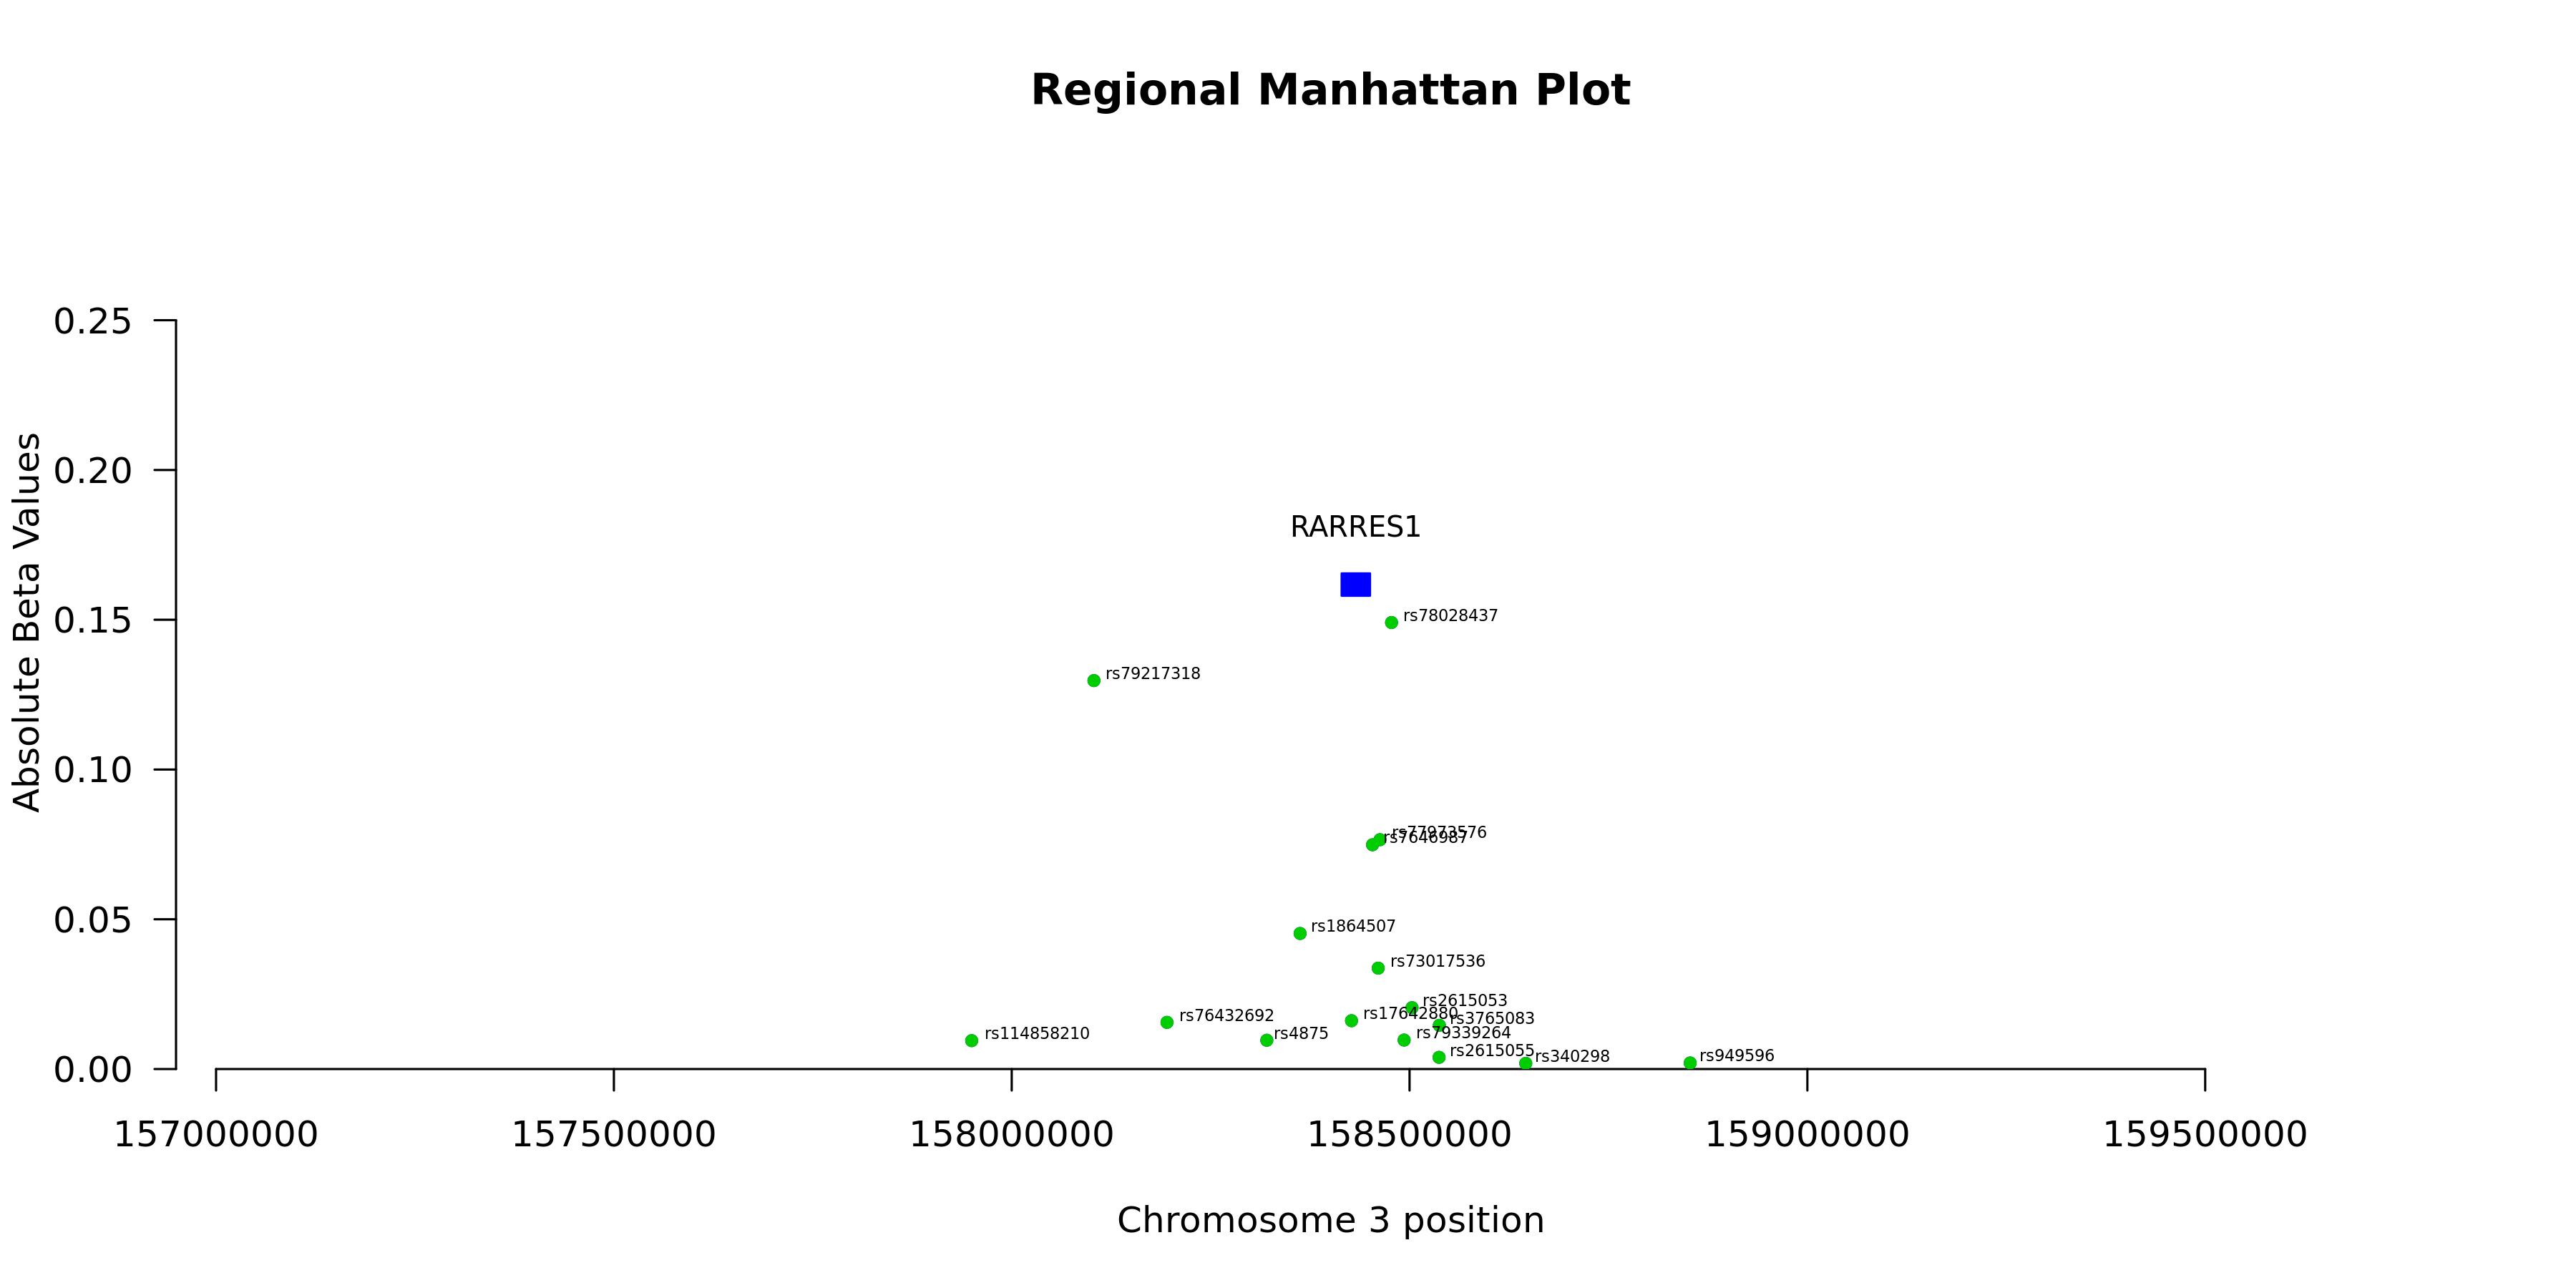
Regional Manhattan Plotenlarge ⤢
Model record
Field
Value
Gene
RARRES1
test_n
10538
sparsity
136
pearson_coefficent
0.304794491432611
SE
0.00952275311825043
P_corr
4.27083770204124e-214
R2 Covariate Model
0.0169
R2 Full Model
0.1104
P
3.23010303981064e-257
P_full
0
n_cis_pqtl
20
max_cis_pqtl
rs78028437
rank_max_cis_pqtl
1
mean_pqtl_beta
0.0309823408430426
mean_nopqtl_beta
0.00629426746743727
percentage_pqtl
0.147058823529412
percentage_nopqtl
0.852941176470588
cis and genome-wide metrics
Field
Value
Gene
RARRES1
test_n_genomewide
10538
sparsity_genomewide
136
pearson_coefficent_genomewide
0.304794491432611
SE_genomewide
0.00952275311825043
P_corr_genomewide
4.27083770204124e-214
R2_covariate_model_genomewide
0.0169263694403884
R2_full_model_genomewide
0.110419689755815
P_genomewide
3.23010303981064e-257
P_full_genomewide
0
n_cis_pqtl
20
max_cis_pqtl
rs78028437
rank_max_cis_pqtl
1
mean_pqtl_beta
0.0309823408430426
mean_nopqtl_beta
0.00629426746743727
percentage_pqtl
0.147058823529412
percentage_nopqtl
0.852941176470588
test_n_cis
10538
sparsity_cis
20
pearson_coefficent_cis
0.2893542164023
SE_cis
0.00957078543092946
P_corr_cis
3.23698615915843e-192
R2_covariate_model_cis
0.0169263694403883
R2_full_model_cis
0.101369734533618
P_cis
3.61092659395009e-235
P_full_cis
0