PRG2
Olink Explore plasma protein · SNPBoost PRS model
R2 Full Model
0.2365
pearson_coefficent
0.4502
sparsity
1280
n_cis_pqtl
34
max_cis_pqtl
rs149828052
Diagnostics
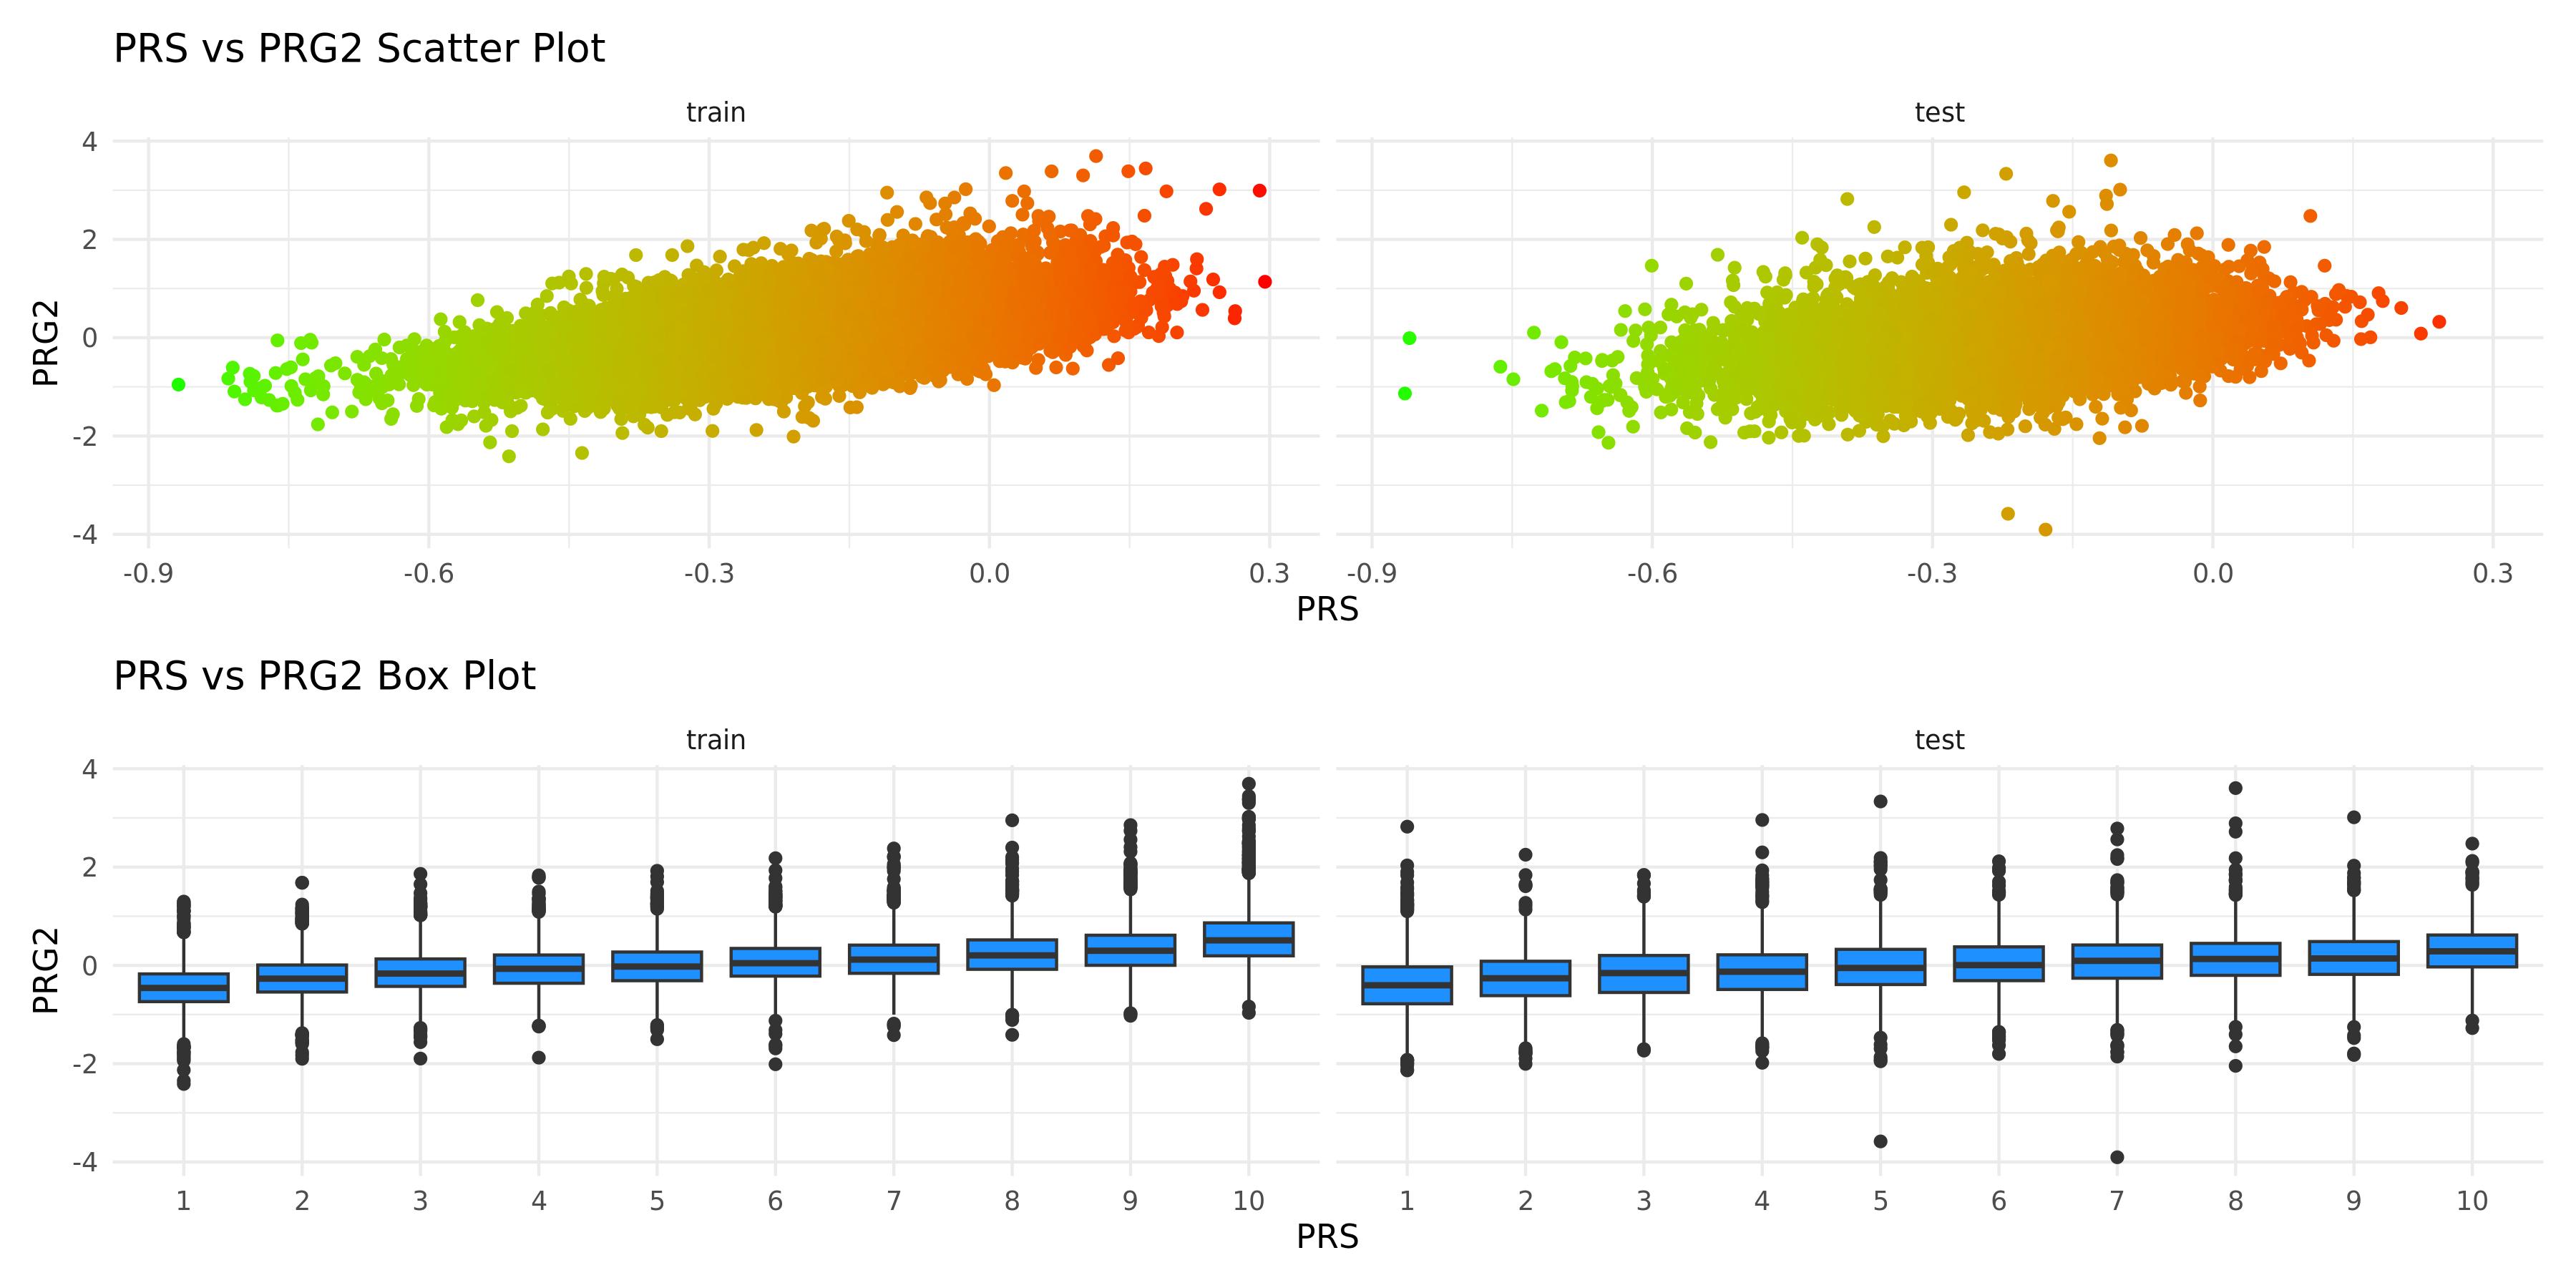
PRS scatter and box plotsenlarge ⤢
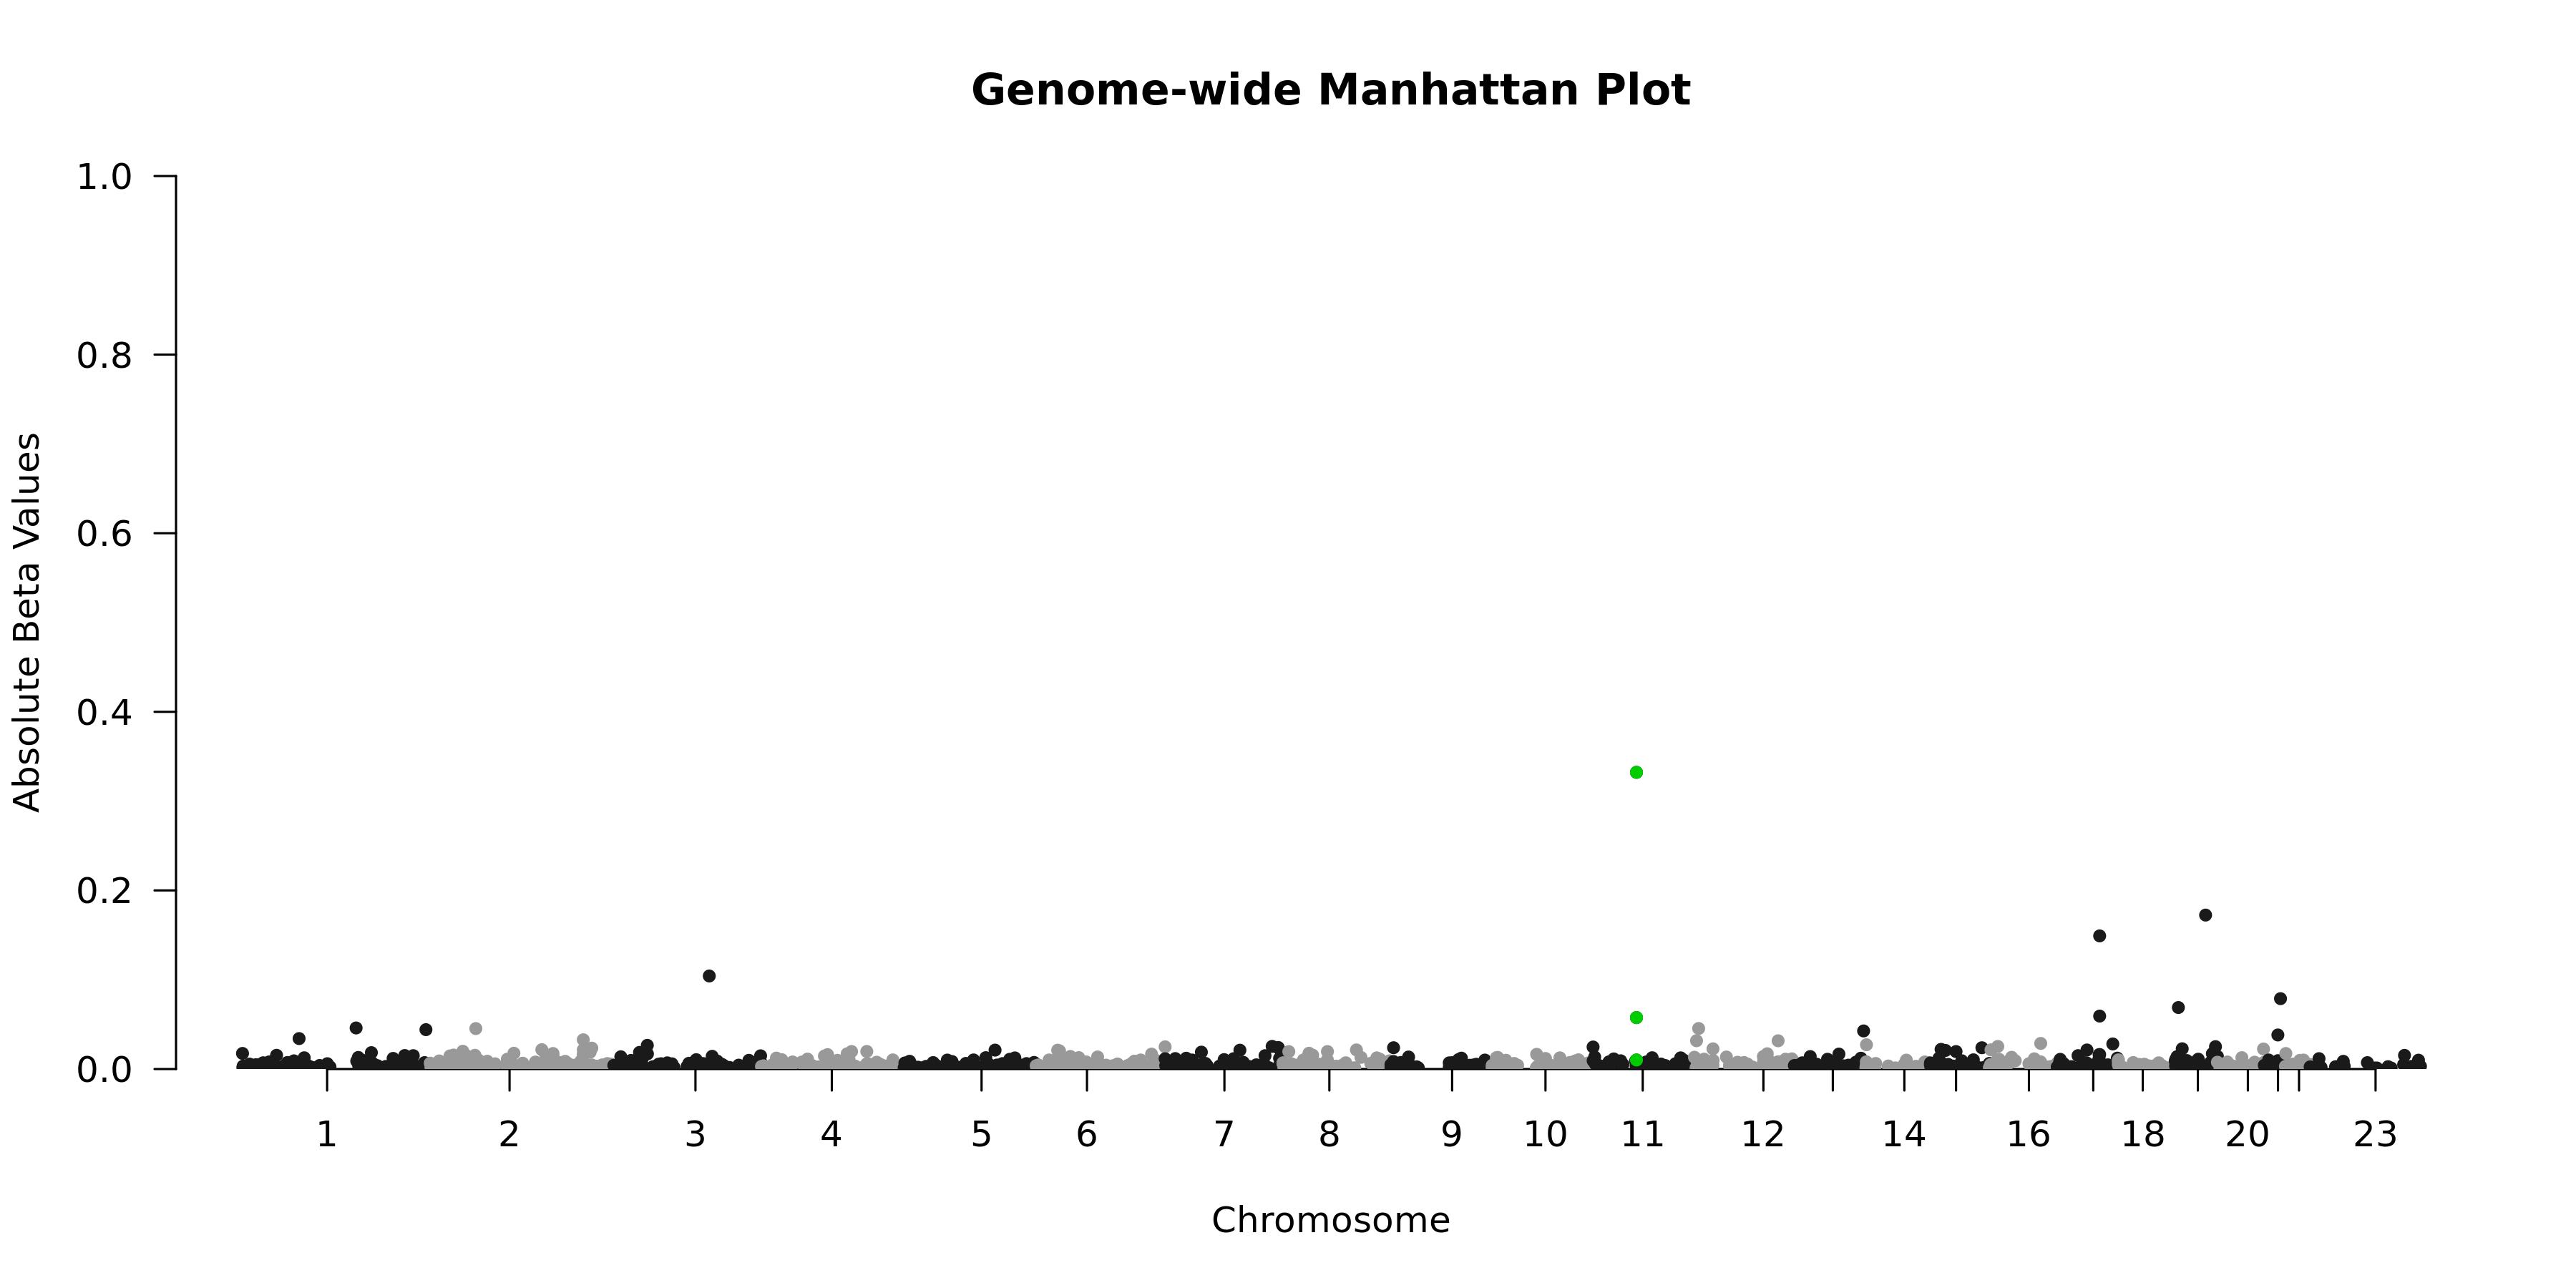
Genome-wide Manhattan Plotenlarge ⤢
Regional Manhattan Plotenlarge ⤢

Model record
Field
Value
Gene
PRG2
test_n
10538
sparsity
1280
pearson_coefficent
0.450234516558418
SE
0.00959342525697035
P_corr
0
R2 Covariate Model
0.0547
R2 Full Model
0.2365
P
0
P_full
0
n_cis_pqtl
34
max_cis_pqtl
rs149828052
rank_max_cis_pqtl
1
mean_pqtl_beta
0.0157150127959328
mean_nopqtl_beta
0.00596988391765186
percentage_pqtl
0.0265625
percentage_nopqtl
0.9734375
cis and genome-wide metrics
Field
Value
Gene
PRG2
test_n_genomewide
10538
sparsity_genomewide
1280
pearson_coefficent_genomewide
0.450234516558418
SE_genomewide
0.00959342525697035
P_corr_genomewide
0
R2_covariate_model_genomewide
0.0547286497129425
R2_full_model_genomewide
0.236505642073246
P_genomewide
0
P_full_genomewide
0
n_cis_pqtl
34
max_cis_pqtl
rs149828052
rank_max_cis_pqtl
1
mean_pqtl_beta
0.0157150127959328
mean_nopqtl_beta
0.00596988391765186
percentage_pqtl
0.0265625
percentage_nopqtl
0.9734375
test_n_cis
10538
sparsity_cis
34
pearson_coefficent_cis
0.114237212172165
SE_cis
0.0106736605634068
P_corr_cis
1.44795391646209e-26
R2_covariate_model_cis
0.0547286497129425
R2_full_model_cis
0.0687700702200893
P_cis
3.78923919471104e-137
P_full_cis
3.1932307297941e-68