LEPR
Olink Explore plasma protein · SNPBoost PRS model
R2 Full Model
0.1429
pearson_coefficent
0.3191
sparsity
533
n_cis_pqtl
48
max_cis_pqtl
rs1621286
Diagnostics
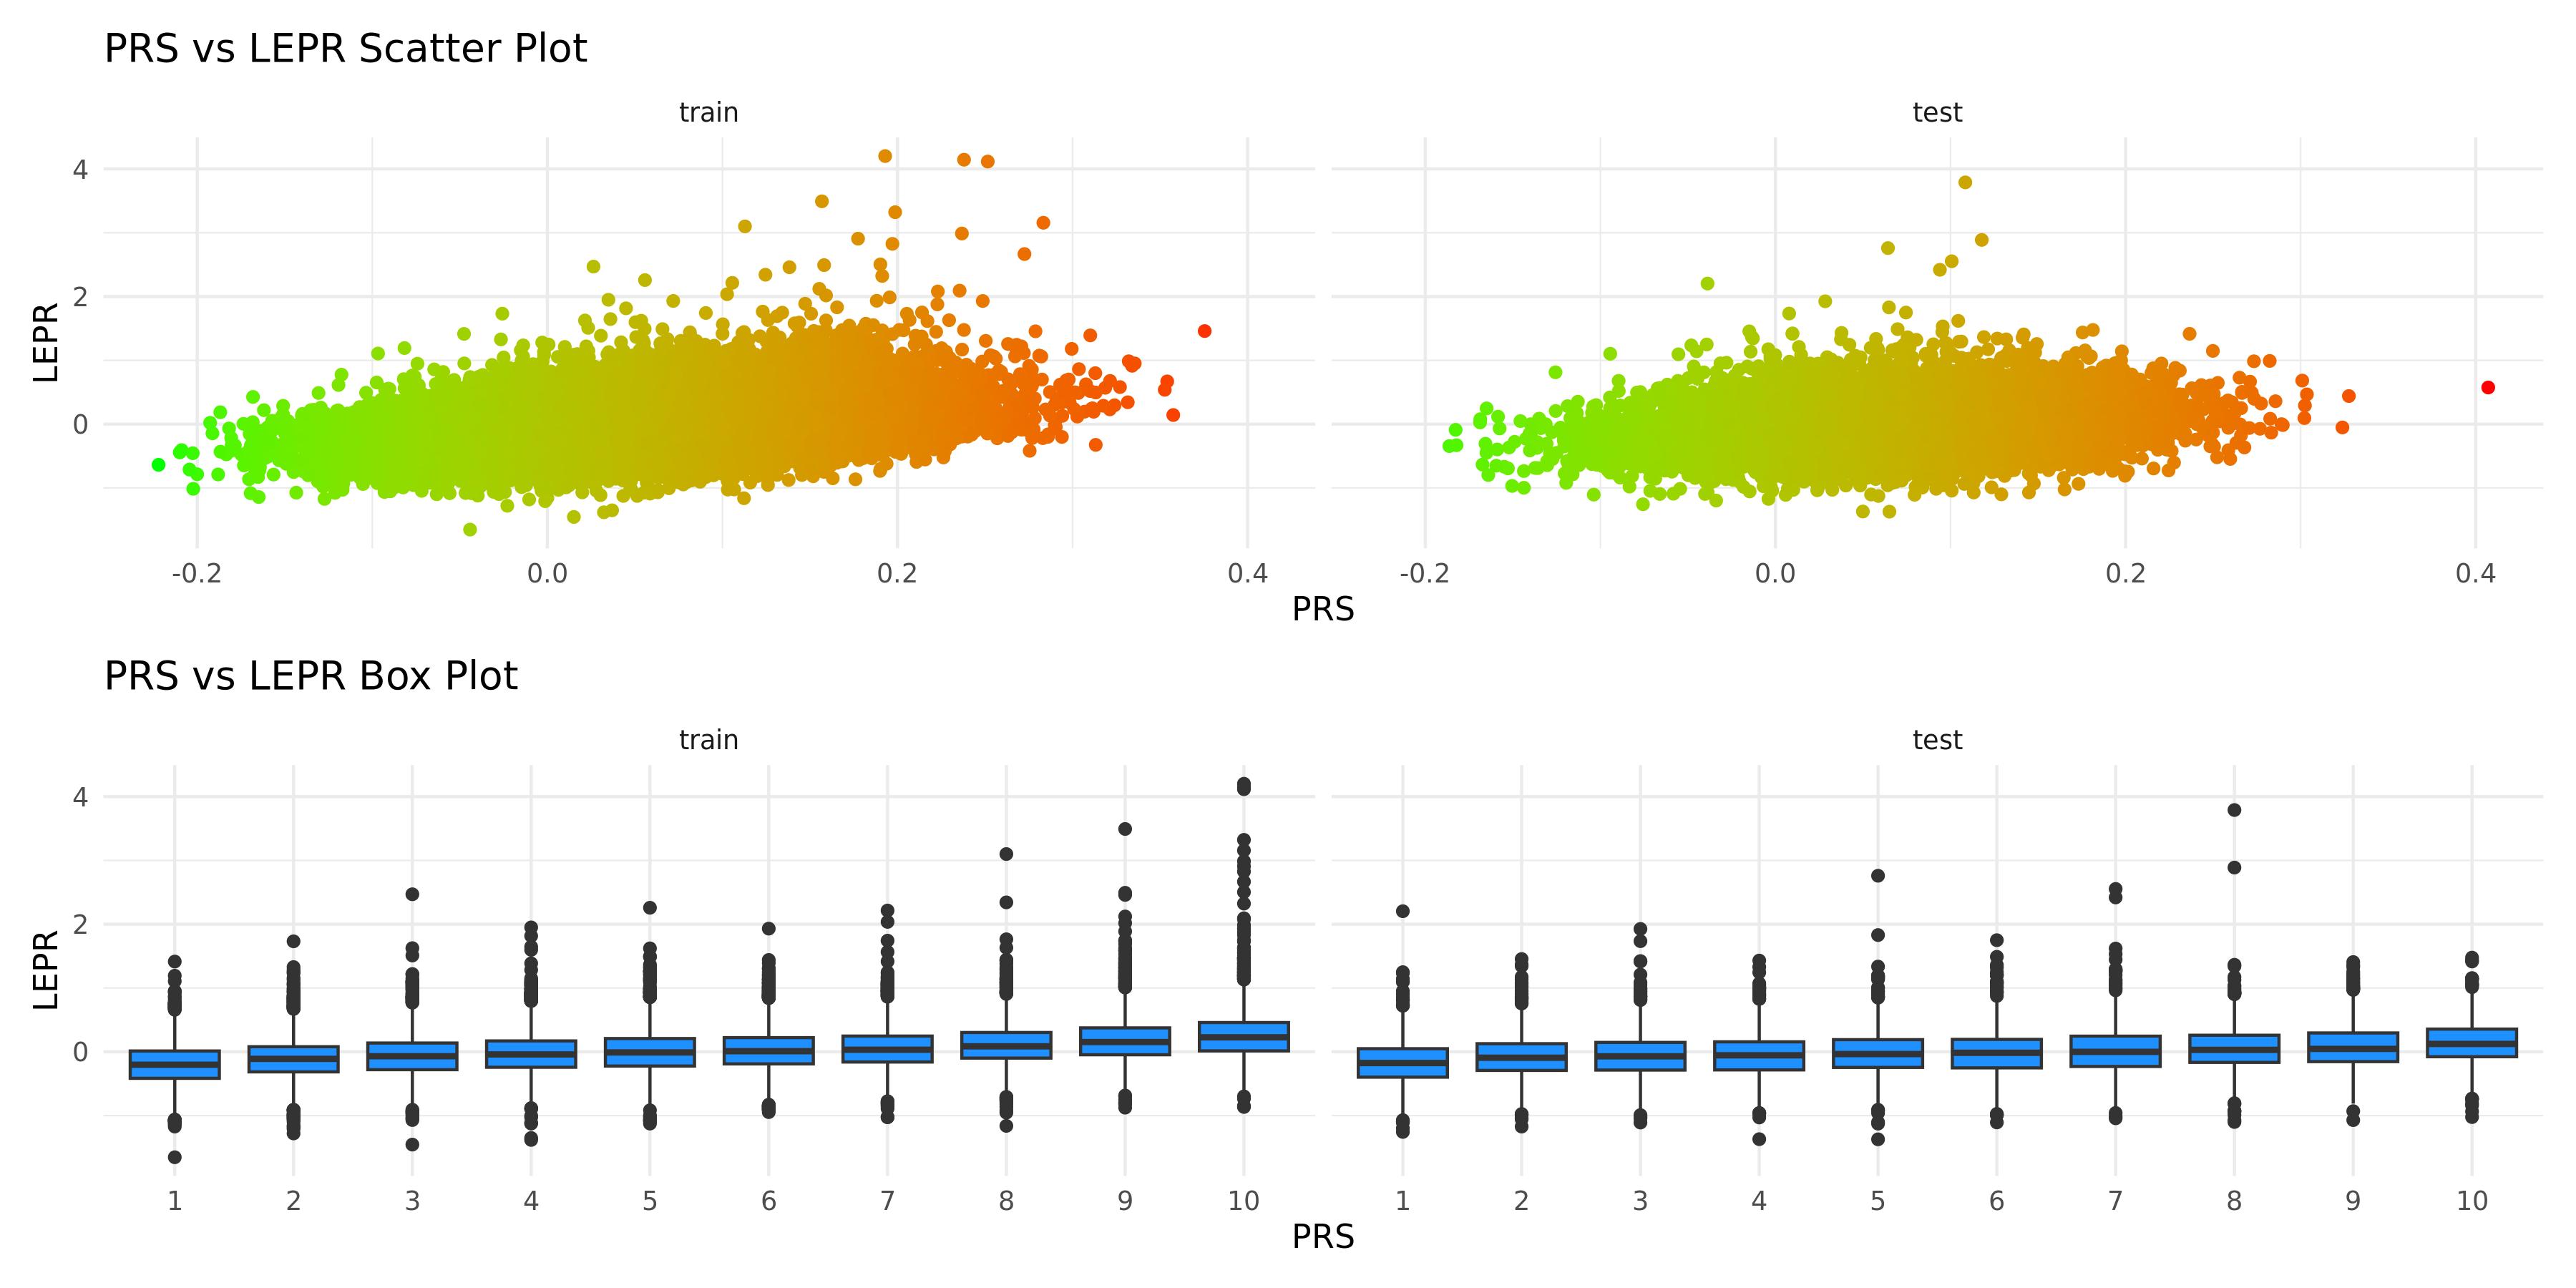
PRS scatter and box plotsenlarge ⤢
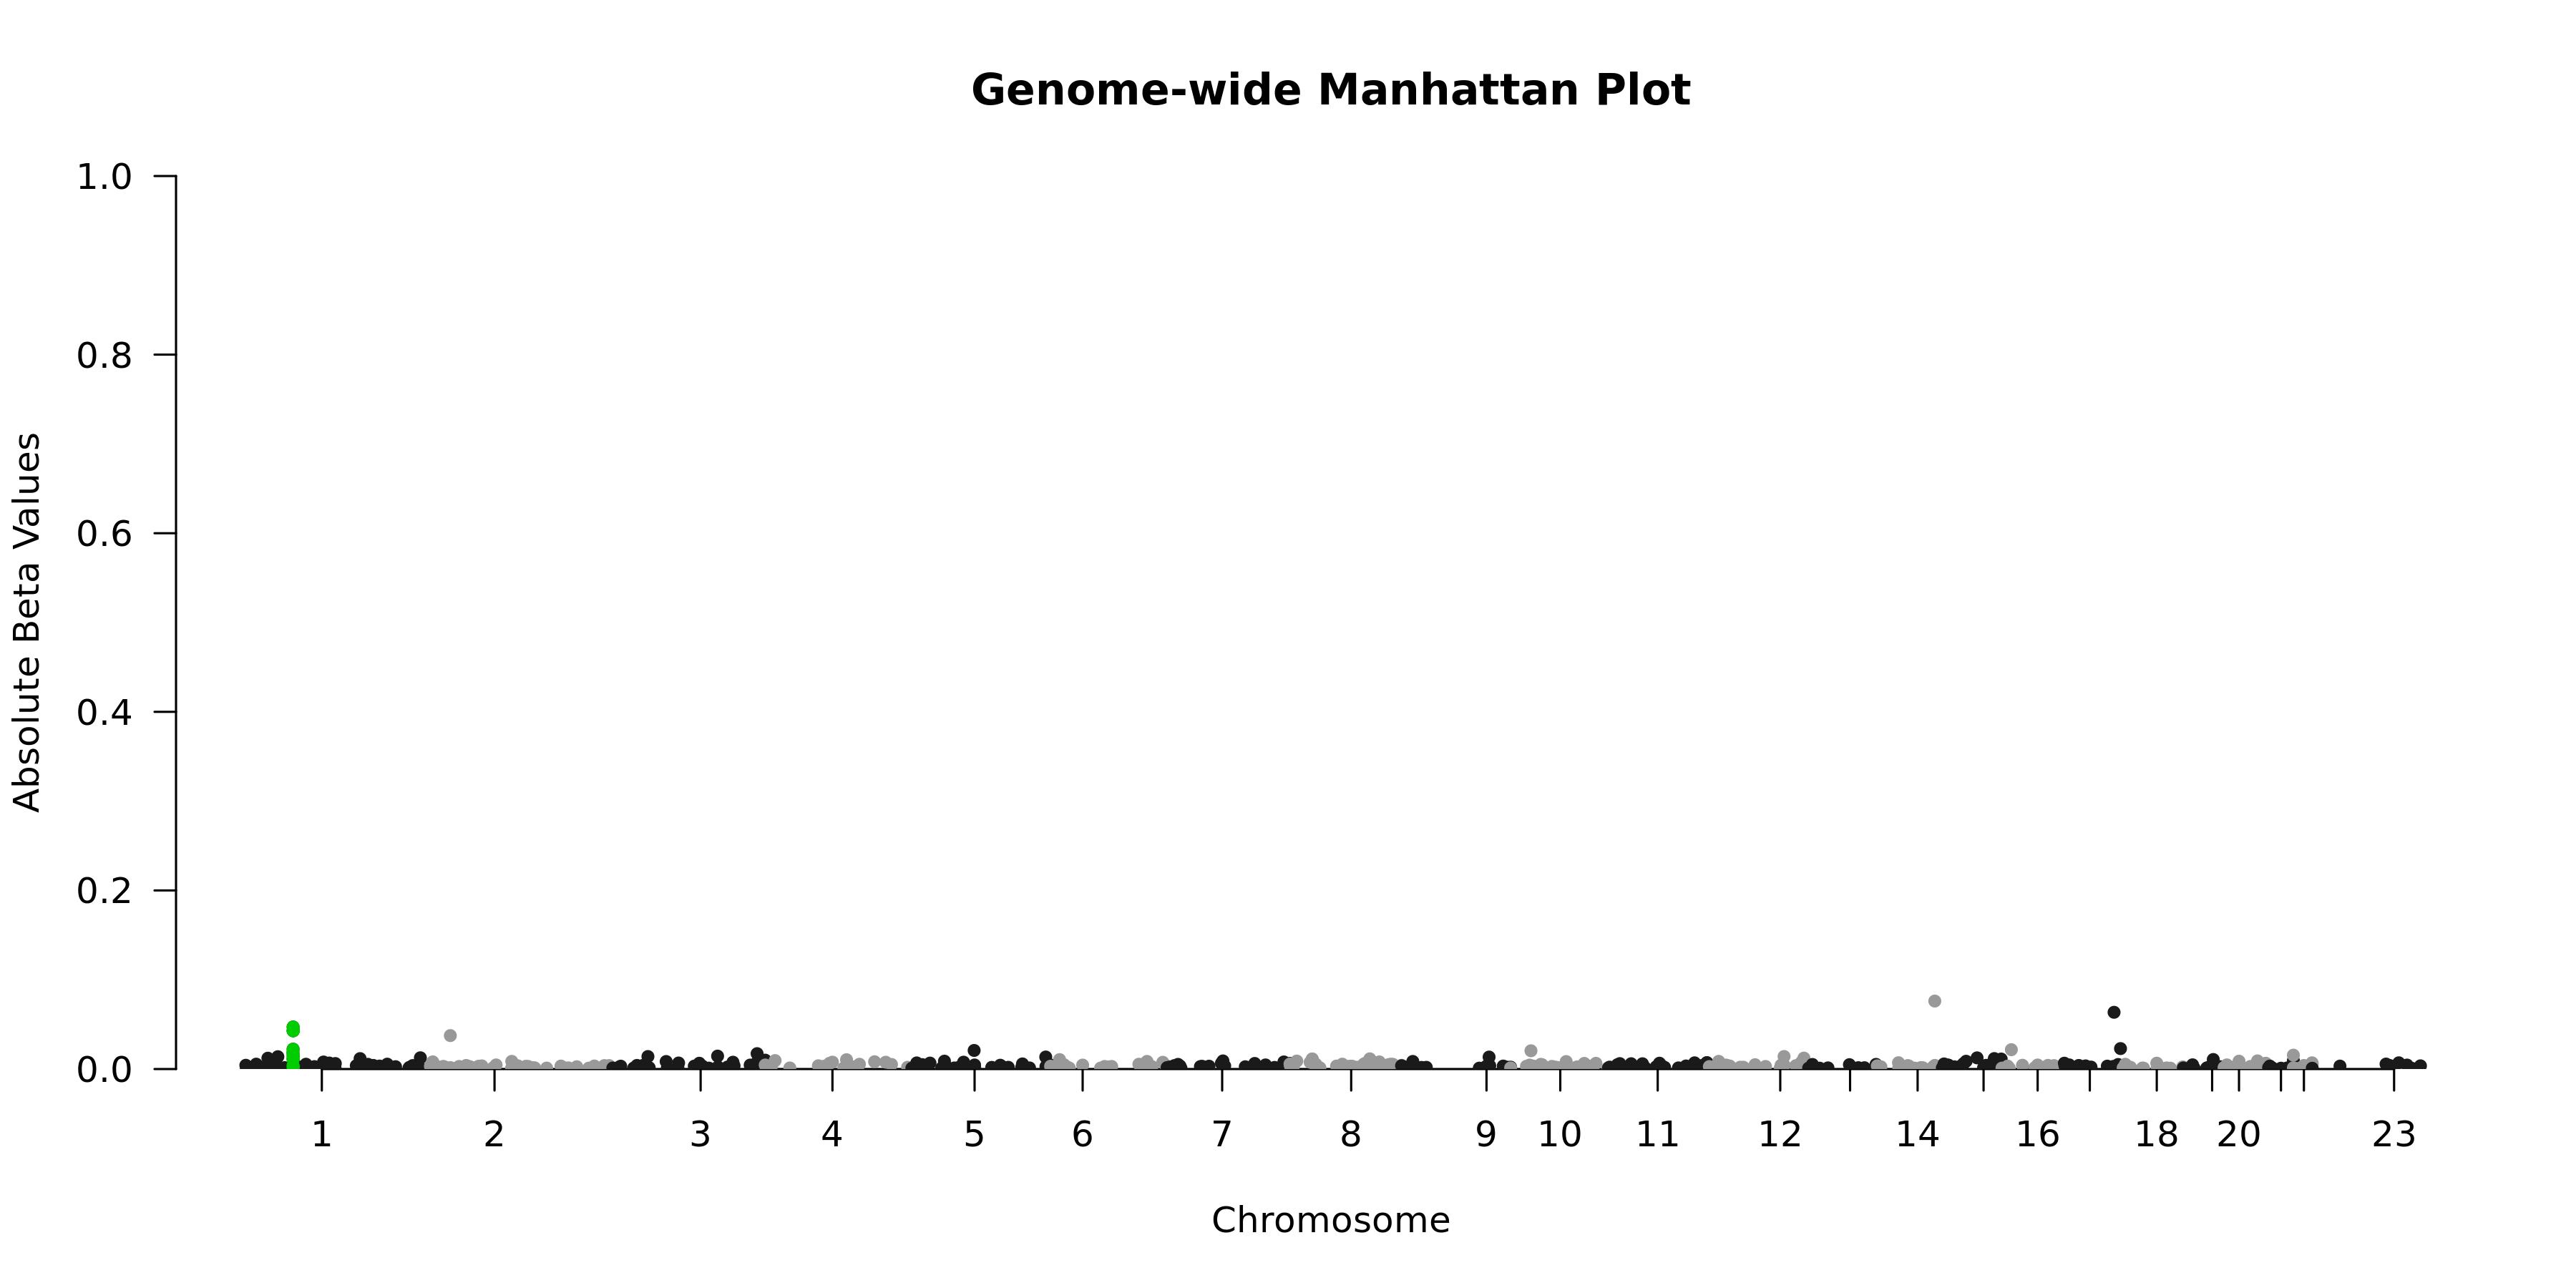
Genome-wide Manhattan Plotenlarge ⤢
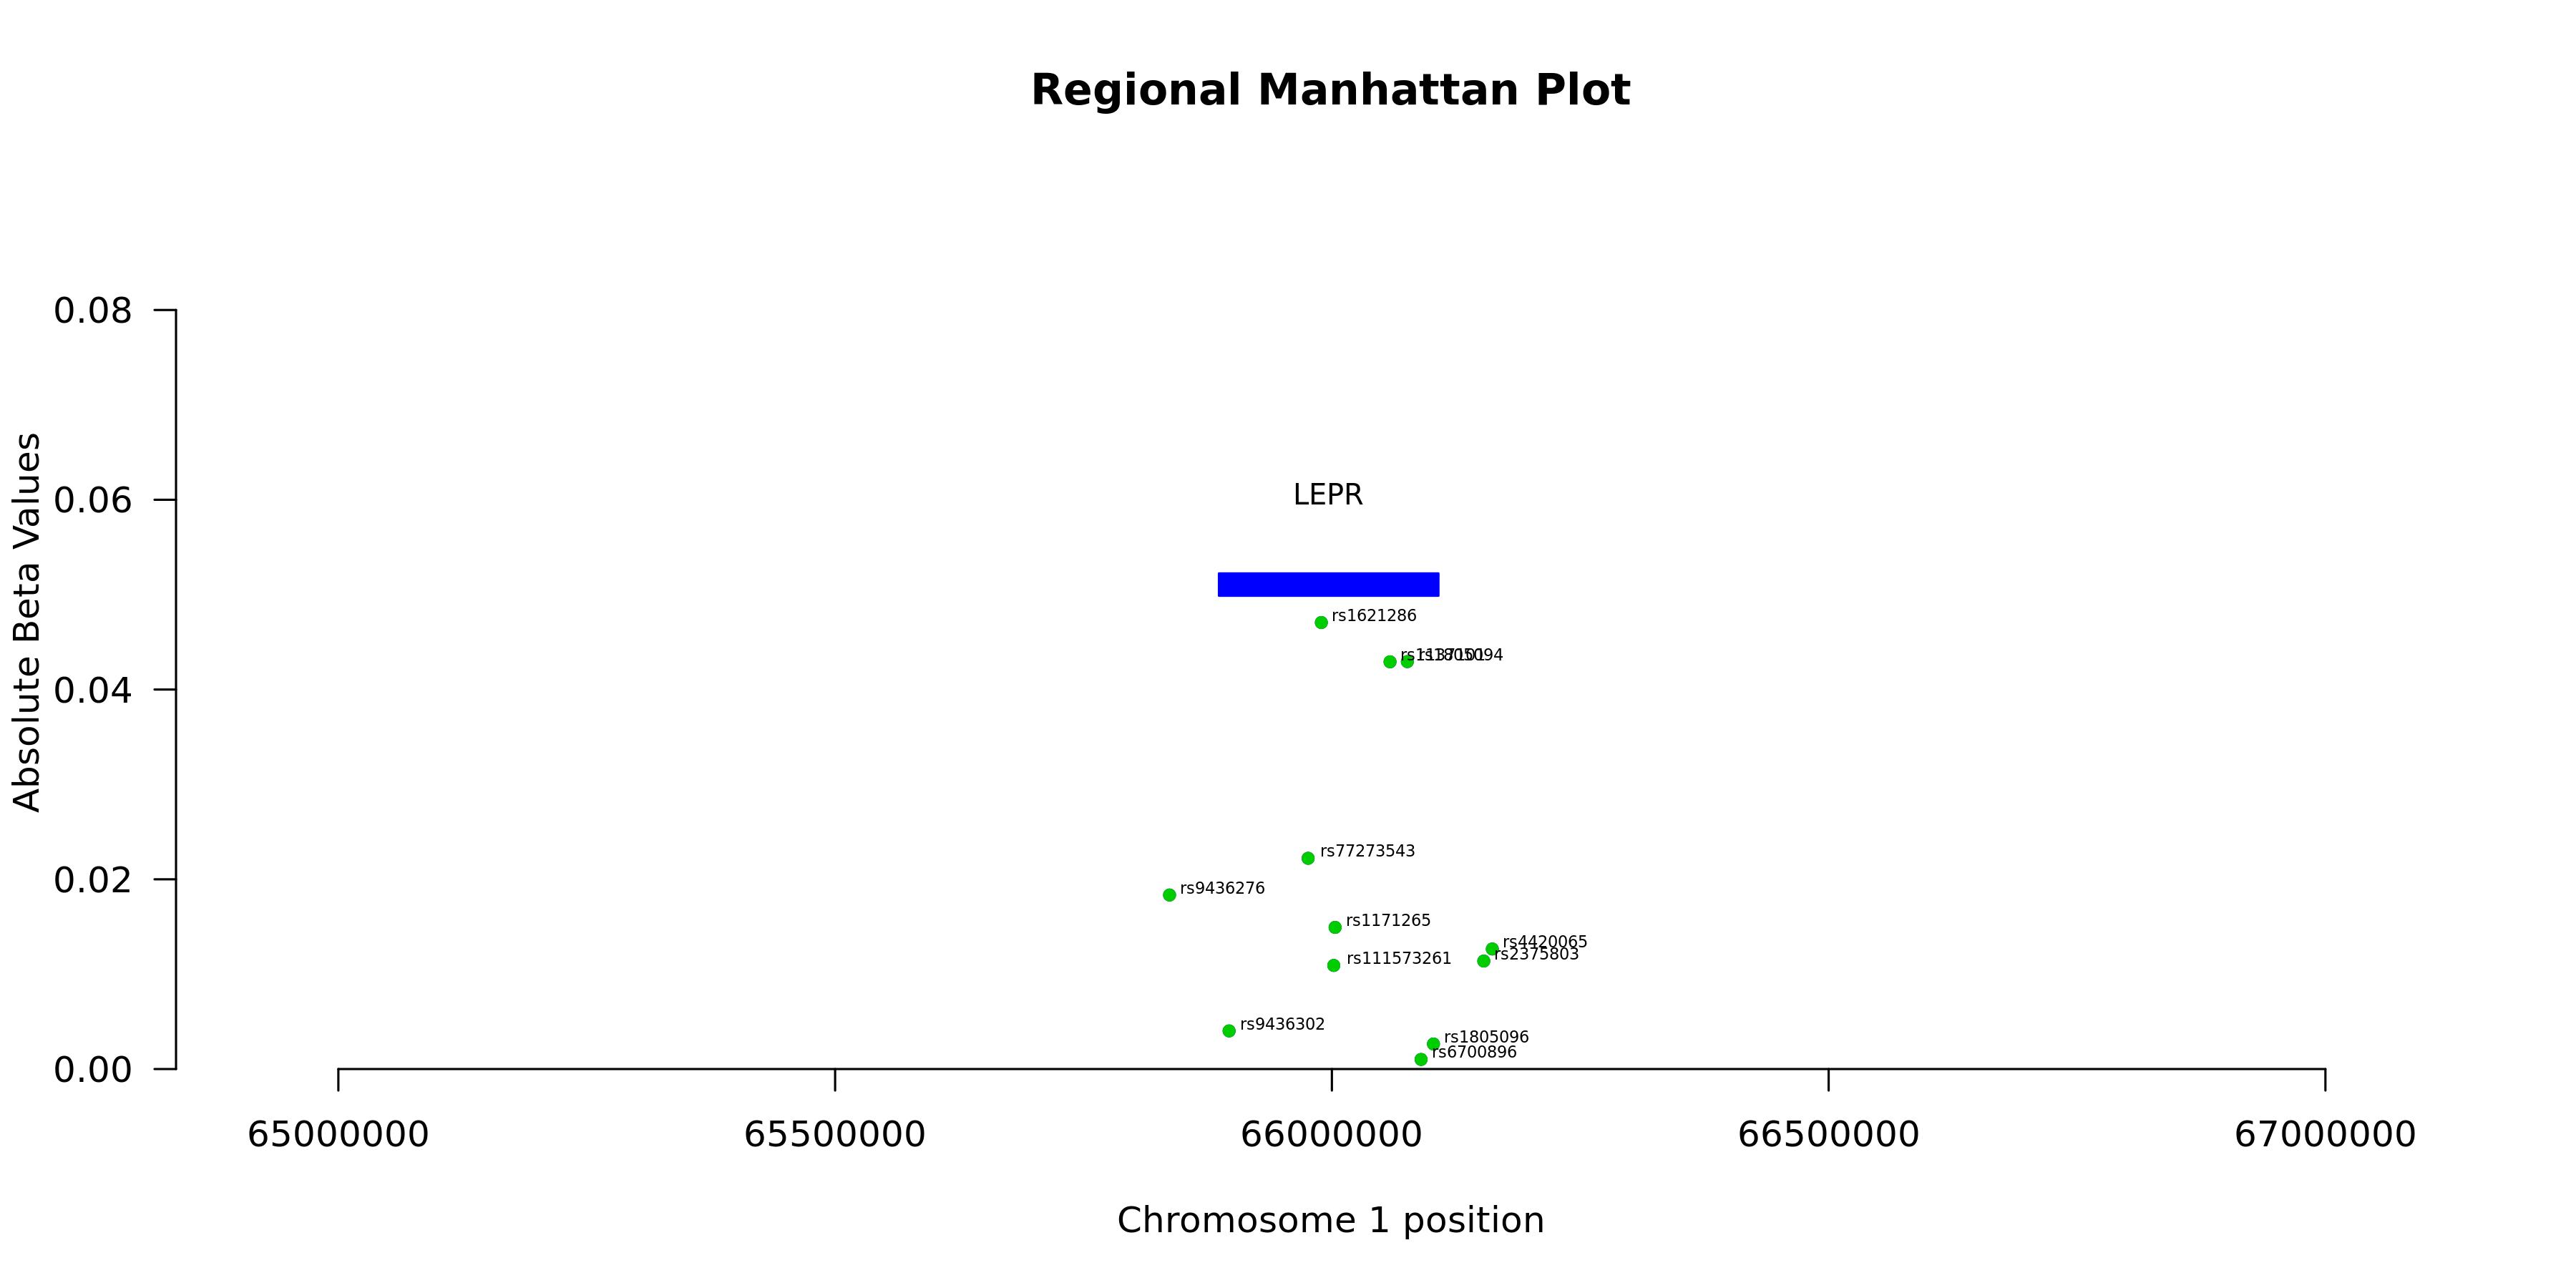
Regional Manhattan Plotenlarge ⤢
Model record
Field
Value
Gene
LEPR
test_n
10538
sparsity
533
pearson_coefficent
0.319080301399826
SE
0.00936464202913182
P_corr
3.85081133081251e-241
R2 Covariate Model
0.0398
R2 Full Model
0.1429
P
0
P_full
0
n_cis_pqtl
48
max_cis_pqtl
rs1621286
rank_max_cis_pqtl
3
mean_pqtl_beta
0.00759203987591789
mean_nopqtl_beta
0.00396227189391426
percentage_pqtl
0.0900562851782364
percentage_nopqtl
0.909943714821764
cis and genome-wide metrics
Field
Value
Gene
LEPR
test_n_genomewide
10538
sparsity_genomewide
533
pearson_coefficent_genomewide
0.319080301399826
SE_genomewide
0.00936464202913182
P_corr_genomewide
3.85081133081251e-241
R2_covariate_model_genomewide
0.0398208437819635
R2_full_model_genomewide
0.142872488308467
P_genomewide
0
P_full_genomewide
0
n_cis_pqtl
48
max_cis_pqtl
rs1621286
rank_max_cis_pqtl
3
mean_pqtl_beta
0.00759203987591789
mean_nopqtl_beta
0.00396227189391426
percentage_pqtl
0.0900562851782364
percentage_nopqtl
0.909943714821764
test_n_cis
10538
sparsity_cis
48
pearson_coefficent_cis
0.199193326784846
SE_cis
0.00968313657929683
P_corr_cis
3.57535005187288e-92
R2_covariate_model_cis
0.0398208437819635
R2_full_model_cis
0.0834419581707546
P_cis
7.4453271586474e-197
P_full_cis
1.82338330881593e-272