IL22
Olink Explore plasma protein · SNPBoost PRS model
R2 Full Model
0.0987
pearson_coefficent
0.1655
sparsity
108
n_cis_pqtl
6
max_cis_pqtl
rs1026789
Diagnostics
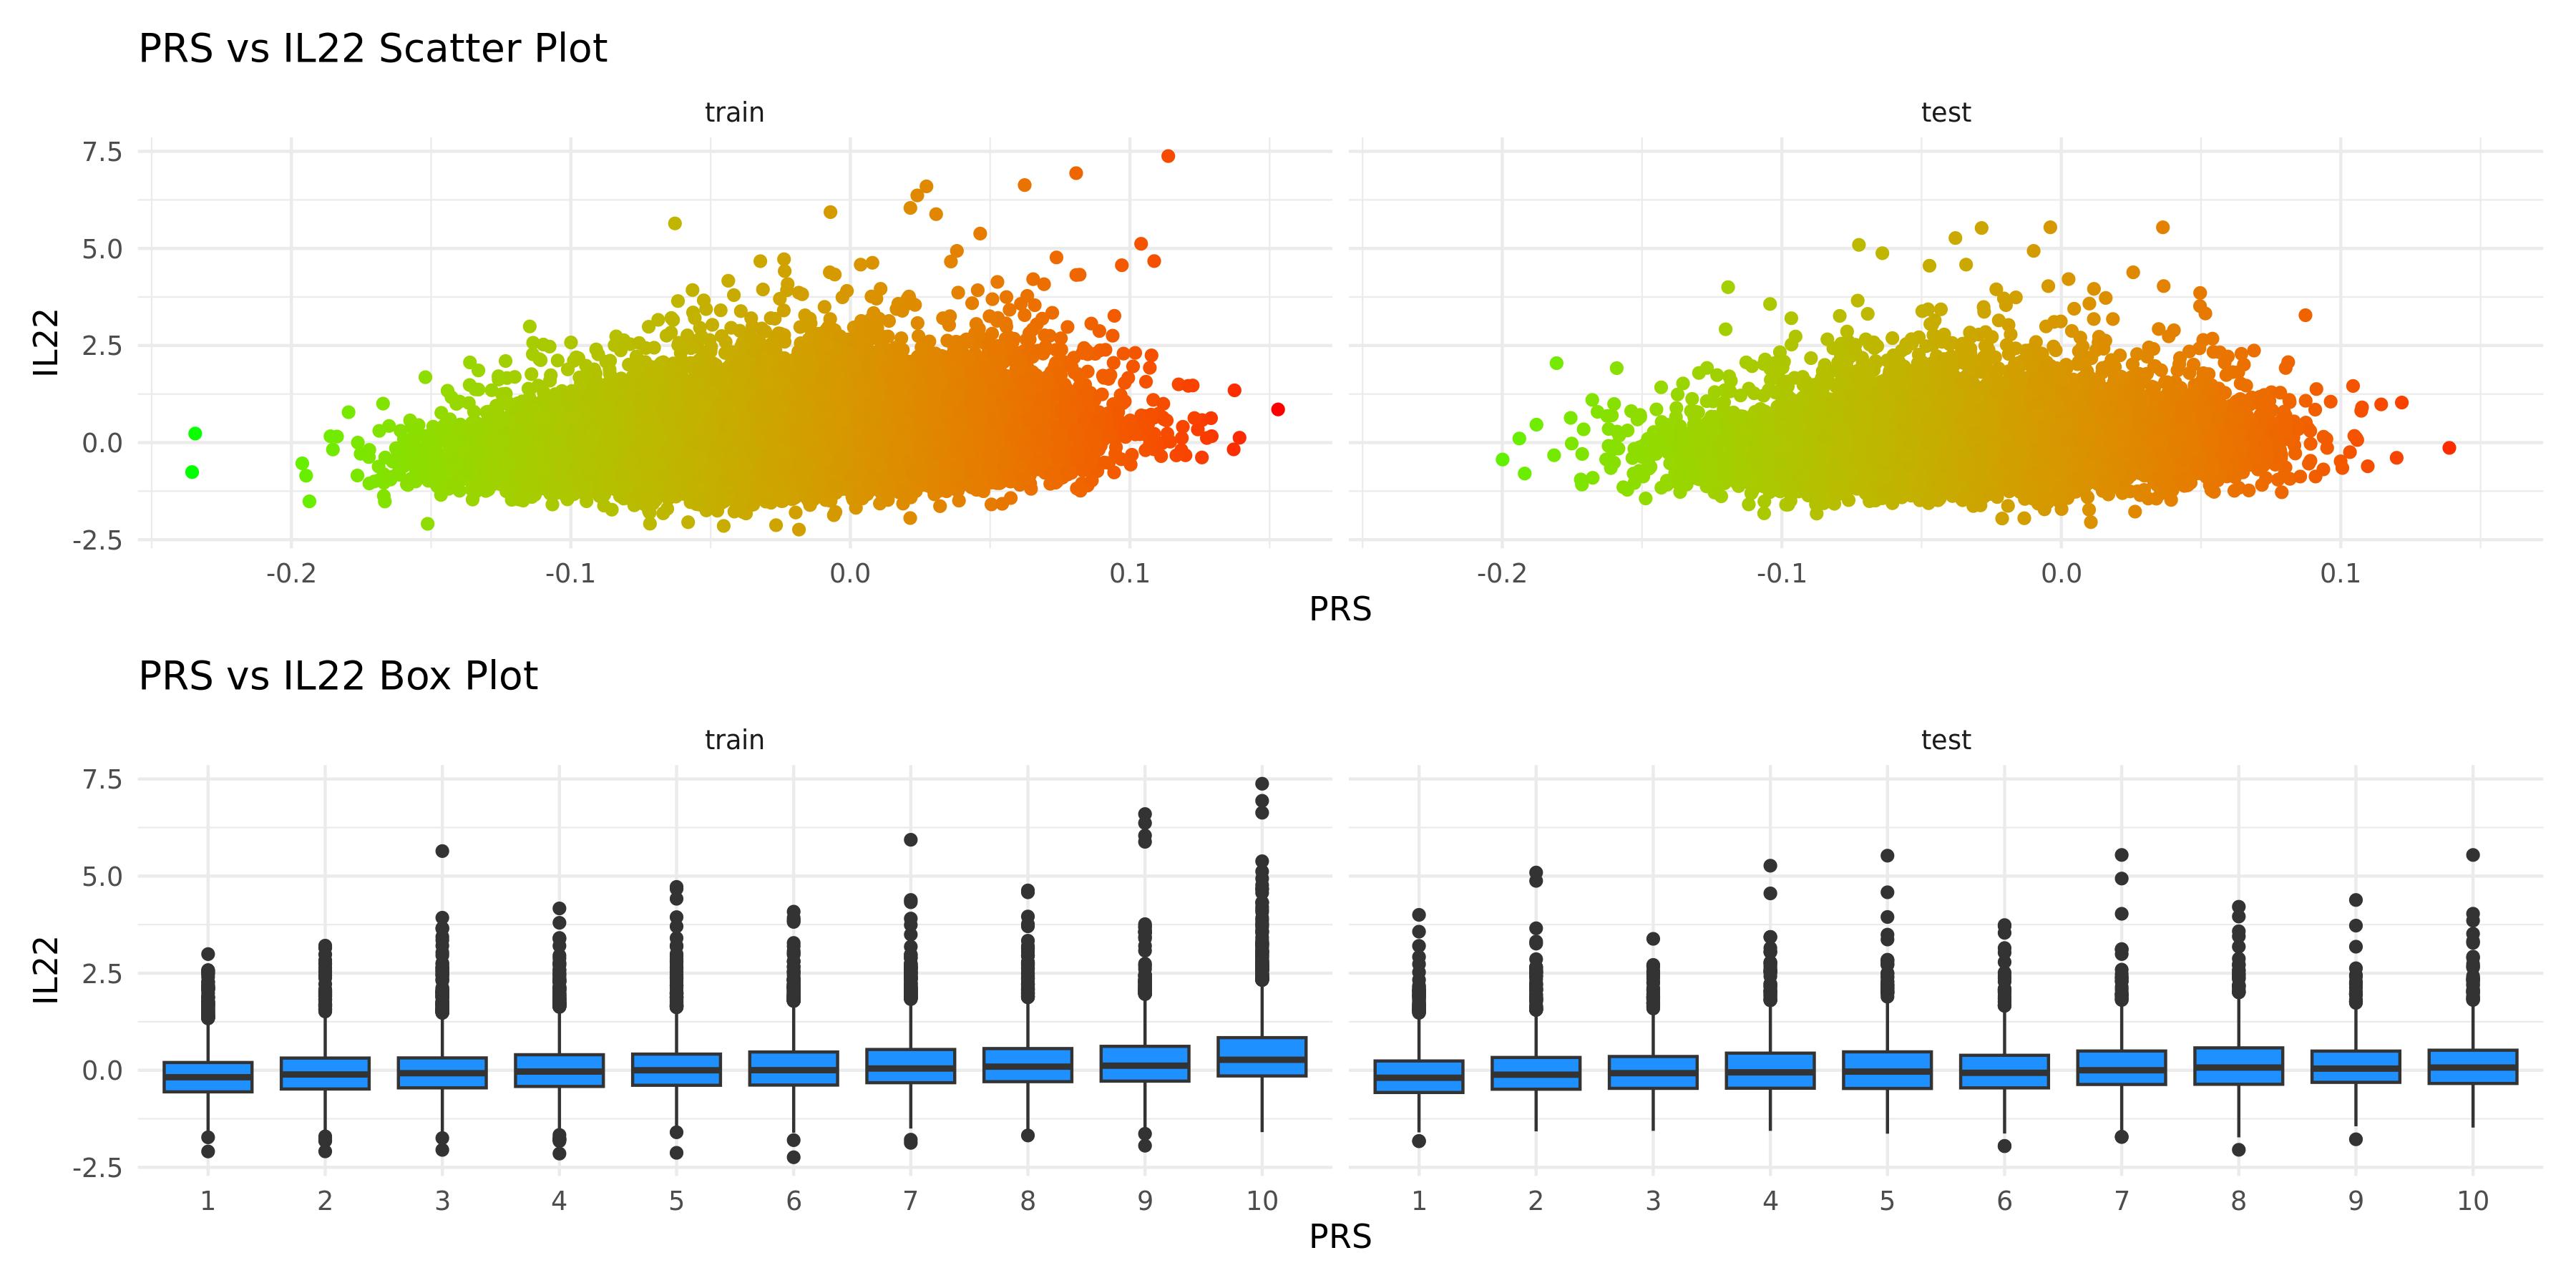
PRS scatter and box plotsenlarge ⤢
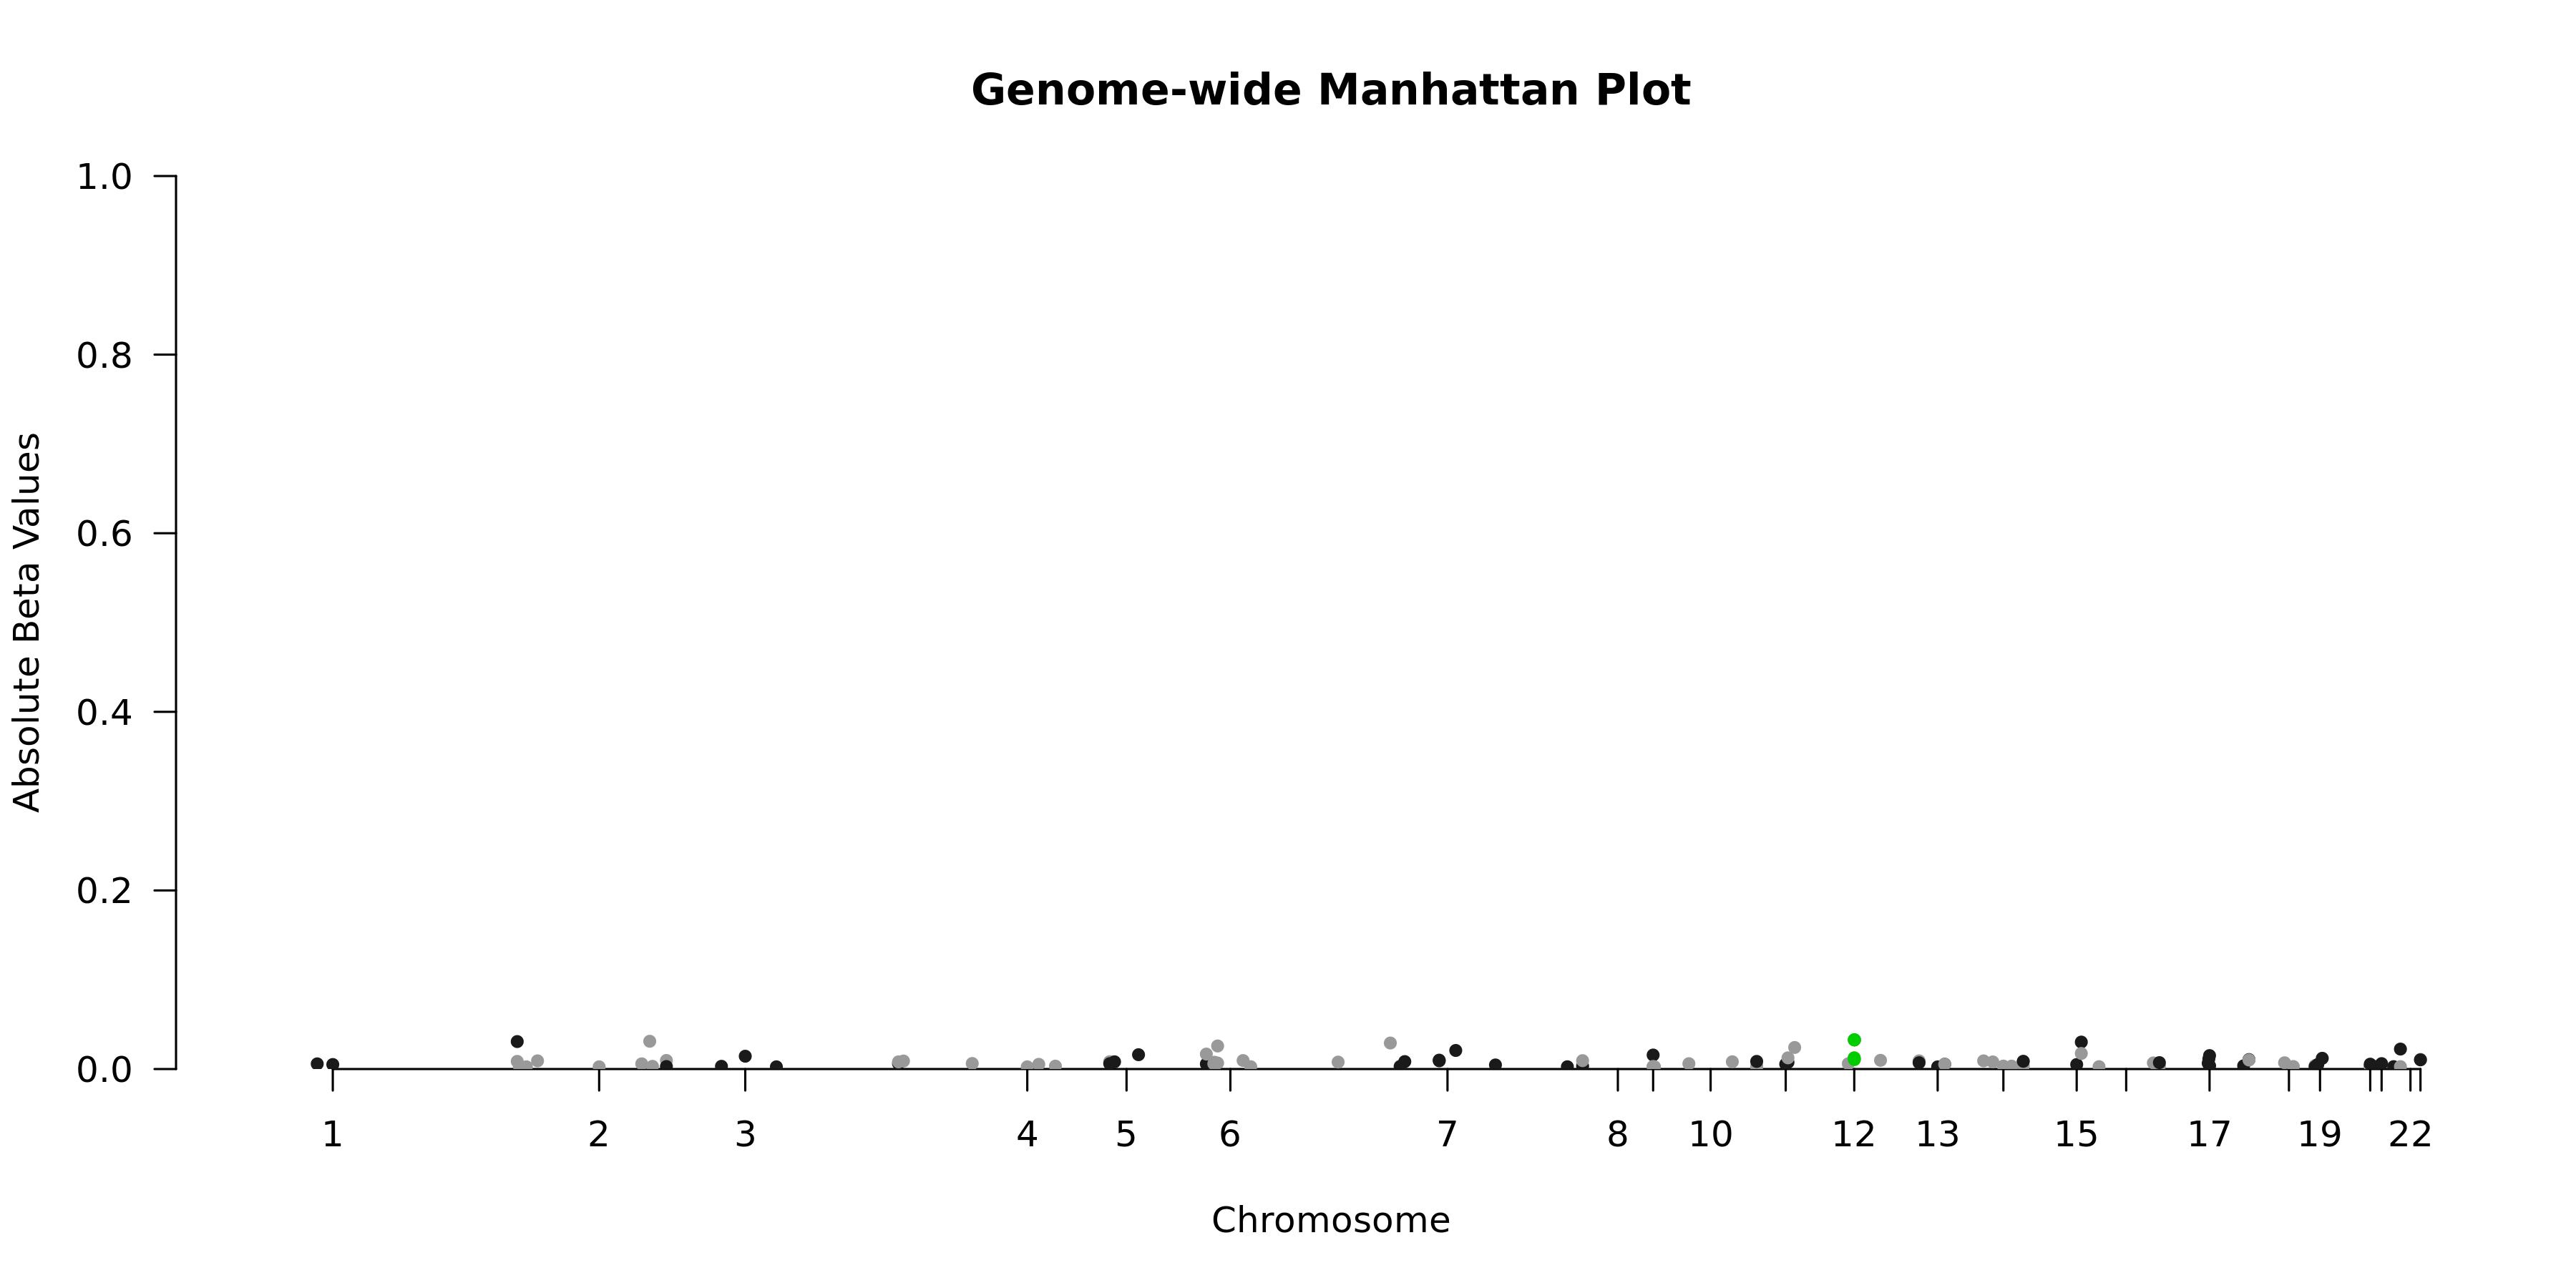
Genome-wide Manhattan Plotenlarge ⤢
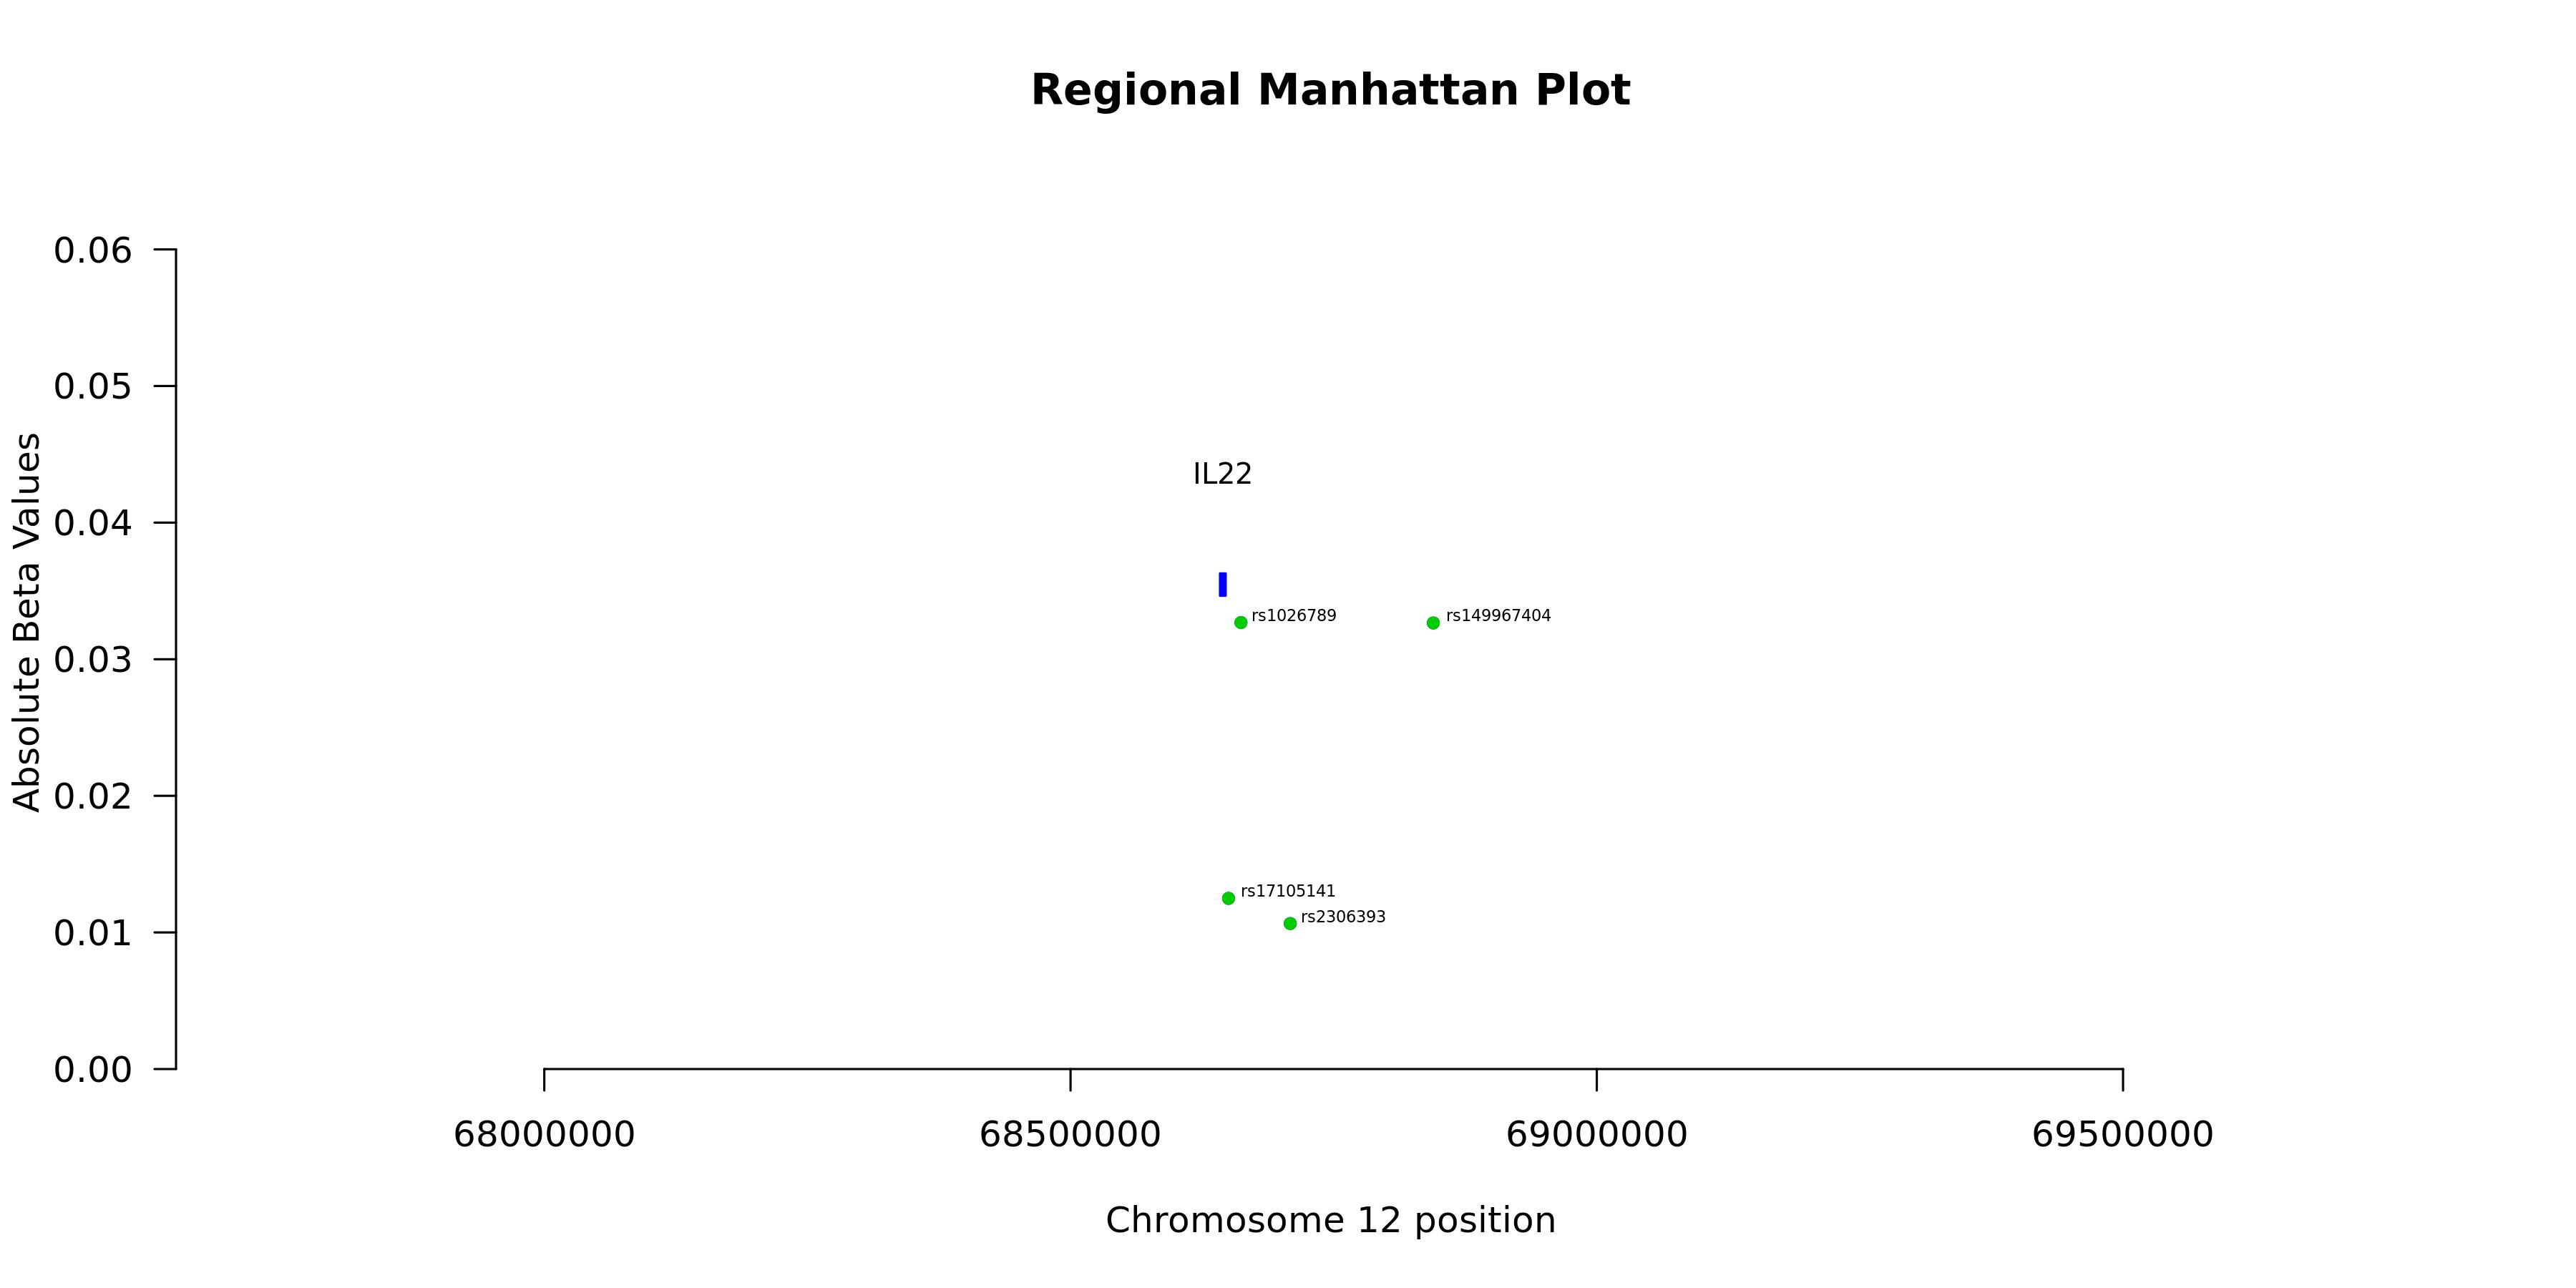
Regional Manhattan Plotenlarge ⤢
Model record
Field
Value
Gene
IL22
test_n
10538
sparsity
108
pearson_coefficent
0.165531708714043
SE
0.0106104848335322
P_corr
3.92344153570731e-54
R2 Covariate Model
0.0786
R2 Full Model
0.0987
P
1.22801353072507e-197
P_full
9.38836569176876e-127
n_cis_pqtl
6
max_cis_pqtl
rs1026789
rank_max_cis_pqtl
1
mean_pqtl_beta
0.0179011474348509
mean_nopqtl_beta
0.00801149216710909
percentage_pqtl
0.0555555555555556
percentage_nopqtl
0.944444444444444
cis and genome-wide metrics
Field
Value
Gene
IL22
test_n_genomewide
10538
sparsity_genomewide
108
pearson_coefficent_genomewide
0.165531708714043
SE_genomewide
0.0106104848335322
P_corr_genomewide
3.92344153570731e-54
R2_covariate_model_genomewide
0.0785915930857877
R2_full_model_genomewide
0.0987443548047745
P_genomewide
1.22801353072507e-197
P_full_genomewide
9.38836569176876e-127
n_cis_pqtl
6
max_cis_pqtl
rs1026789
rank_max_cis_pqtl
1
mean_pqtl_beta
0.0179011474348509
mean_nopqtl_beta
0.00801149216710909
percentage_pqtl
0.0555555555555556
percentage_nopqtl
0.944444444444444
test_n_cis
10538
sparsity_cis
6
pearson_coefficent_cis
0.0697029684583731
SE_cis
0.0107327417880382
P_corr_cis
8.79525511926063e-11
R2_covariate_model_cis
0.0785915930857877
R2_full_model_cis
0.0817613292491273
P_cis
1.57129401650049e-162
P_full_cis
4.08265160812094e-25