FKBP14
Olink Explore plasma protein · SNPBoost PRS model
R2 Full Model
0.038
pearson_coefficent
0.192
sparsity
188
n_cis_pqtl
9
max_cis_pqtl
rs75705004
Diagnostics
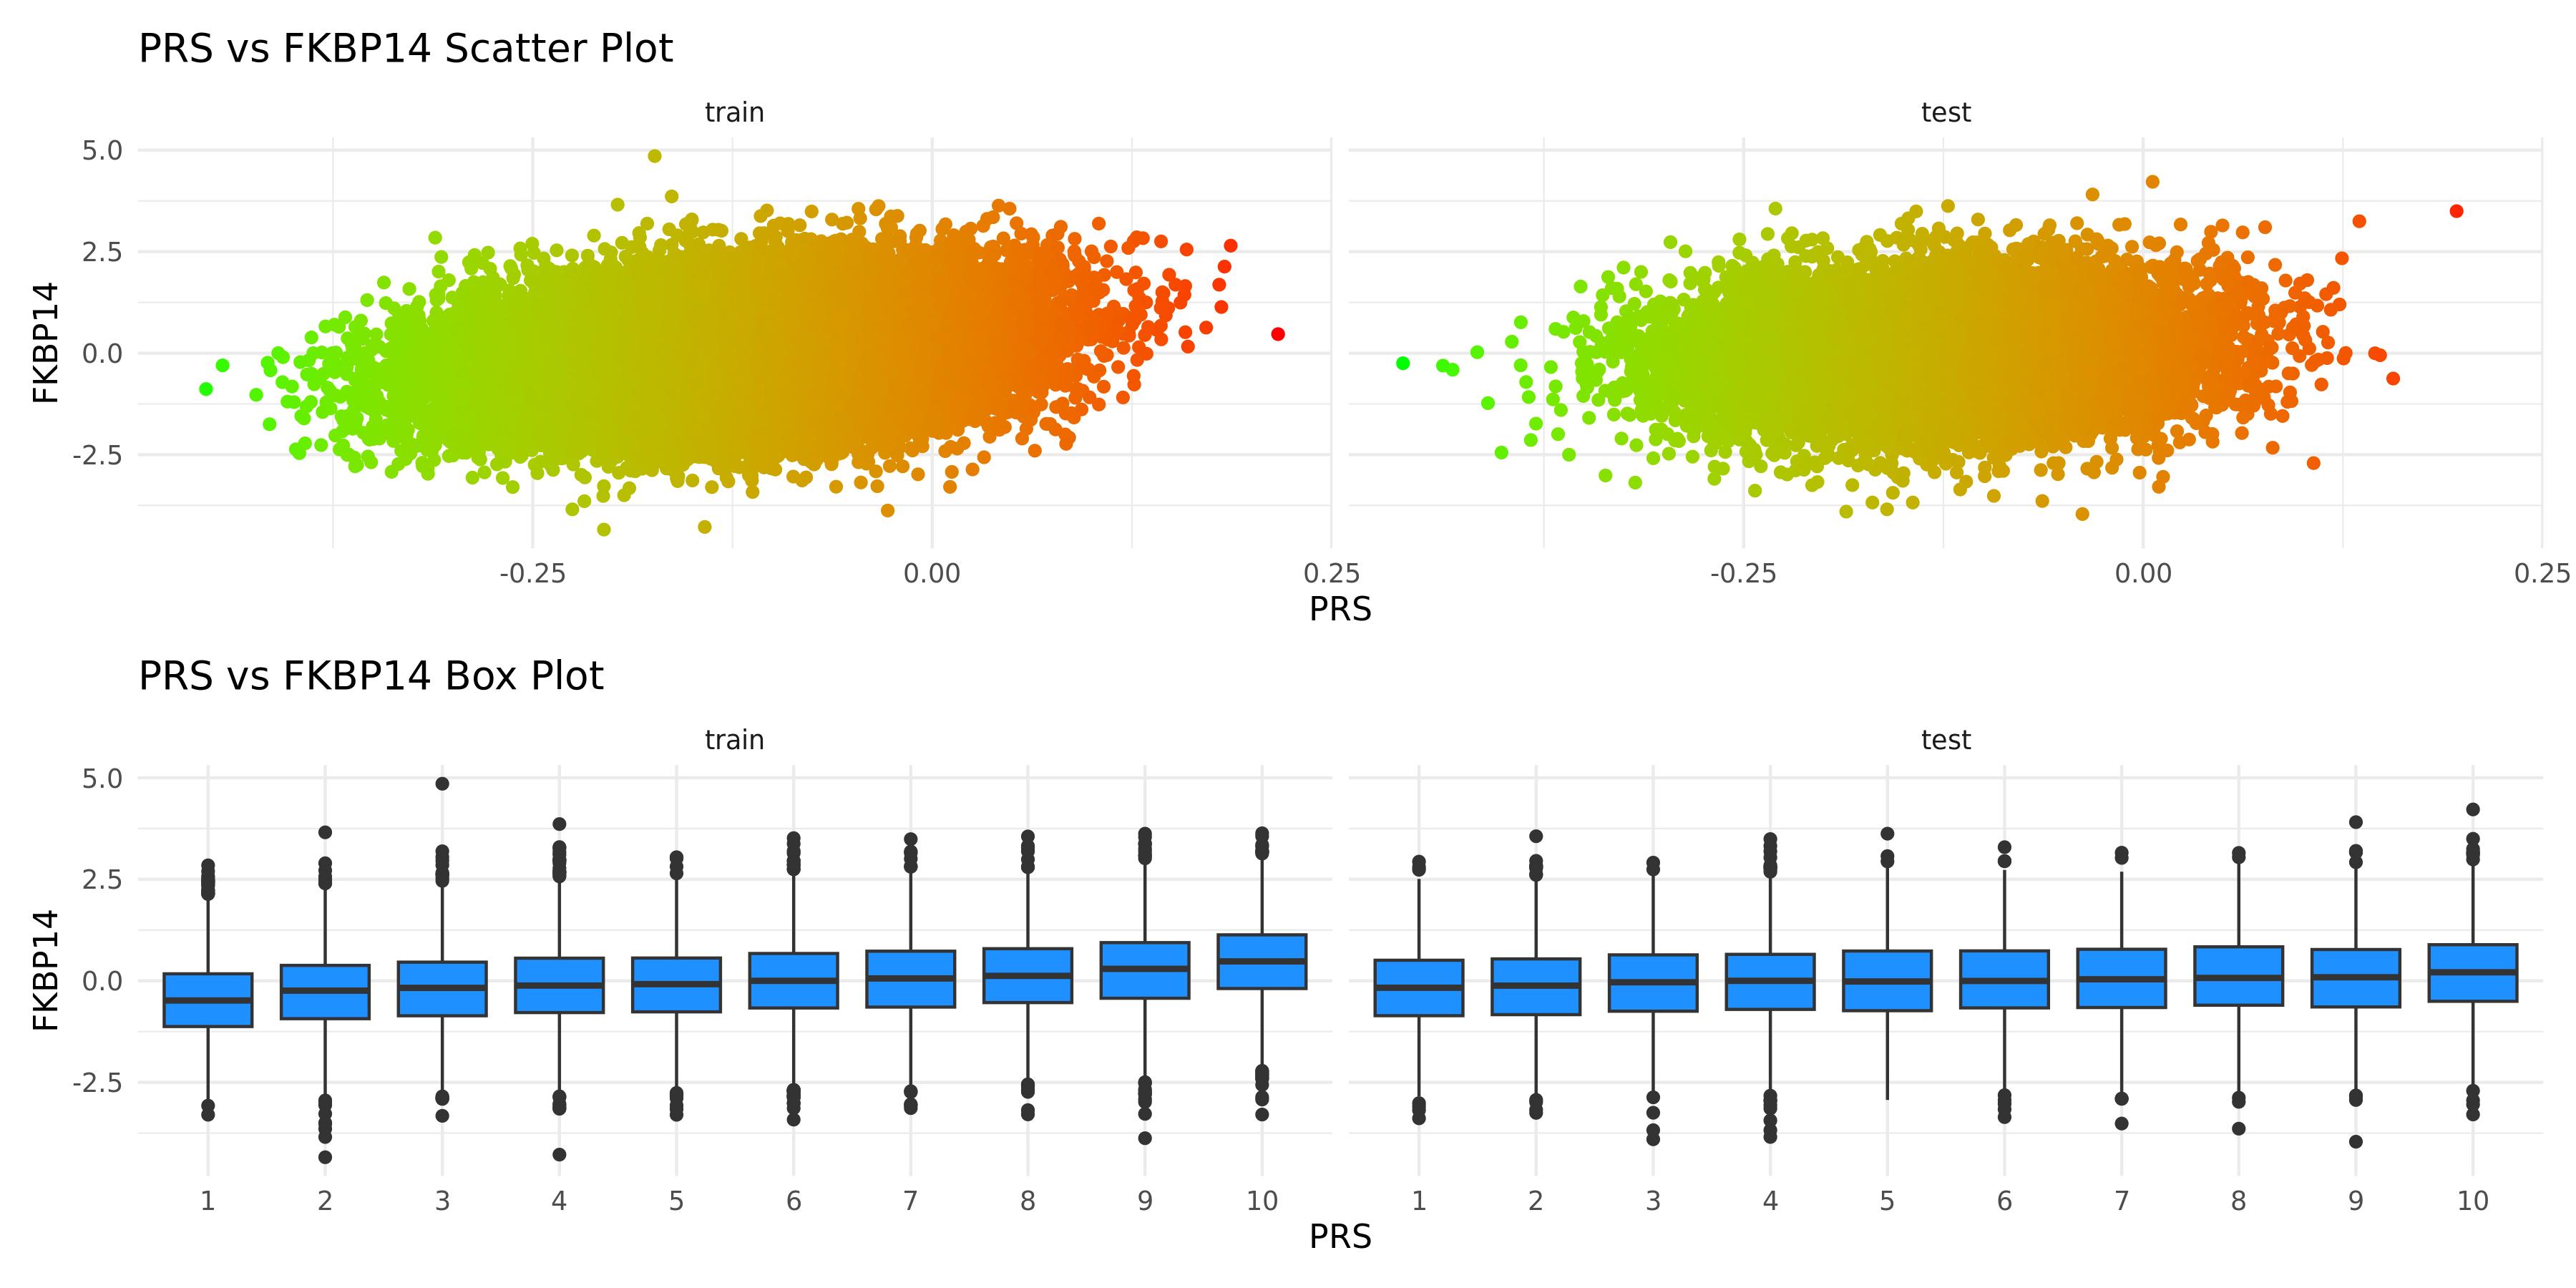
PRS scatter and box plotsenlarge ⤢
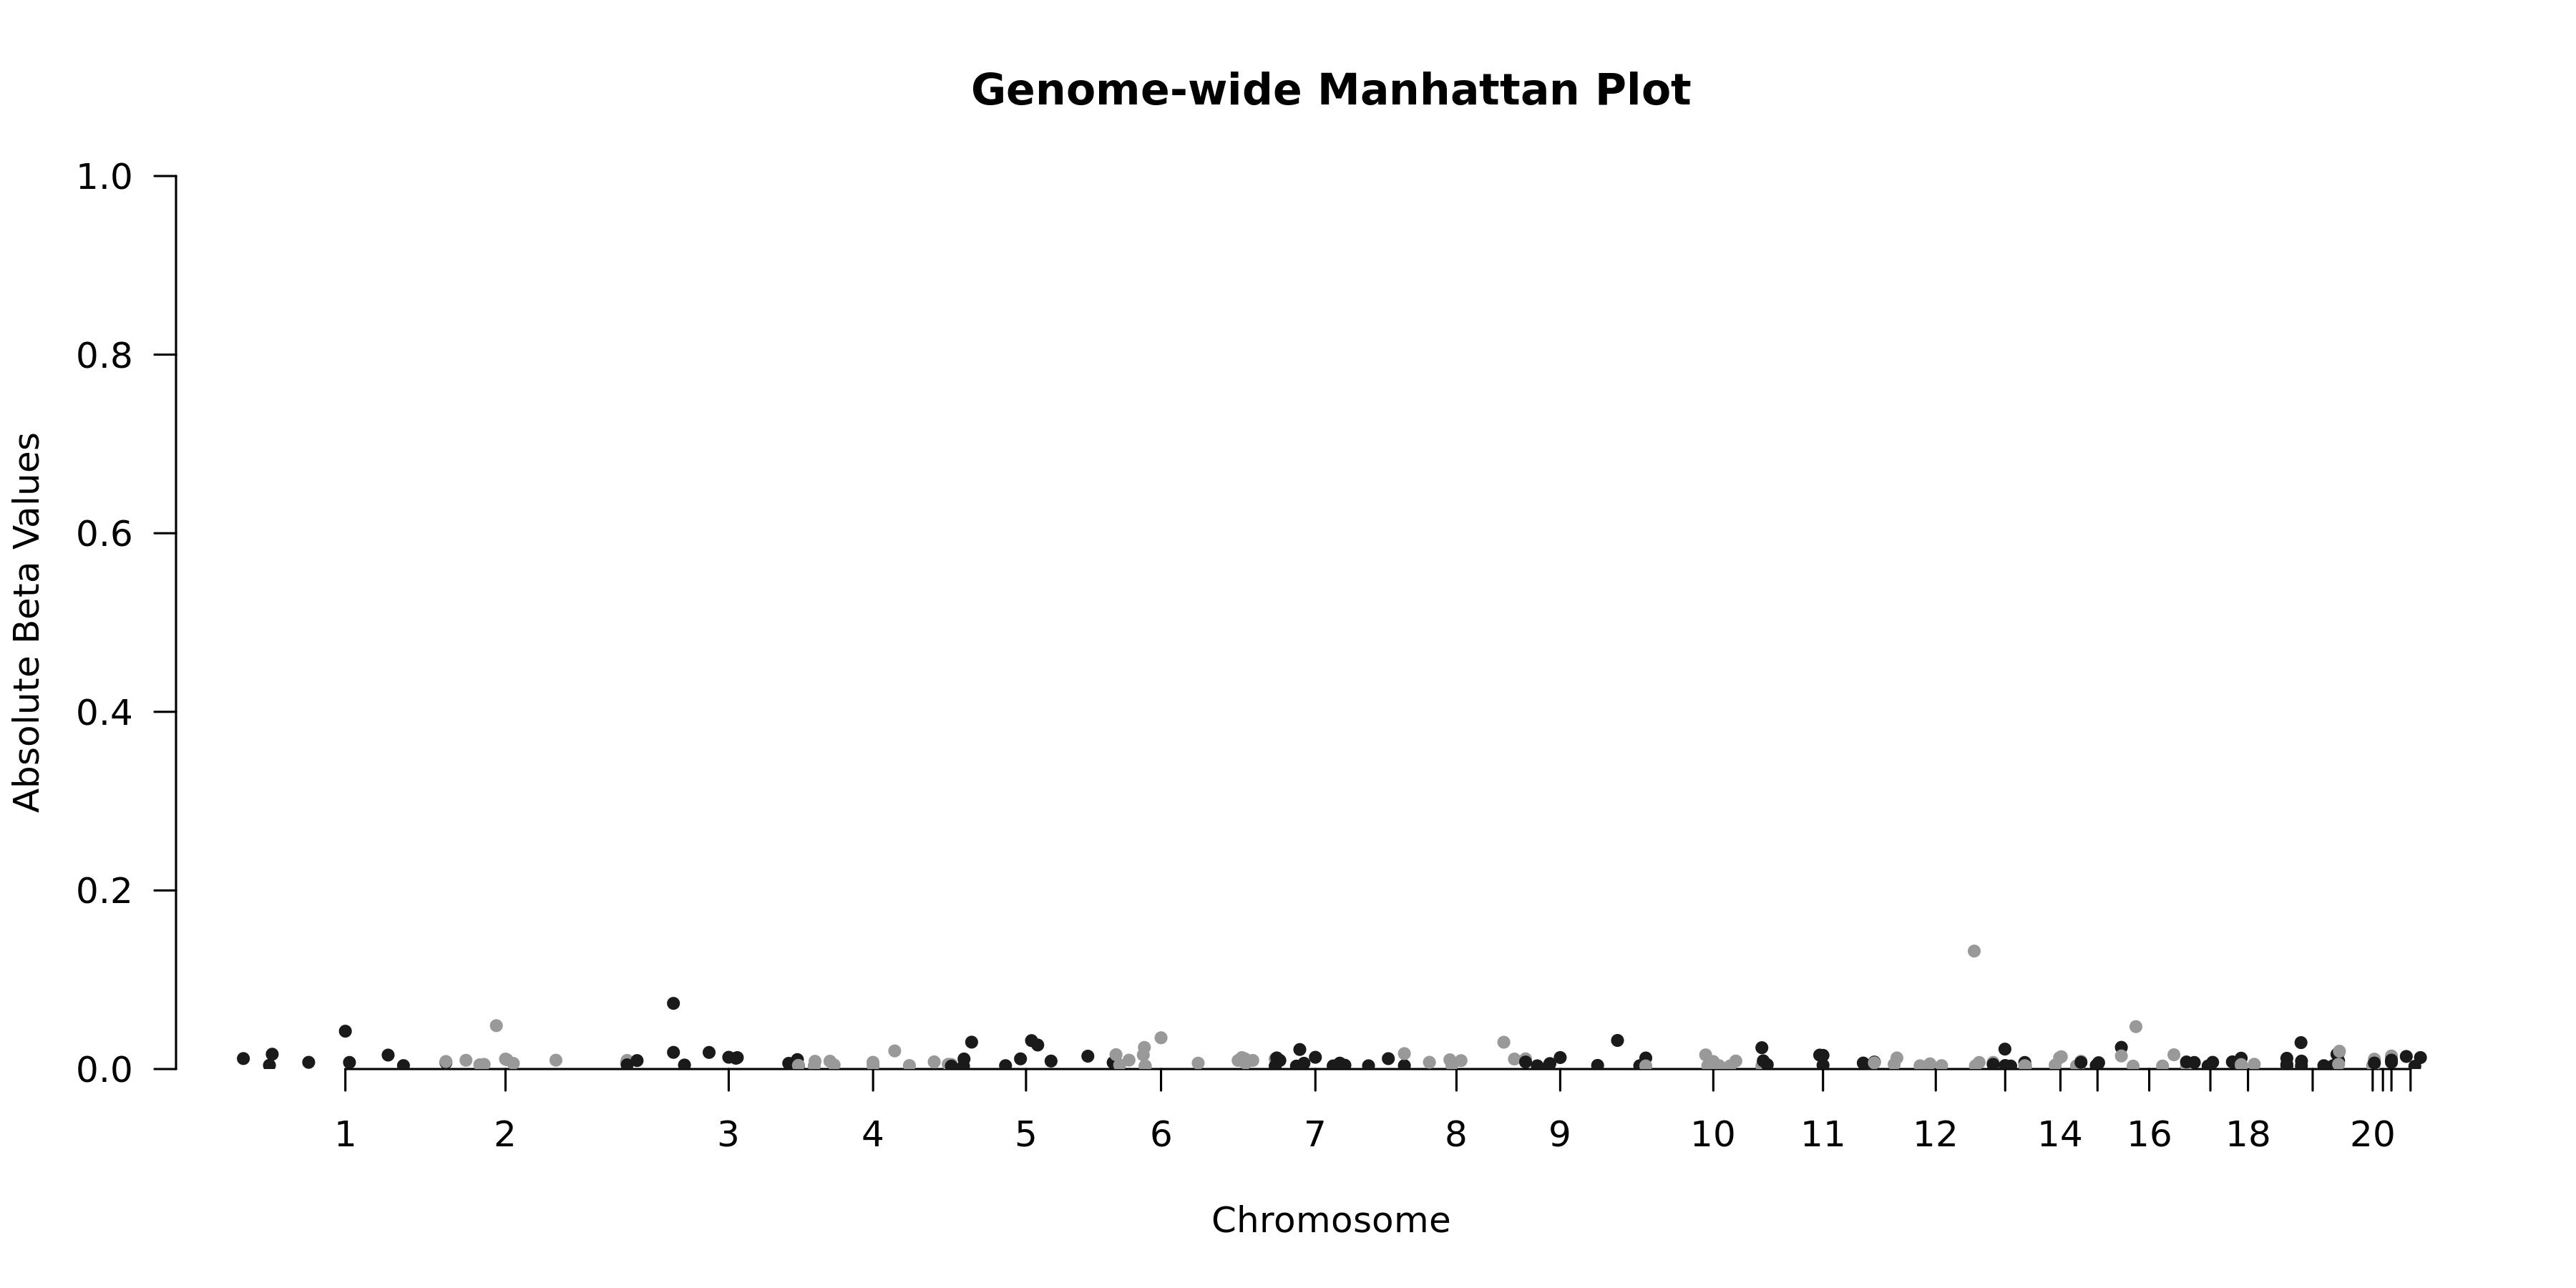
Genome-wide Manhattan Plotenlarge ⤢
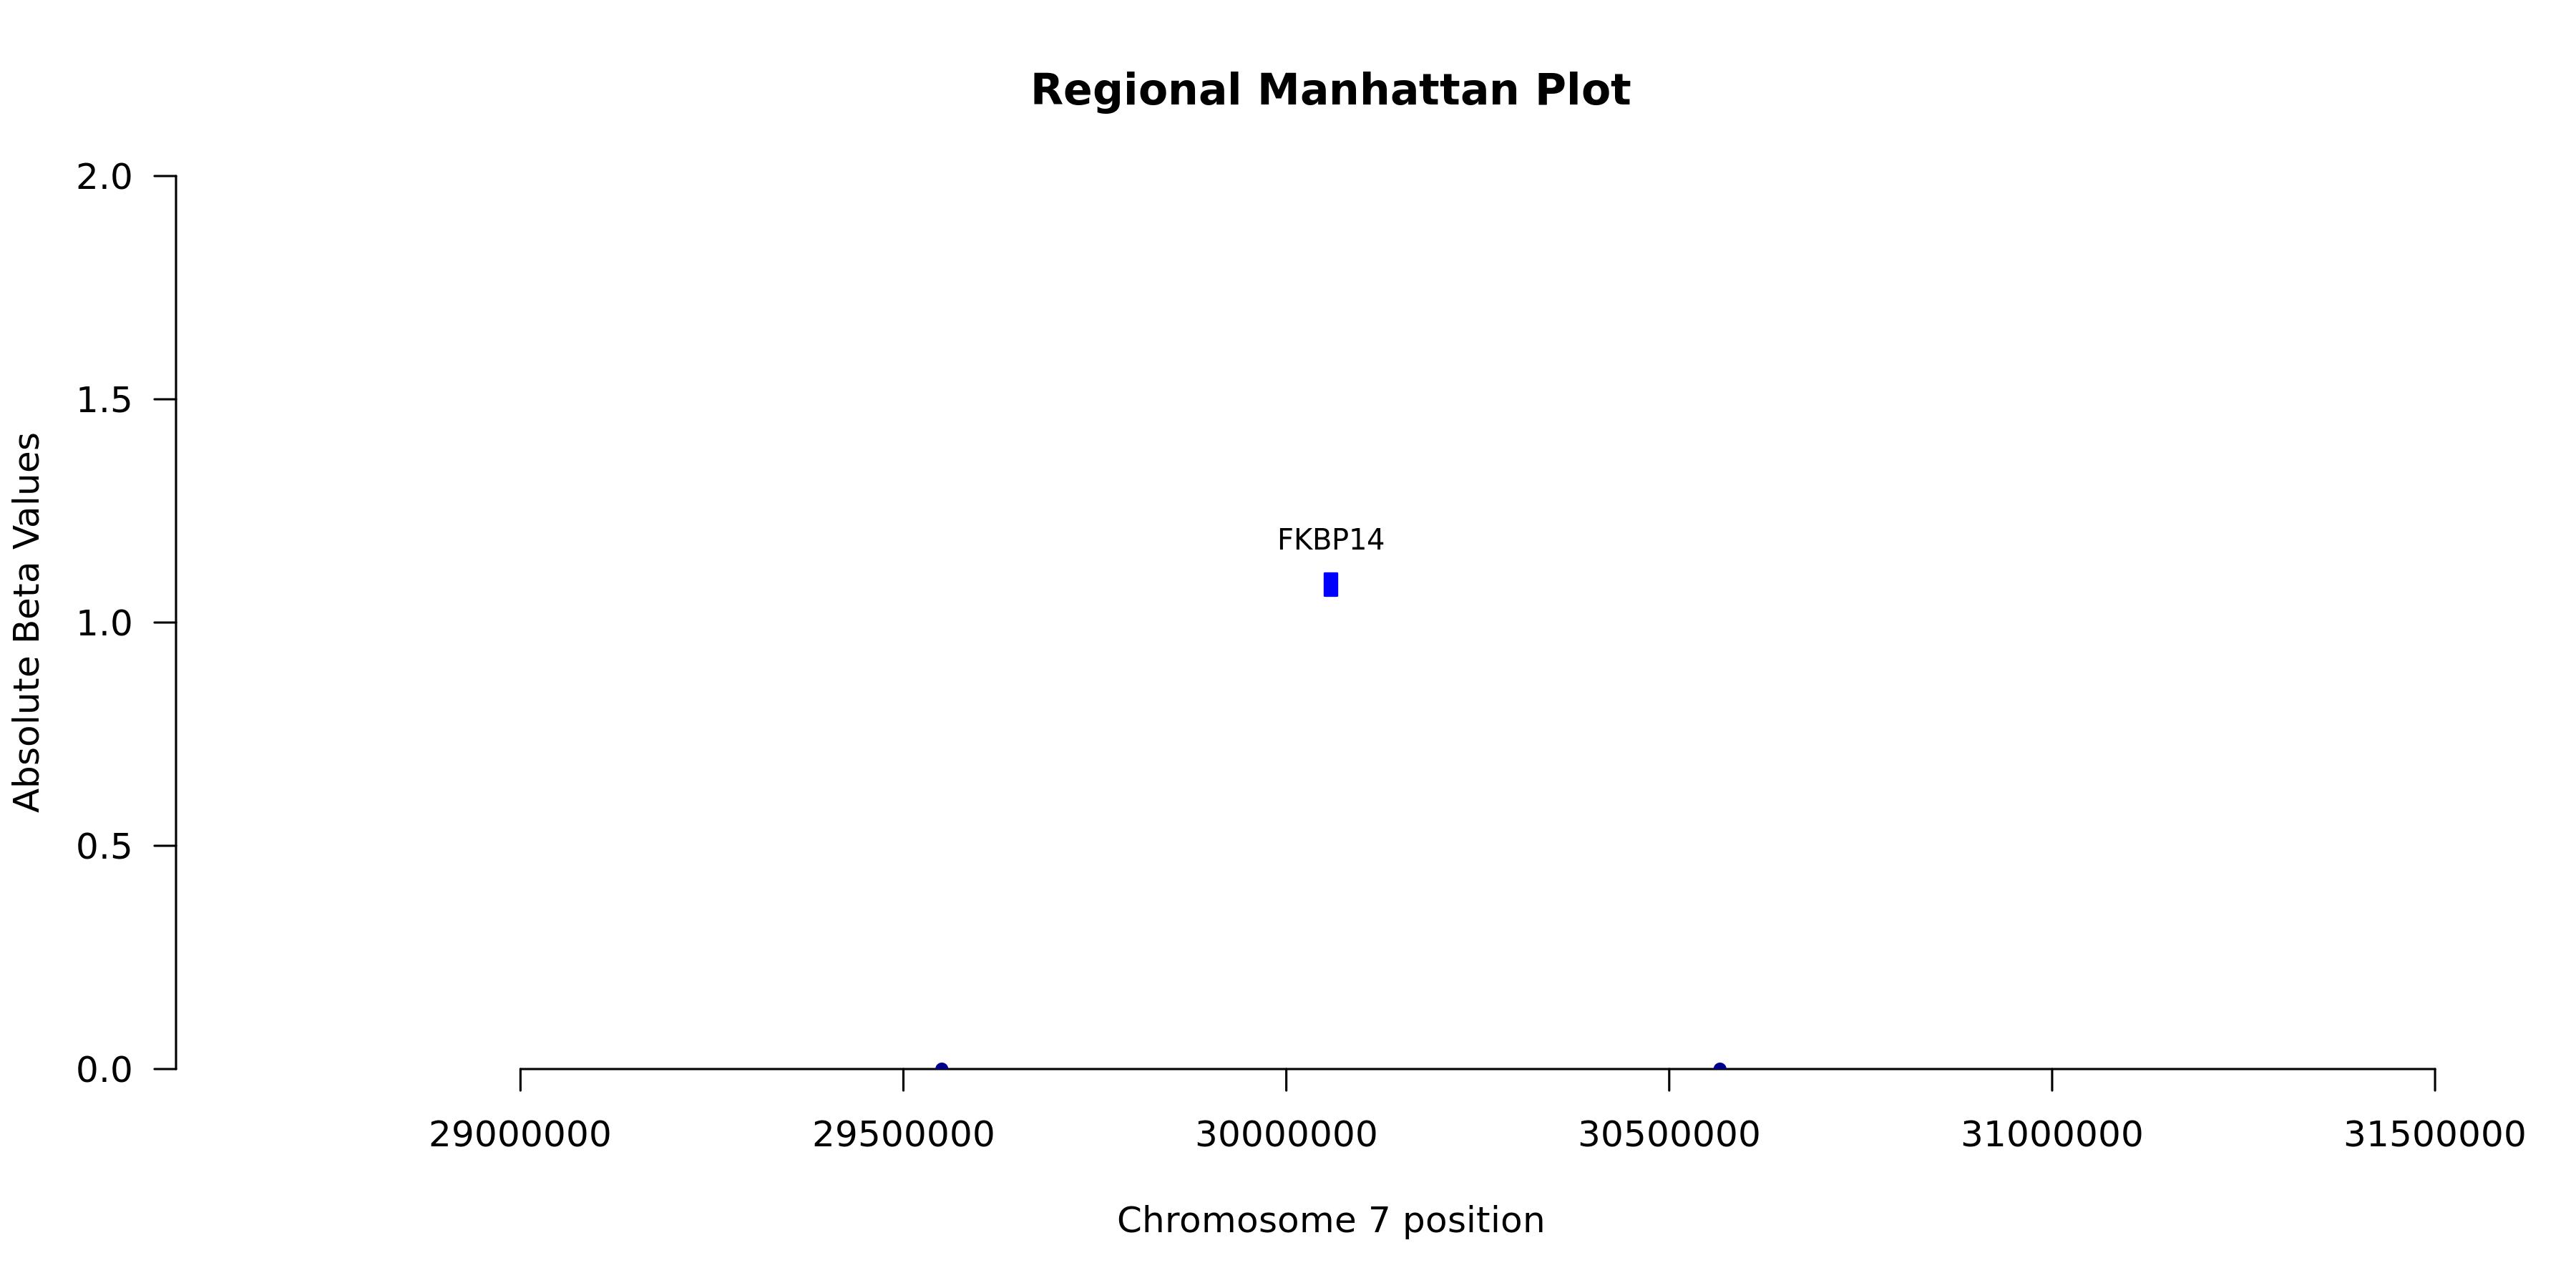
Regional Manhattan Plotenlarge ⤢
Model record
Field
Value
Gene
FKBP14
test_n
10538
sparsity
188
pearson_coefficent
0.192029562476458
SE
0.010555622966325
P_corr
1.33245224982811e-72
R2 Covariate Model
3e-04
R2 Full Model
0.038
P
4.37348624645929e-75
P_full
1.13261454305962e-244
n_cis_pqtl
9
max_cis_pqtl
rs75705004
rank_max_cis_pqtl
17
mean_pqtl_beta
0.00833959994010715
mean_nopqtl_beta
0.0108583575525568
percentage_pqtl
0.0478723404255319
percentage_nopqtl
0.952127659574468
cis and genome-wide metrics
Field
Value
Gene
FKBP14
test_n_genomewide
10538
sparsity_genomewide
188
pearson_coefficent_genomewide
0.192029562476458
SE_genomewide
0.010555622966325
P_corr_genomewide
1.33245224982811e-72
R2_covariate_model_genomewide
0.000280526316951302
R2_full_model_genomewide
0.0379600333270734
P_genomewide
4.37348624645929e-75
P_full_genomewide
1.13261454305962e-244
n_cis_pqtl
9
max_cis_pqtl
rs75705004
rank_max_cis_pqtl
17
mean_pqtl_beta
0.00833959994010715
mean_nopqtl_beta
0.0108583575525568
percentage_pqtl
0.0478723404255319
percentage_nopqtl
0.952127659574468
test_n_cis
10538
sparsity_cis
9
pearson_coefficent_cis
0.055976044235901
SE_cis
0.010738933708033
P_corr_cis
1.90681171147567e-07
R2_covariate_model_cis
0.000280526316951302
R2_full_model_cis
0.00315770422722772
P_cis
1.04630188572501e-07
P_full_cis
2.58732190142831e-11