DTYMK
Olink Explore plasma protein · SNPBoost PRS model
R2 Full Model
0.0633
pearson_coefficent
0.2264
sparsity
245
n_cis_pqtl
3
max_cis_pqtl
rs111507152
Diagnostics
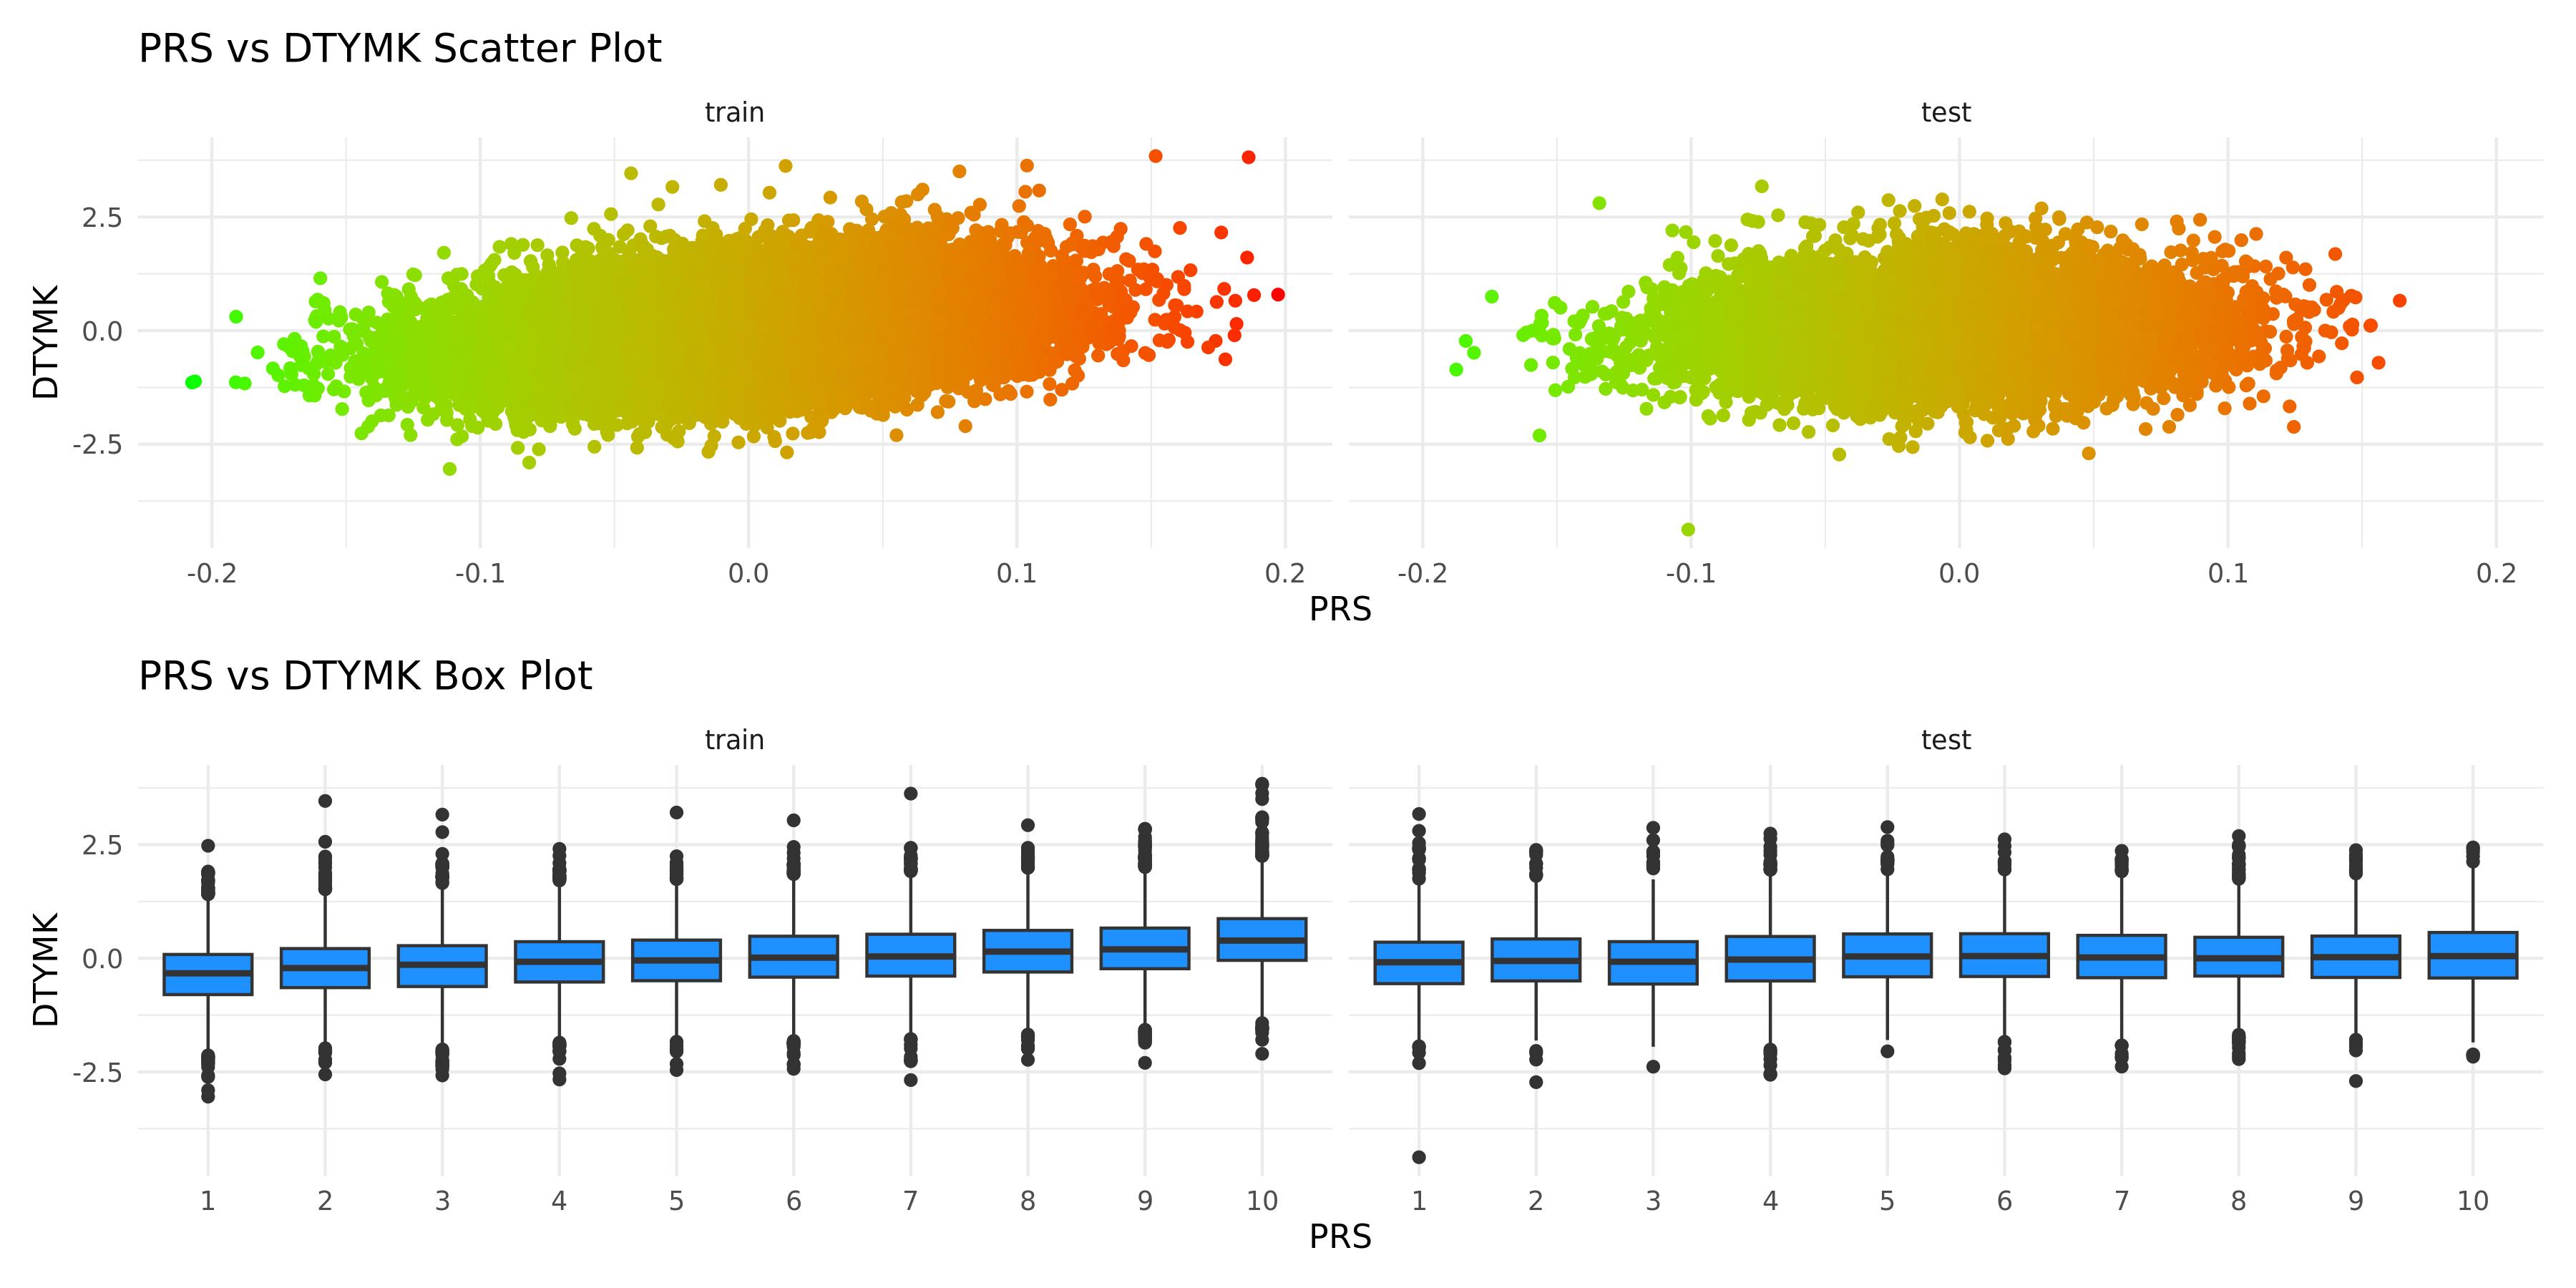
PRS scatter and box plotsenlarge ⤢
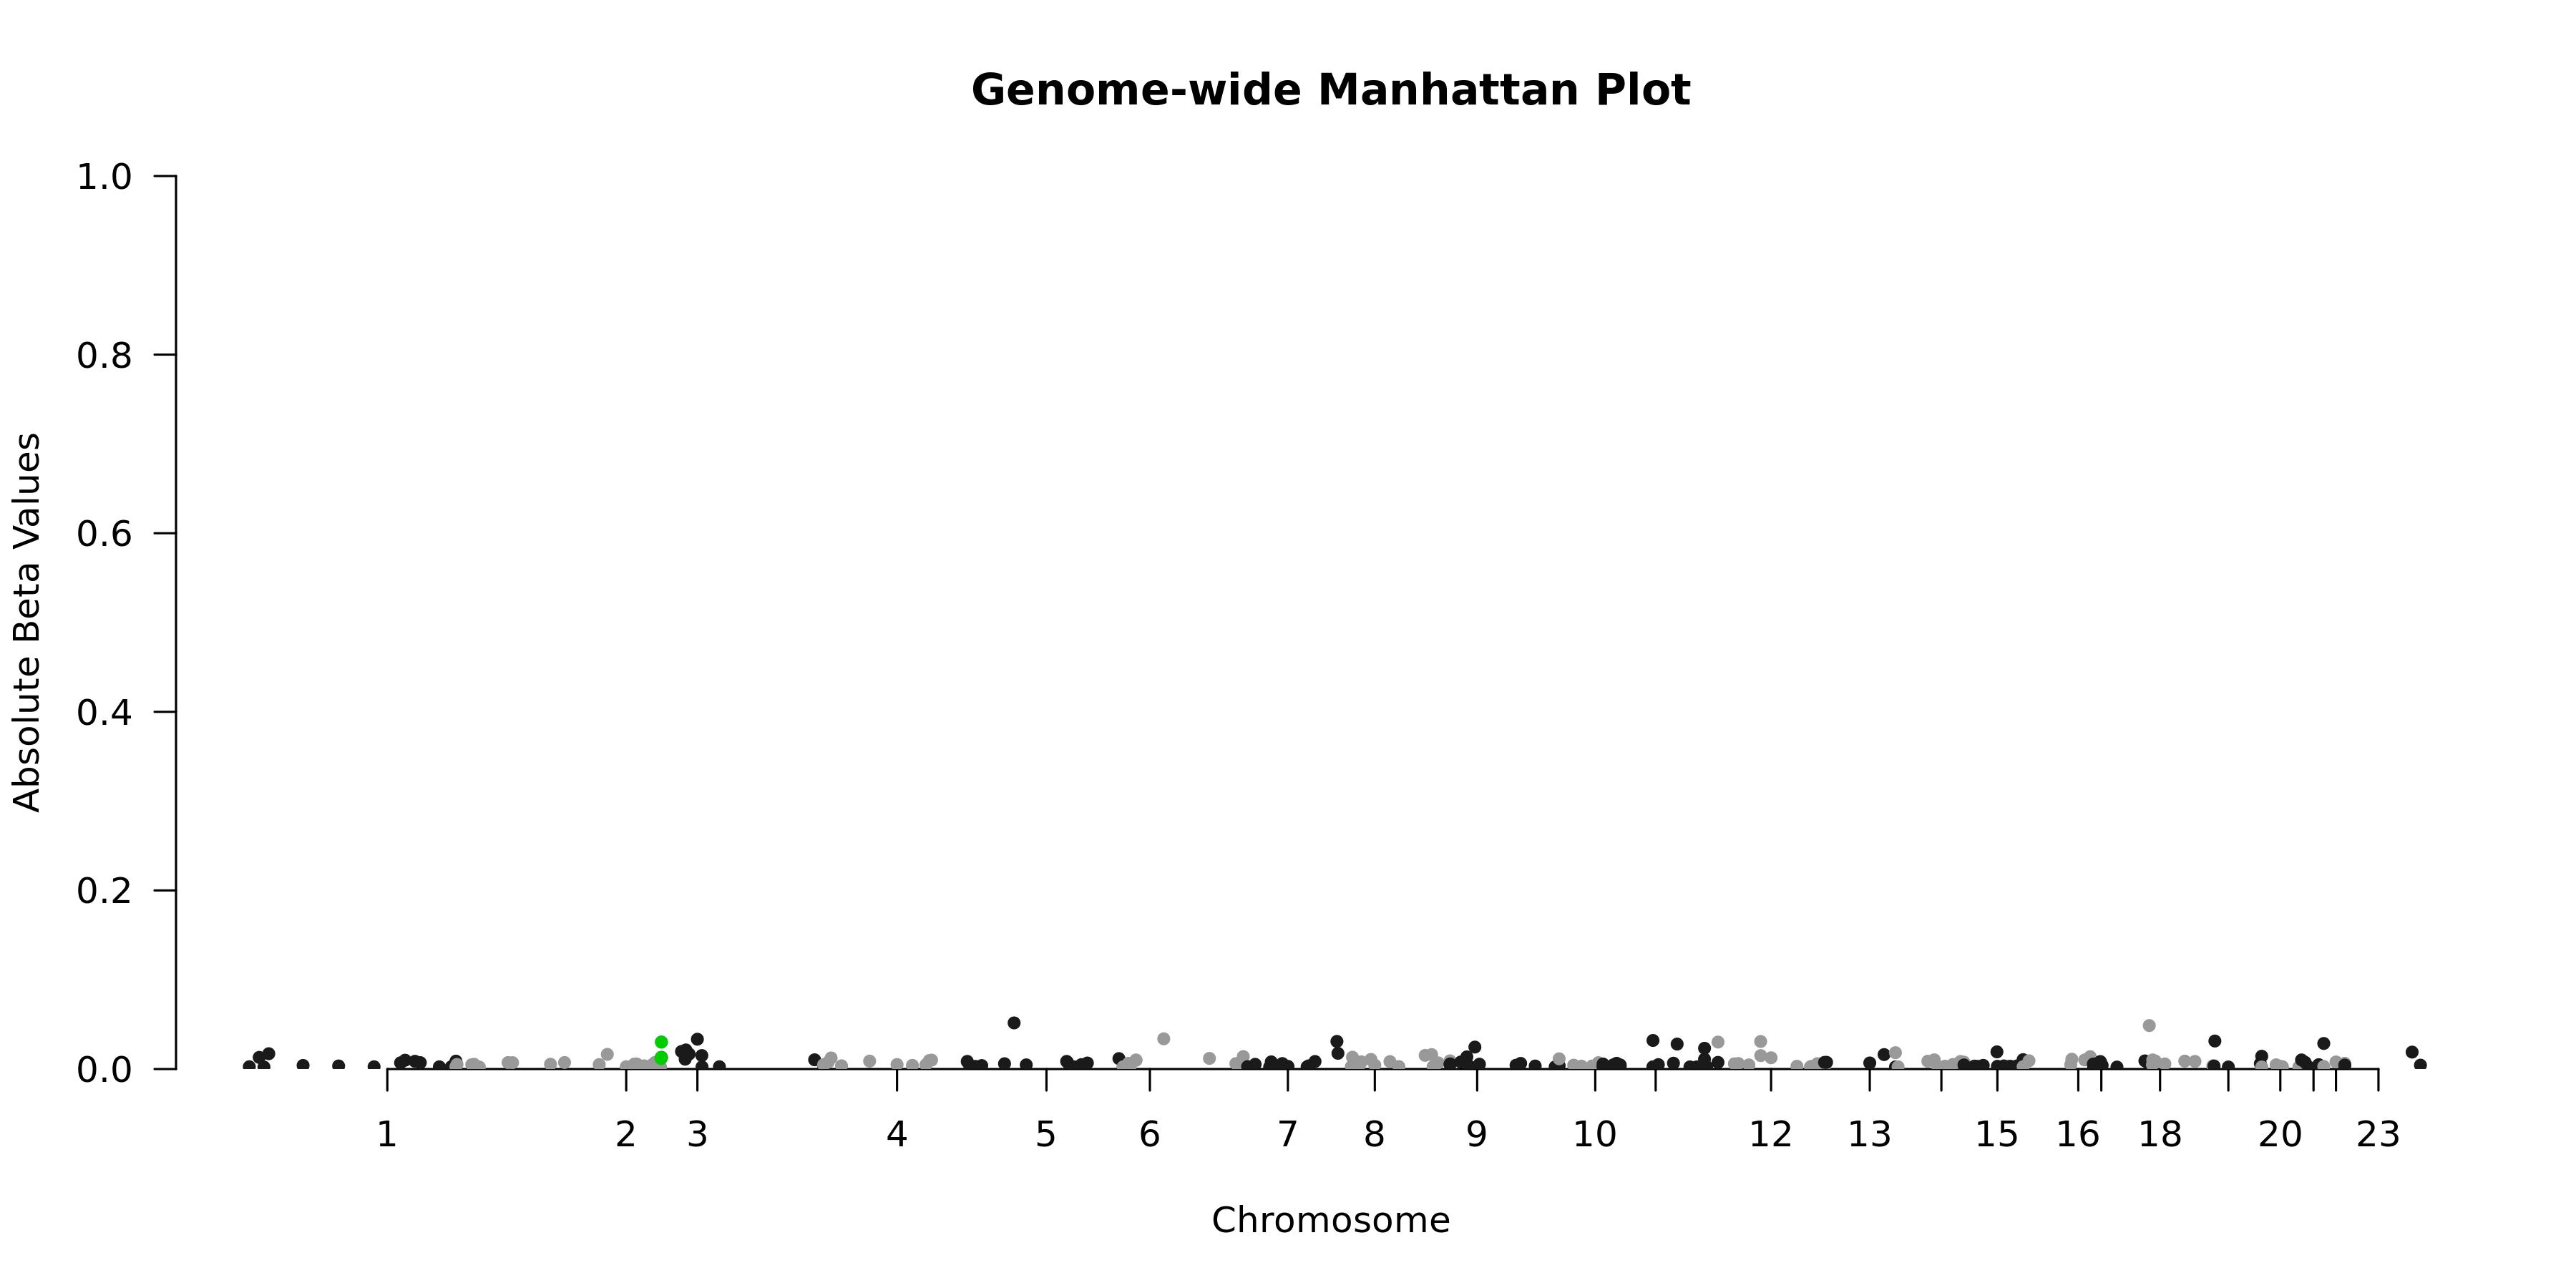
Genome-wide Manhattan Plotenlarge ⤢
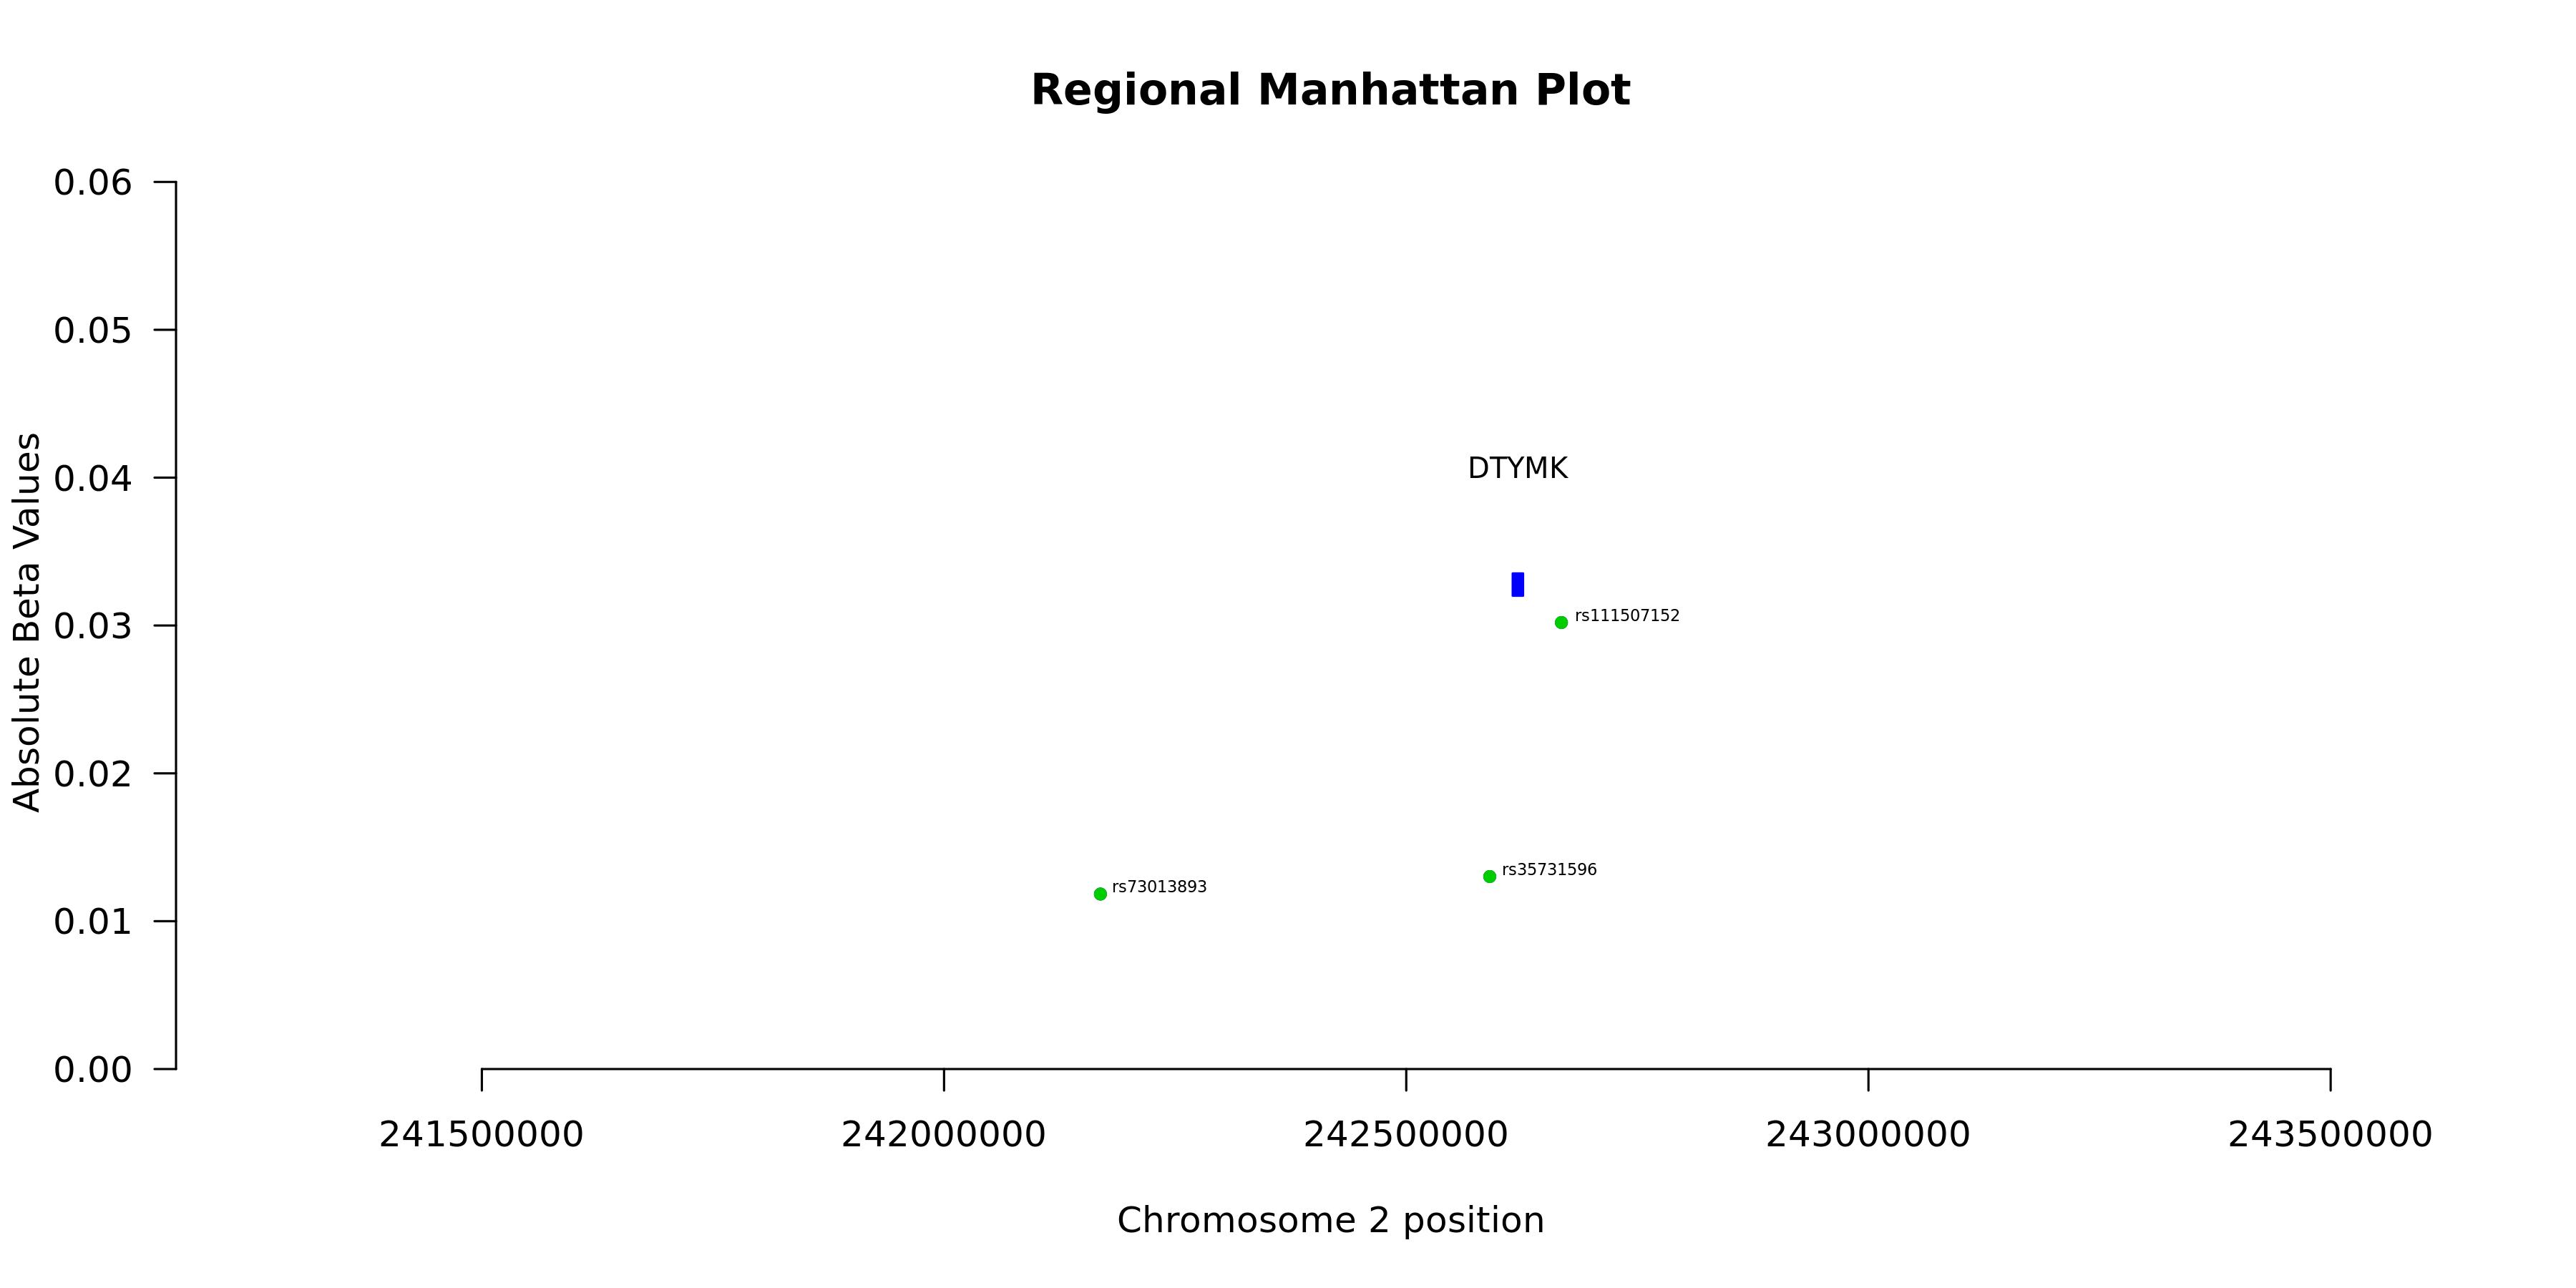
Regional Manhattan Plotenlarge ⤢
Model record
Field
Value
Gene
DTYMK
test_n
10538
sparsity
245
pearson_coefficent
0.2263689489853
SE
0.0104669120083346
P_corr
4.55769087593383e-101
R2 Covariate Model
0.0135
R2 Full Model
0.0633
P
1.28498019835662e-125
P_full
4.48635492122072e-266
n_cis_pqtl
3
max_cis_pqtl
rs111507152
rank_max_cis_pqtl
10
mean_pqtl_beta
0.0183515345535146
mean_nopqtl_beta
0.00771861534934339
percentage_pqtl
0.0122448979591837
percentage_nopqtl
0.987755102040816
cis and genome-wide metrics
Field
Value
Gene
DTYMK
test_n_genomewide
10538
sparsity_genomewide
245
pearson_coefficent_genomewide
0.2263689489853
SE_genomewide
0.0104669120083346
P_corr_genomewide
4.55769087593383e-101
R2_covariate_model_genomewide
0.0135069464265073
R2_full_model_genomewide
0.0633062219995361
P_genomewide
1.28498019835662e-125
P_full_genomewide
4.48635492122072e-266
n_cis_pqtl
3
max_cis_pqtl
rs111507152
rank_max_cis_pqtl
10
mean_pqtl_beta
0.0183515345535146
mean_nopqtl_beta
0.00771861534934339
percentage_pqtl
0.0122448979591837
percentage_nopqtl
0.987755102040816
test_n_cis
10538
sparsity_cis
3
pearson_coefficent_cis
0.034411907413604
SE_cis
0.0107394925318466
P_corr_cis
0.00135910485424985
R2_covariate_model_cis
0.0135069464265073
R2_full_model_cis
0.0143388442895148
P_cis
3.69790083741324e-29
P_full_cis
9.31331618243329e-13