CD63
Olink Explore plasma protein · SNPBoost PRS model
R2 Full Model
0.1082
pearson_coefficent
0.2996
sparsity
485
n_cis_pqtl
9
max_cis_pqtl
rs7968124
Diagnostics
PRS scatter and box plotsenlarge ⤢

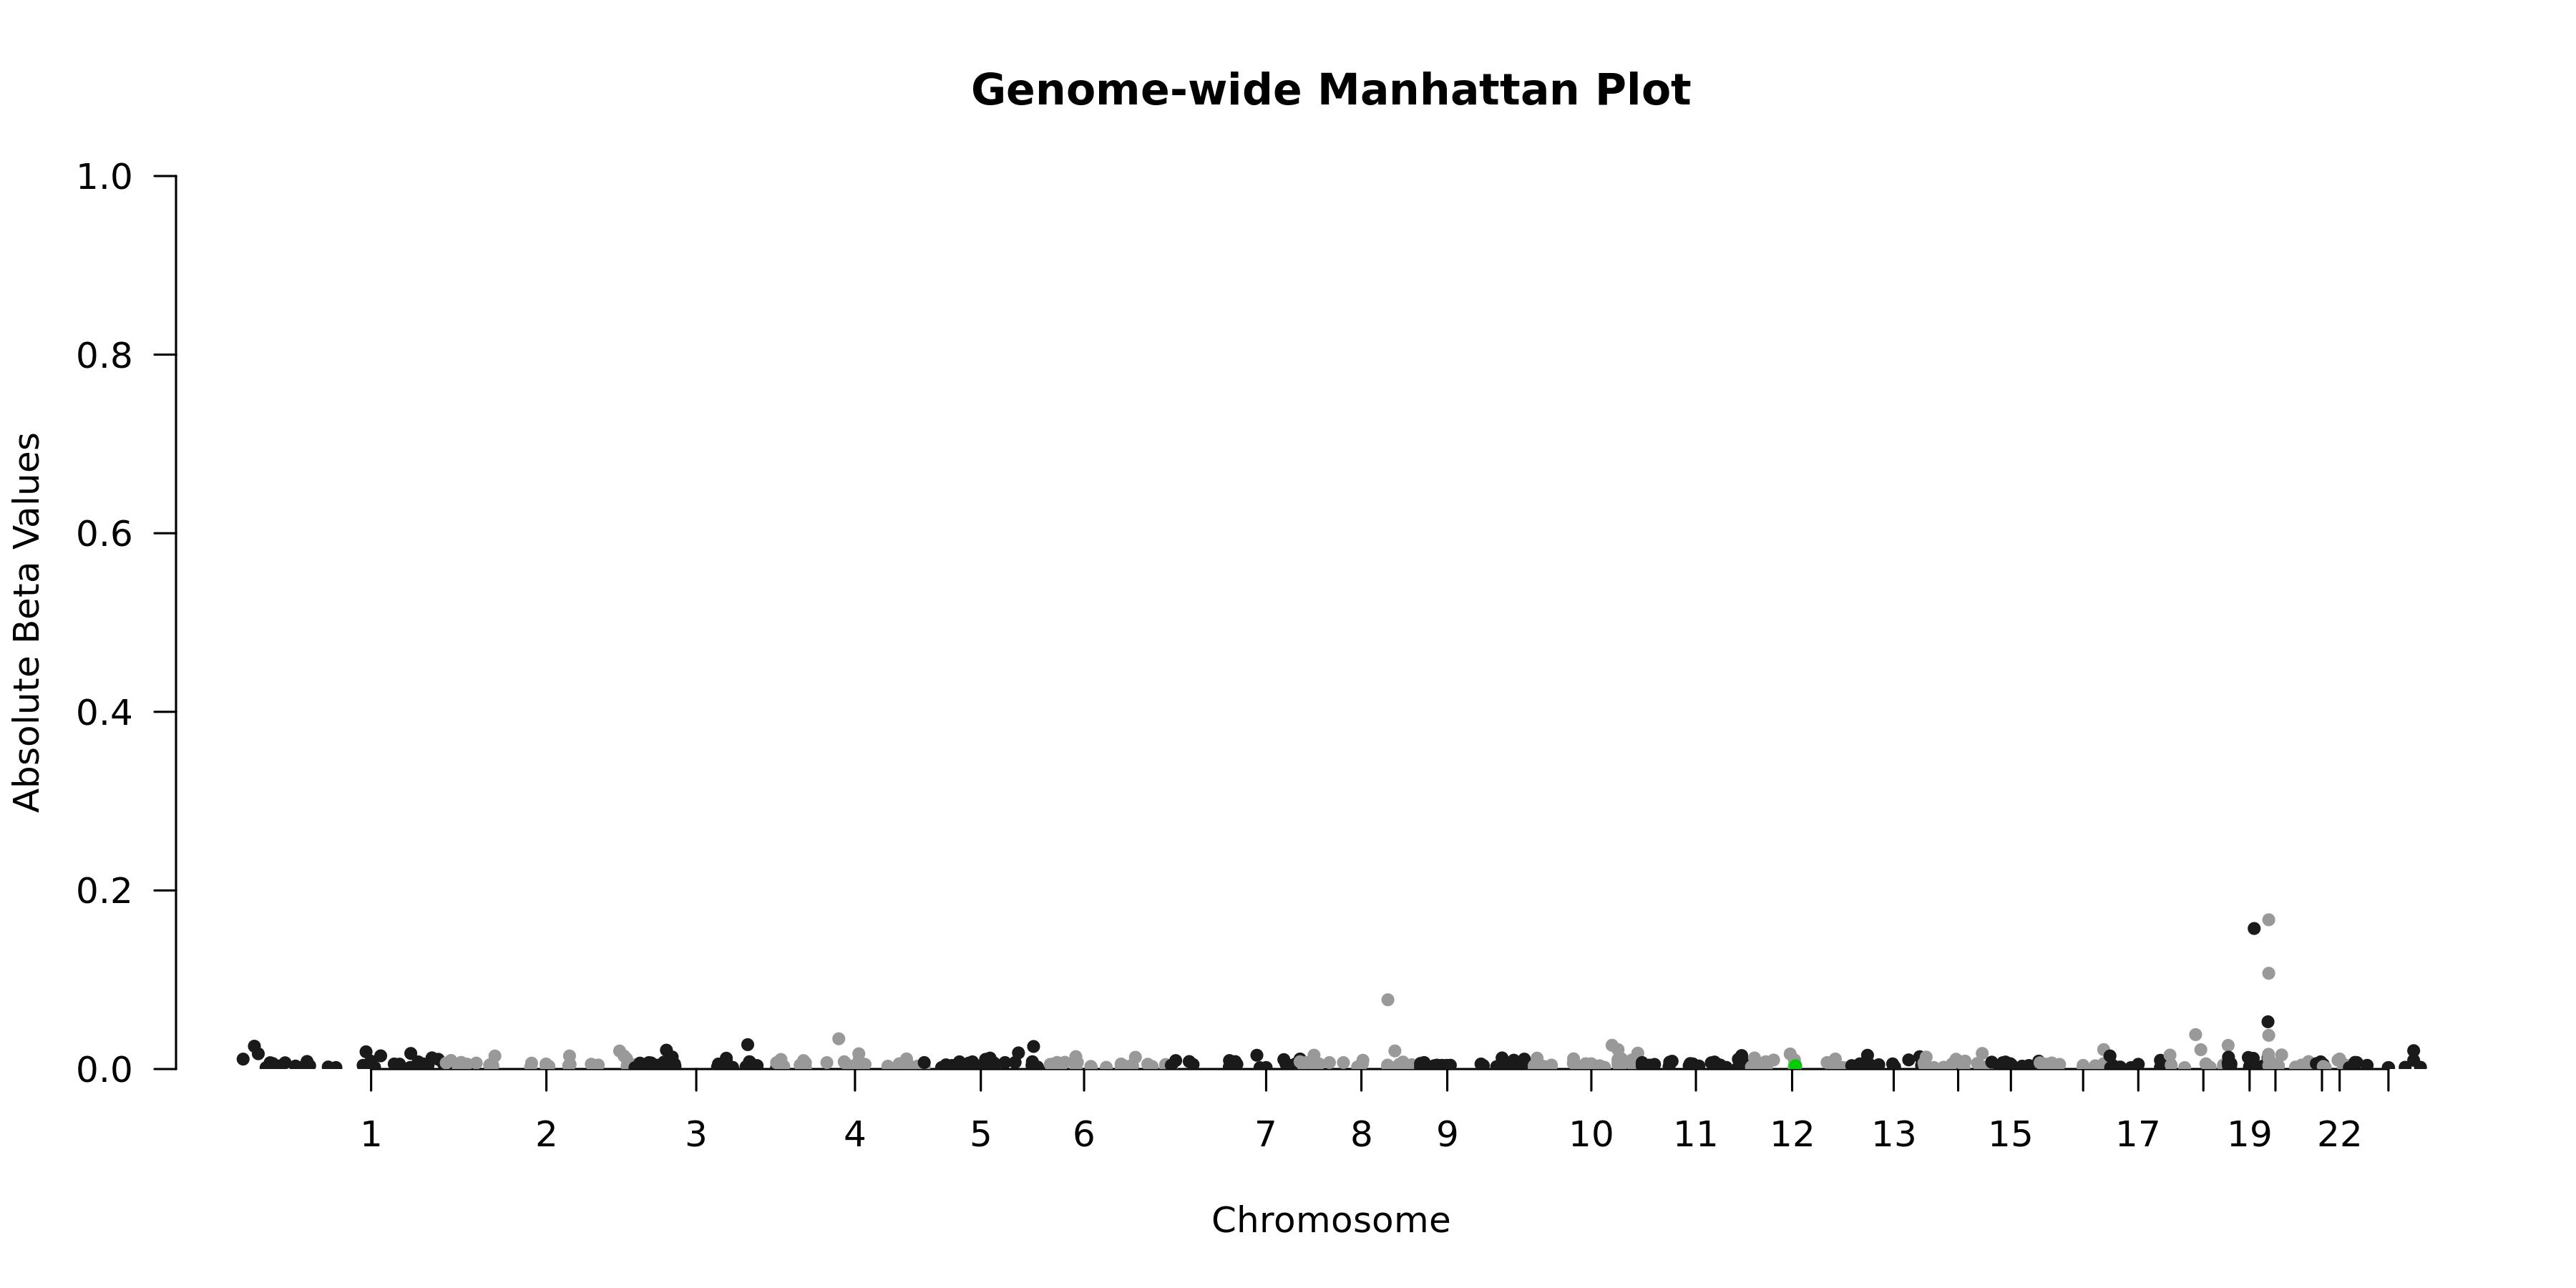
Genome-wide Manhattan Plotenlarge ⤢
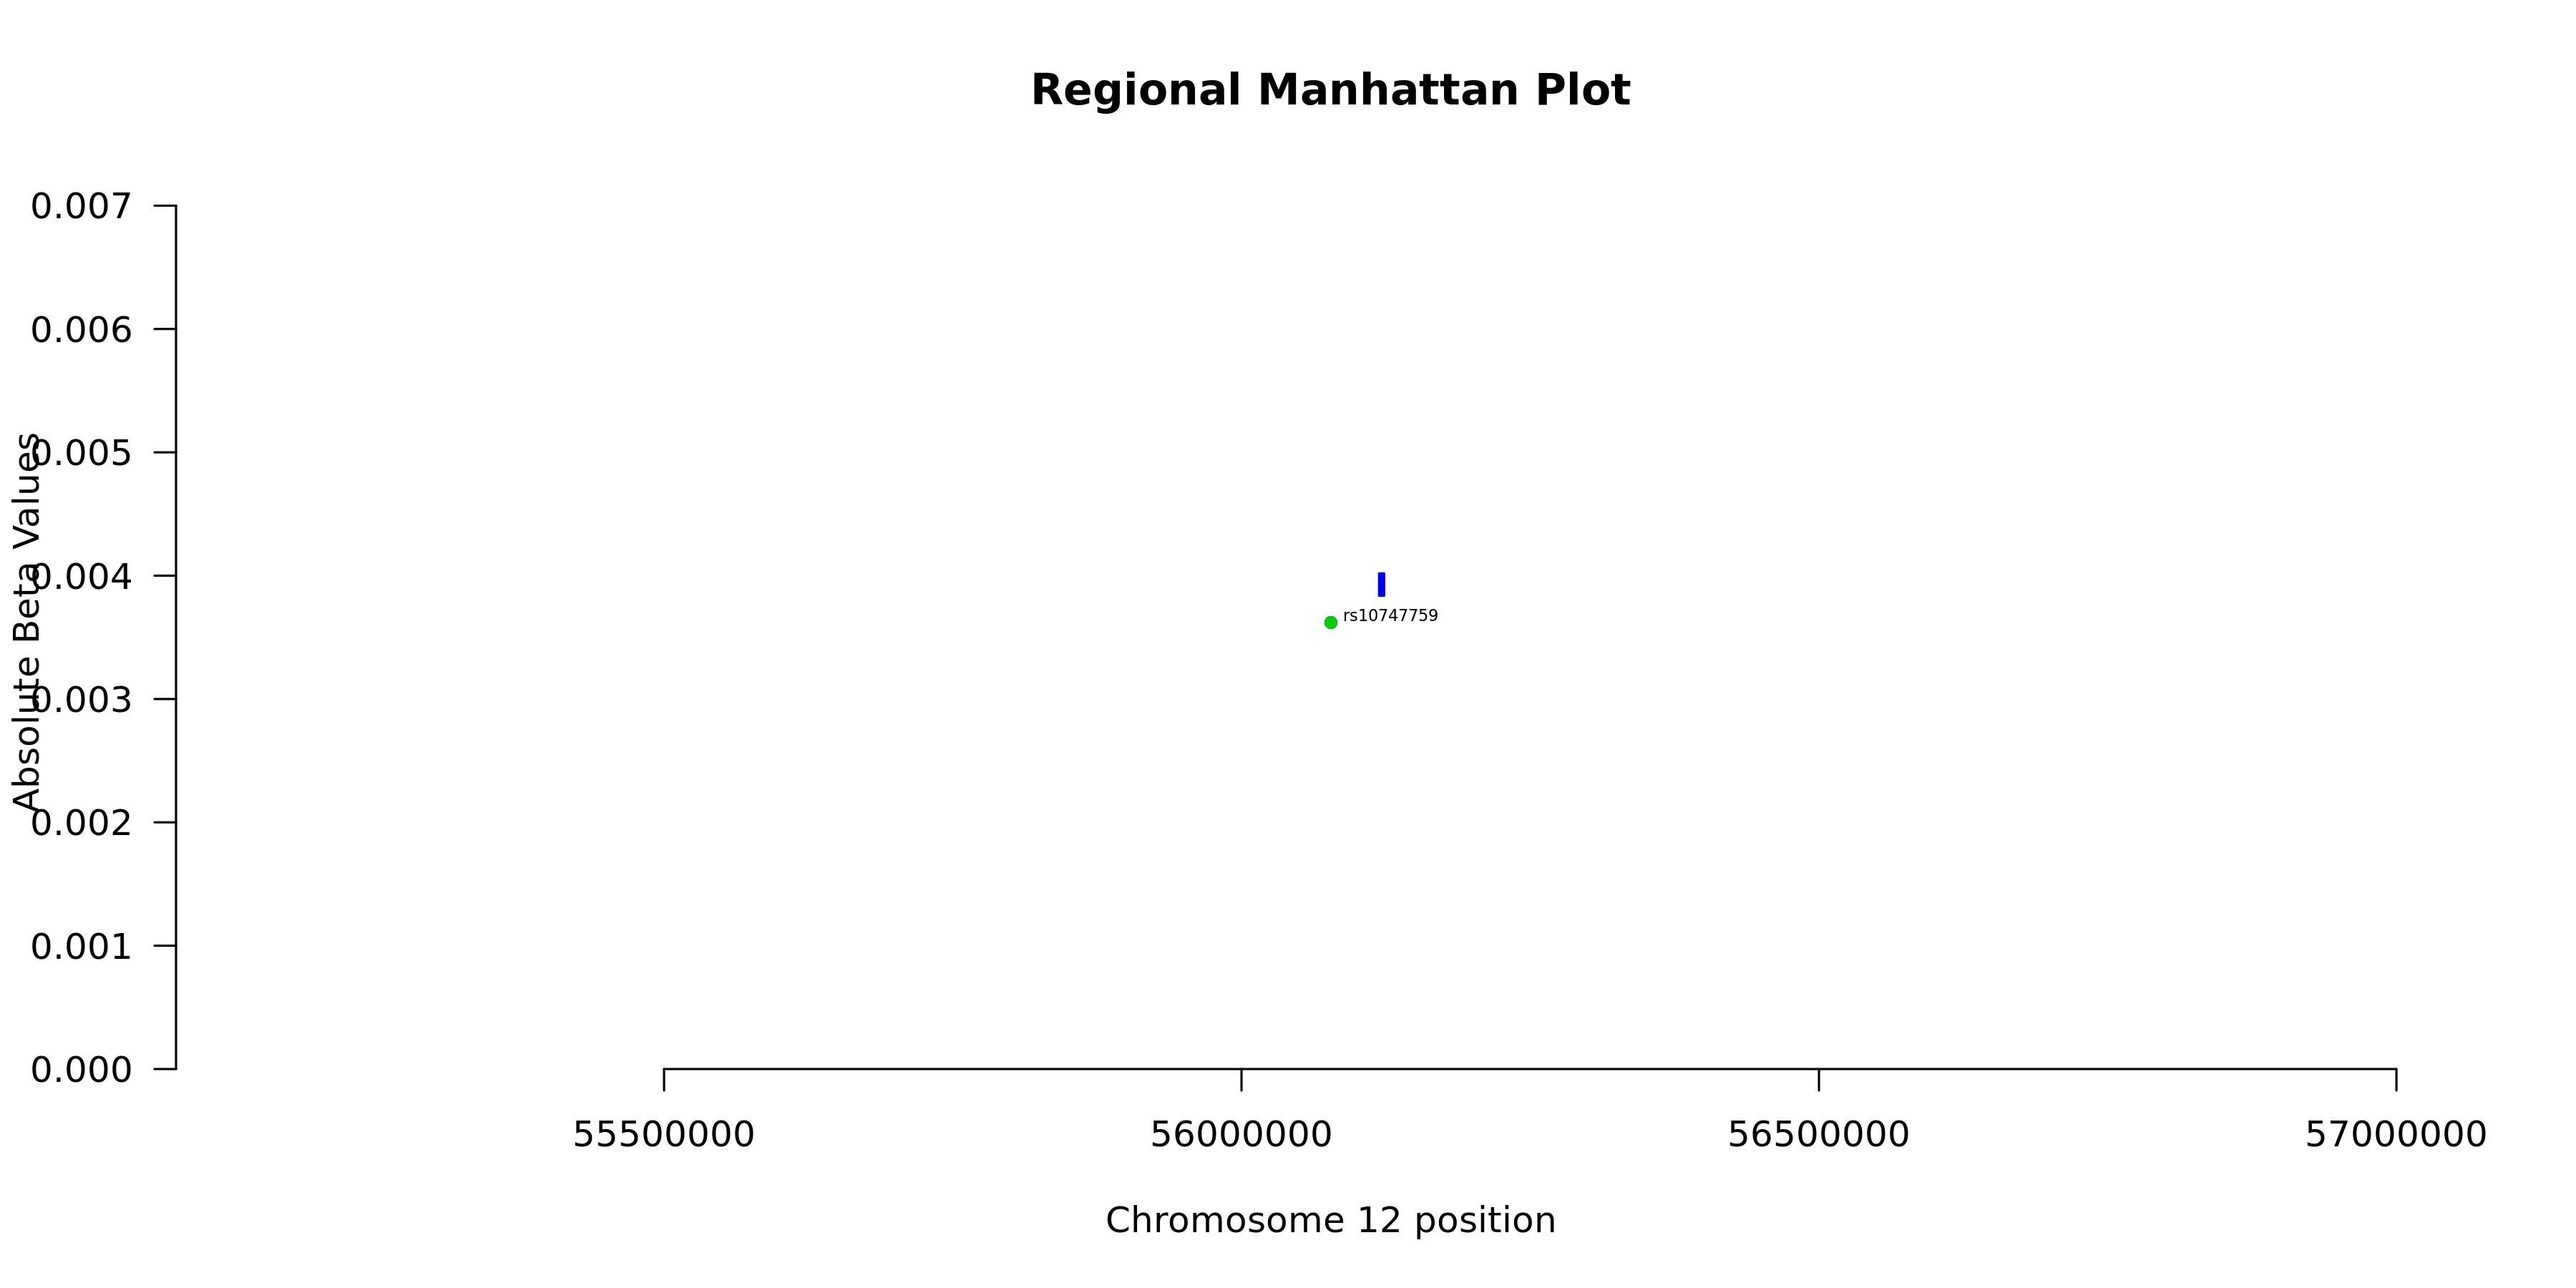
Regional Manhattan Plotenlarge ⤢
Model record
Field
Value
Gene
CD63
test_n
10538
sparsity
485
pearson_coefficent
0.299615729990222
SE
0.00946424721952255
P_corr
7.40314370227889e-210
R2 Covariate Model
0.0164
R2 Full Model
0.1082
P
4.18851459009017e-255
P_full
0
n_cis_pqtl
9
max_cis_pqtl
rs7968124
rank_max_cis_pqtl
62
mean_pqtl_beta
0.00461527263098914
mean_nopqtl_beta
0.00720317979321621
percentage_pqtl
0.0185567010309278
percentage_nopqtl
0.981443298969072
cis and genome-wide metrics
Field
Value
Gene
CD63
test_n_genomewide
10538
sparsity_genomewide
485
pearson_coefficent_genomewide
0.299615729990222
SE_genomewide
0.00946424721952255
P_corr_genomewide
7.40314370227889e-210
R2_covariate_model_genomewide
0.0164134424676841
R2_full_model_genomewide
0.108169968616902
P_genomewide
4.18851459009017e-255
P_full_genomewide
0
n_cis_pqtl
9
max_cis_pqtl
rs7968124
rank_max_cis_pqtl
62
mean_pqtl_beta
0.00461527263098914
mean_nopqtl_beta
0.00720317979321621
percentage_pqtl
0.0185567010309278
percentage_nopqtl
0.981443298969072
test_n_cis
10538
sparsity_cis
9
pearson_coefficent_cis
0.0337833640193541
SE_cis
0.00991430852418103
P_corr_cis
0.000658064906216203
R2_covariate_model_cis
0.0164134424676841
R2_full_model_cis
0.0172336256974904
P_cis
7.04454385890292e-41
P_full_cis
9.7204828130844e-11