ACRV1
Olink Explore plasma protein · SNPBoost PRS model
R2 Full Model
0.5881
pearson_coefficent
0.1633
sparsity
101
n_cis_pqtl
1
max_cis_pqtl
rs111688237
Diagnostics
PRS scatter and box plotsenlarge ⤢

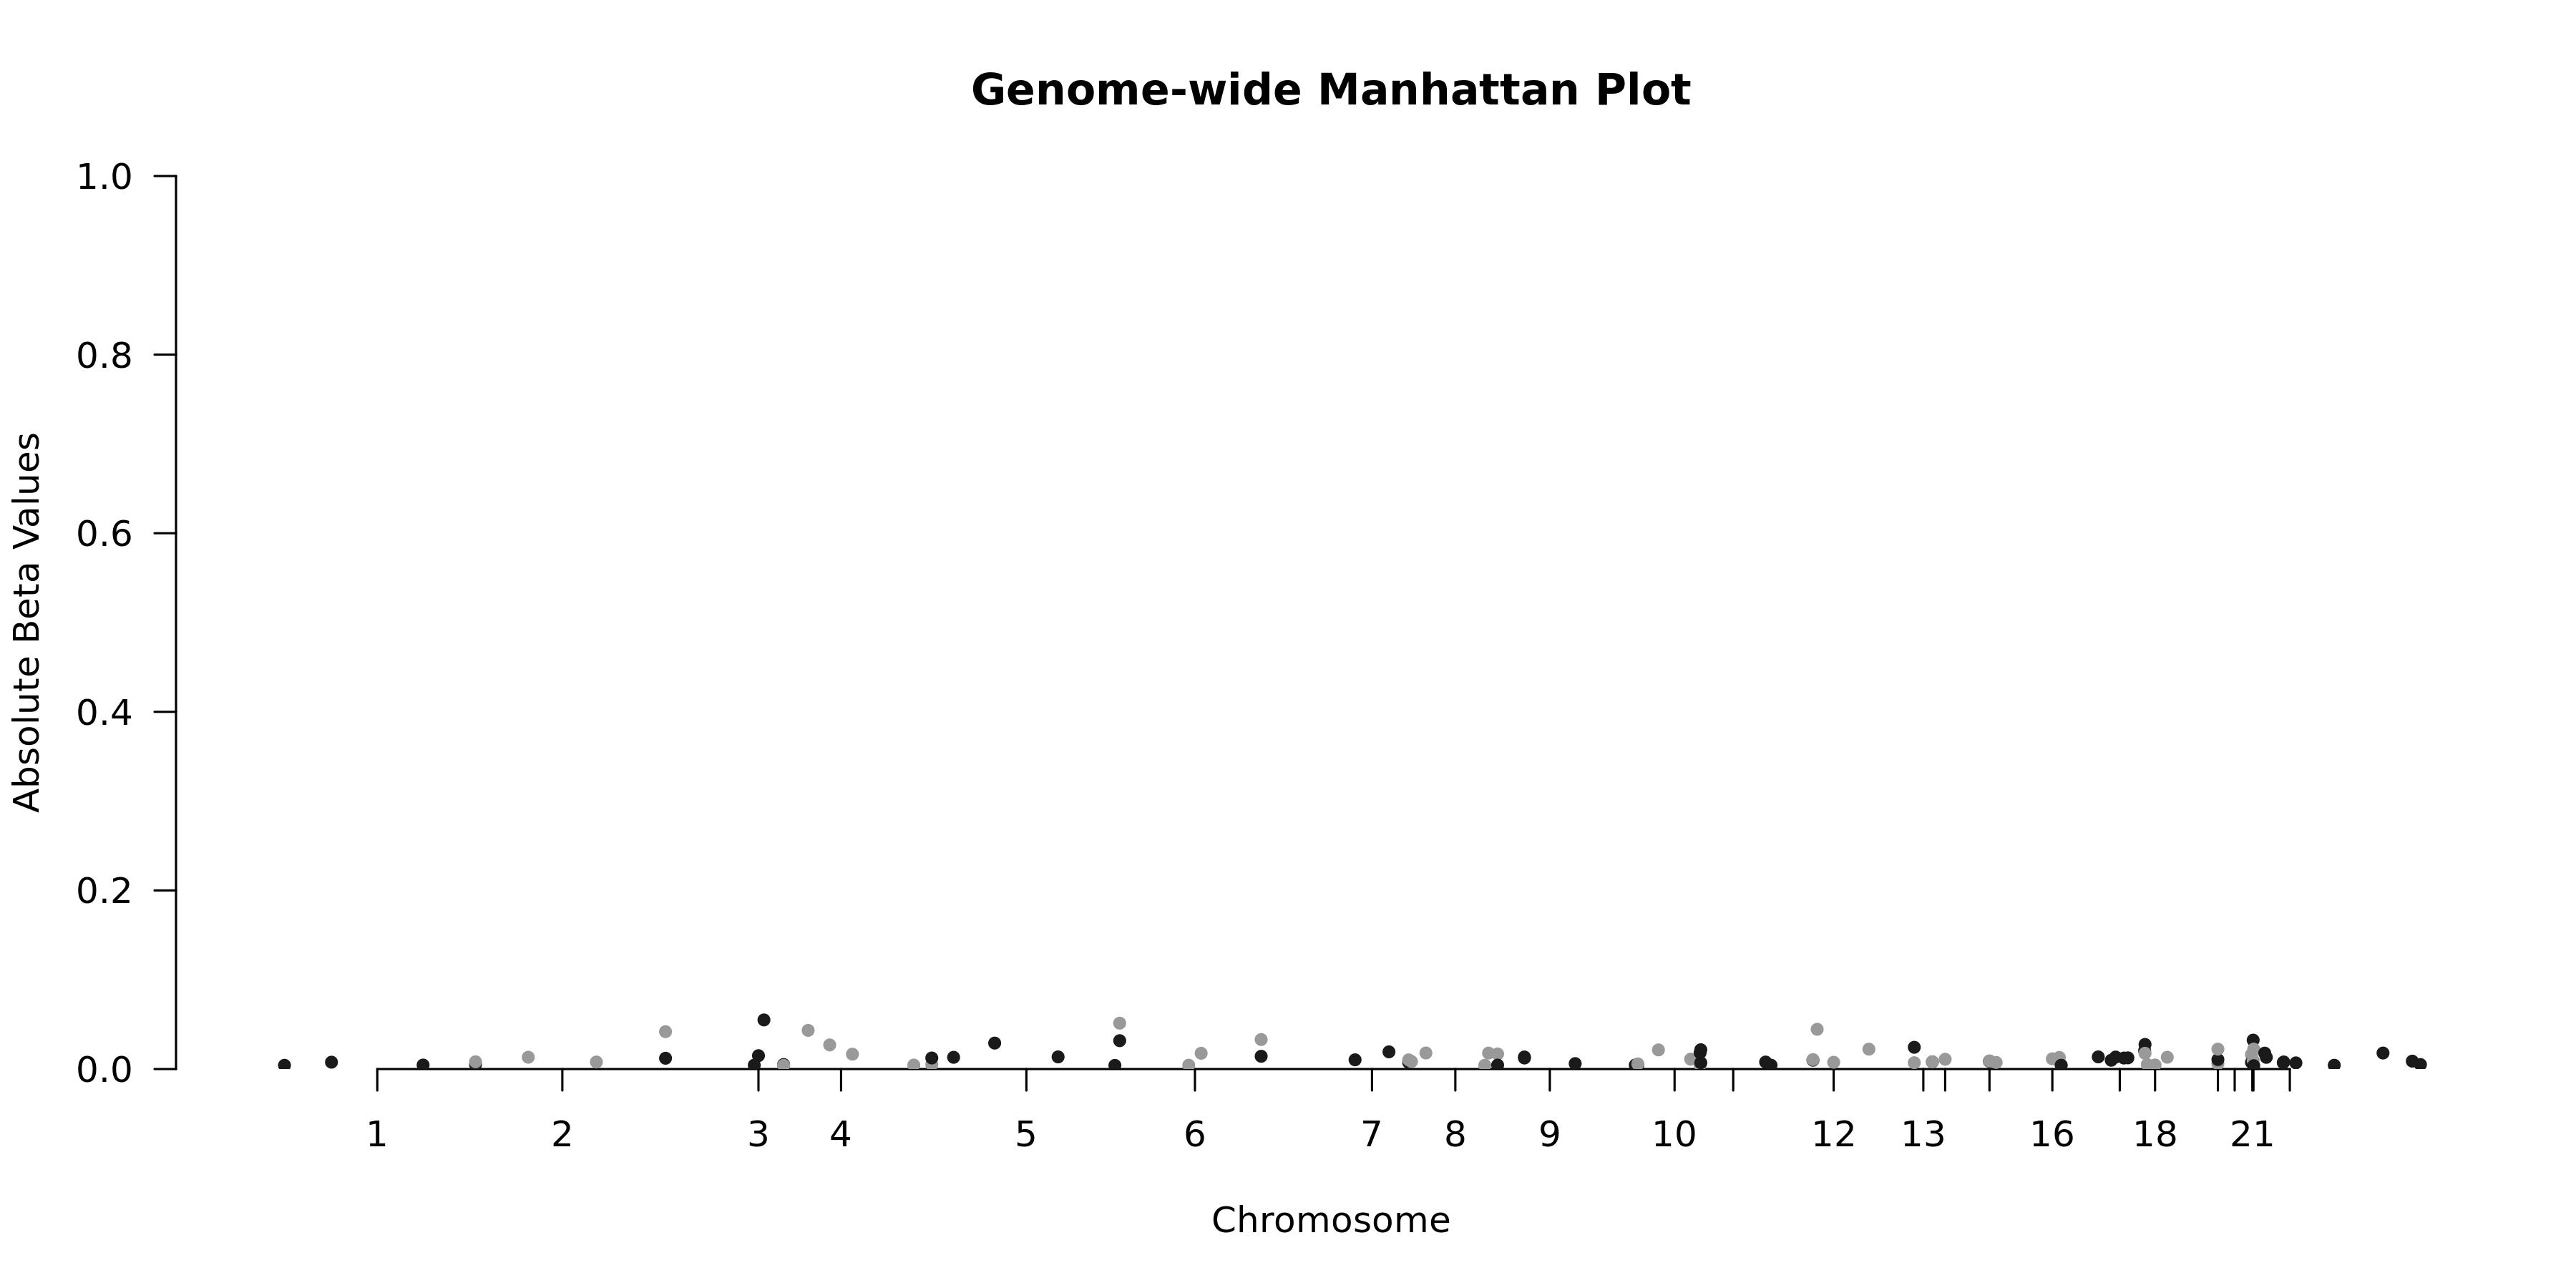
Genome-wide Manhattan Plotenlarge ⤢
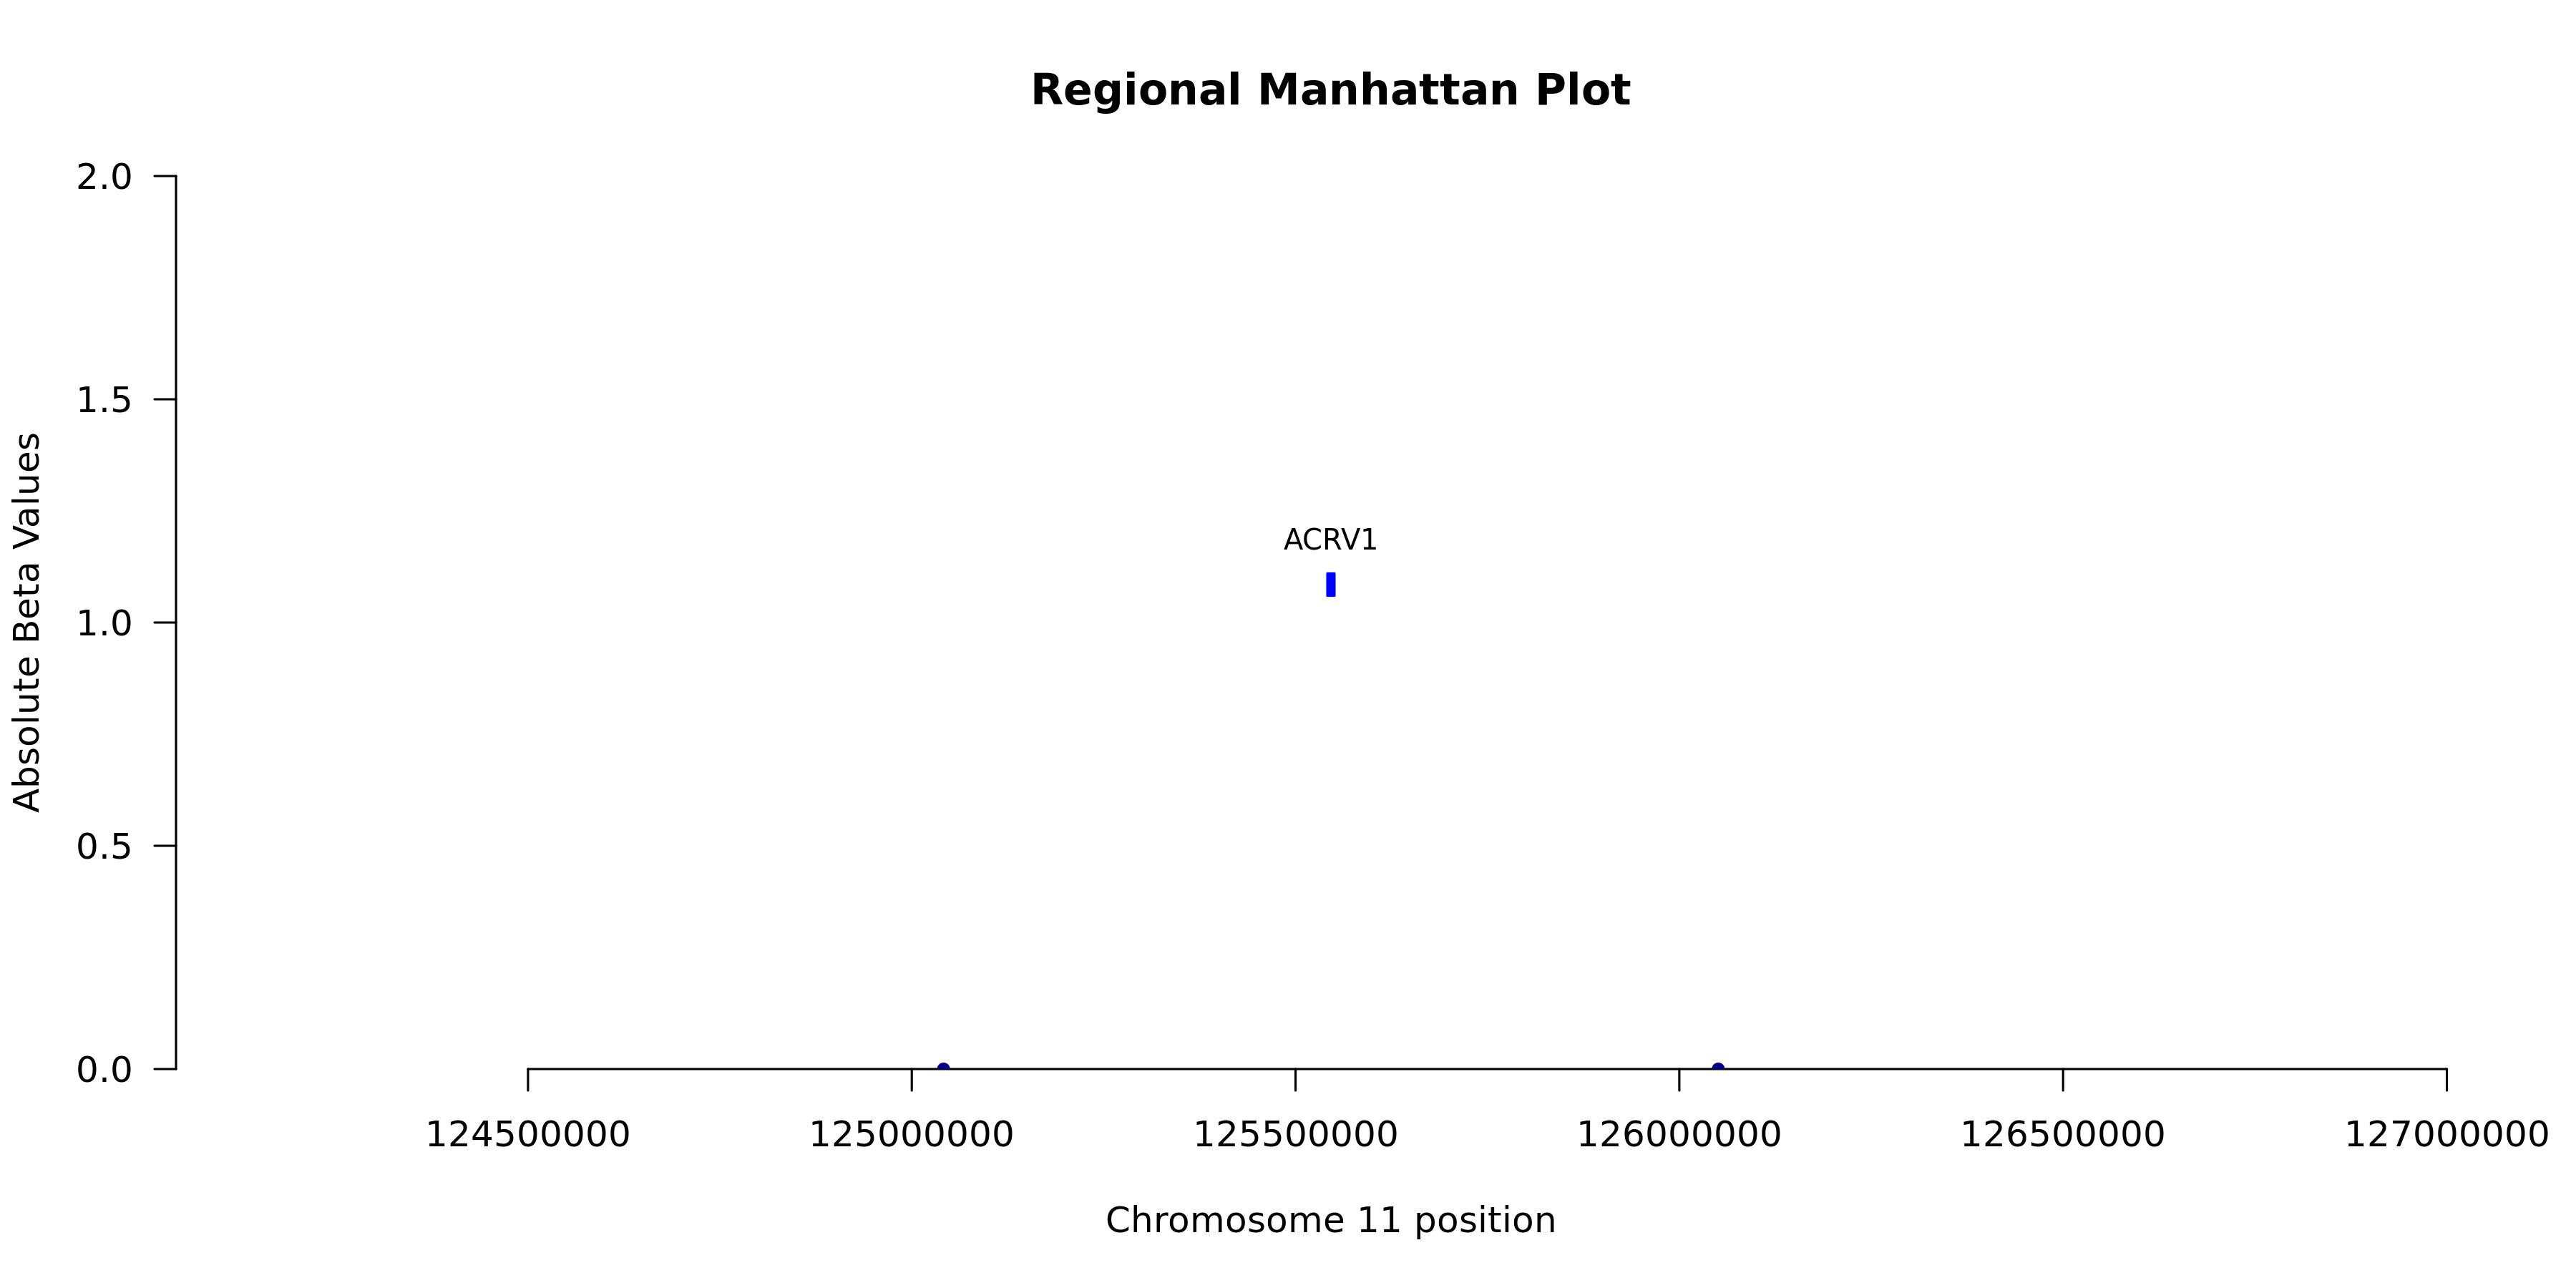
Regional Manhattan Plotenlarge ⤢
Model record
Field
Value
Gene
ACRV1
test_n
10538
sparsity
101
pearson_coefficent
0.163344228274052
SE
0.0107541146465427
P_corr
2.00291593469125e-51
R2 Covariate Model
0.5826
R2 Full Model
0.5881
P
0
P_full
1.13840353267746e-72
n_cis_pqtl
1
max_cis_pqtl
rs111688237
rank_max_cis_pqtl
53
mean_pqtl_beta
0.00986840412990658
mean_nopqtl_beta
0.0134894871123008
percentage_pqtl
0.0099009900990099
percentage_nopqtl
0.99009900990099
cis and genome-wide metrics
Field
Value
Gene
ACRV1
test_n_genomewide
10538
sparsity_genomewide
101
pearson_coefficent_genomewide
0.163344228274052
SE_genomewide
0.0107541146465427
P_corr_genomewide
2.00291593469125e-51
R2_covariate_model_genomewide
0.582554868616025
R2_full_model_genomewide
0.588120754511498
P_genomewide
0
P_full_genomewide
1.13840353267746e-72
n_cis_pqtl
1
max_cis_pqtl
rs111688237
rank_max_cis_pqtl
53
mean_pqtl_beta
0.00986840412990658
mean_nopqtl_beta
0.0134894871123008
percentage_pqtl
0.0099009900990099
percentage_nopqtl
0.99009900990099
test_n_cis
10538
sparsity_cis
1
pearson_coefficent_cis
0.00997172109017672
SE_cis
0.0108999760437397
P_corr_cis
0.360302467968649
R2_covariate_model_cis
0.582554868616024
R2_full_model_cis
0.582558973201304
P_cis
0
P_full_cis
0.928287032836421