ABL1
Olink Explore plasma protein · SNPBoost PRS model
R2 Full Model
0.0277
pearson_coefficent
0.1581
sparsity
132
n_cis_pqtl
1
max_cis_pqtl
rs2229067
Diagnostics
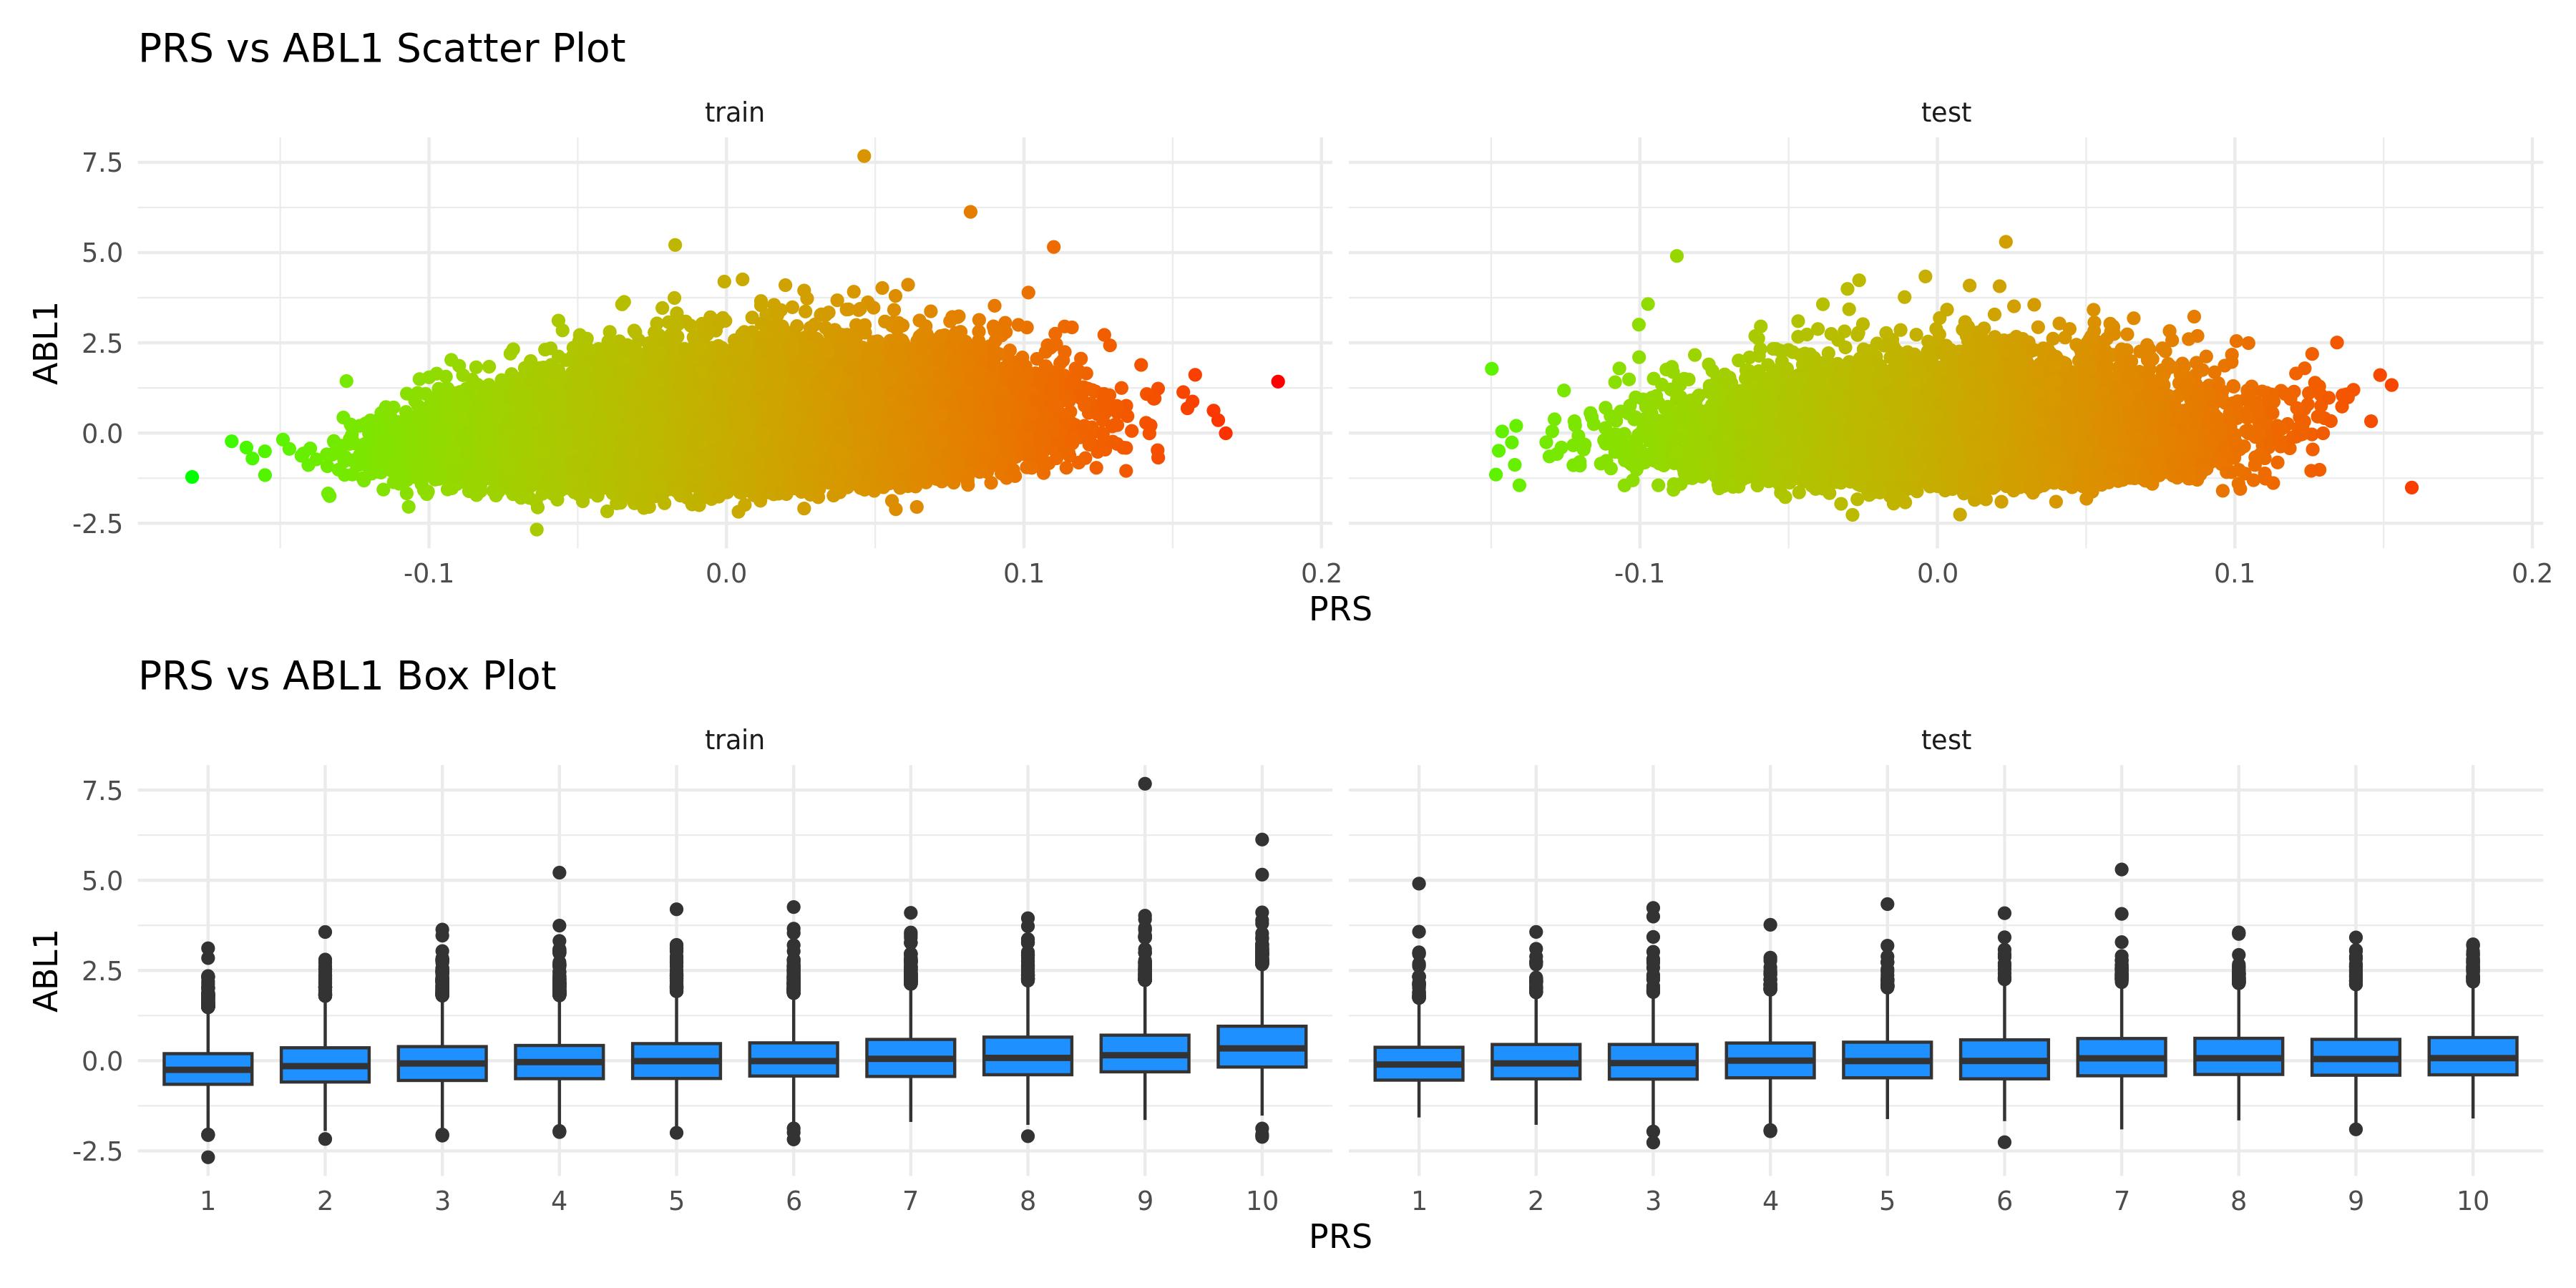
PRS scatter and box plotsenlarge ⤢
Genome-wide Manhattan Plotenlarge ⤢

Regional Manhattan Plotenlarge ⤢

Model record
Field
Value
Gene
ABL1
test_n
10538
sparsity
132
pearson_coefficent
0.158120520355281
SE
0.00978170921847488
P_corr
4.68771764696083e-58
R2 Covariate Model
0.005
R2 Full Model
0.0277
P
1.65450307685362e-64
P_full
2.92860949310056e-179
n_cis_pqtl
1
max_cis_pqtl
rs2229067
rank_max_cis_pqtl
6
mean_pqtl_beta
0.0217915331407308
mean_nopqtl_beta
0.00734586301264514
percentage_pqtl
0.00757575757575758
percentage_nopqtl
0.992424242424242
cis and genome-wide metrics
Field
Value
Gene
ABL1
test_n_genomewide
10538
sparsity_genomewide
132
pearson_coefficent_genomewide
0.158120520355281
SE_genomewide
0.00978170921847488
P_corr_genomewide
4.68771764696083e-58
R2_covariate_model_genomewide
0.00495388164429944
R2_full_model_genomewide
0.0276772550886856
P_genomewide
1.65450307685362e-64
P_full_genomewide
2.92860949310056e-179
n_cis_pqtl
1
max_cis_pqtl
rs2229067
rank_max_cis_pqtl
6
mean_pqtl_beta
0.0217915331407308
mean_nopqtl_beta
0.00734586301264514
percentage_pqtl
0.00757575757575758
percentage_nopqtl
0.992424242424242
test_n_cis
10538
sparsity_cis
1
pearson_coefficent_cis
0.0307598226791751
SE_cis
0.00990164503589946
P_corr_cis
0.00189812983071772
R2_covariate_model_cis
0.00495388164429944
R2_full_model_cis
0.0058008935241668
P_cis
1.31871630292611e-14
P_full_cis
3.06021055330702e-06